

Key Insights
The global Vapor Recovery Units (VRU) market is poised for significant growth, projected to reach an estimated $0.94 billion in 2025 and expand at a robust Compound Annual Growth Rate (CAGR) of 6.11% through 2033. This expansion is driven by an increasing emphasis on environmental regulations and the need for industries to mitigate volatile organic compound (VOC) emissions. The Oil & Gas sector, followed by Chemical & Petrochemical industries, represents the dominant end-user segments, leveraging VRUs for efficient emission control and product loss reduction during storage, processing, and transportation. The market is further propelled by advancements in VRU technology, including more efficient membrane systems and innovative absorption processes that enhance recovery rates and operational efficiency. These technological strides are crucial in meeting stringent environmental standards and optimizing resource management for businesses.
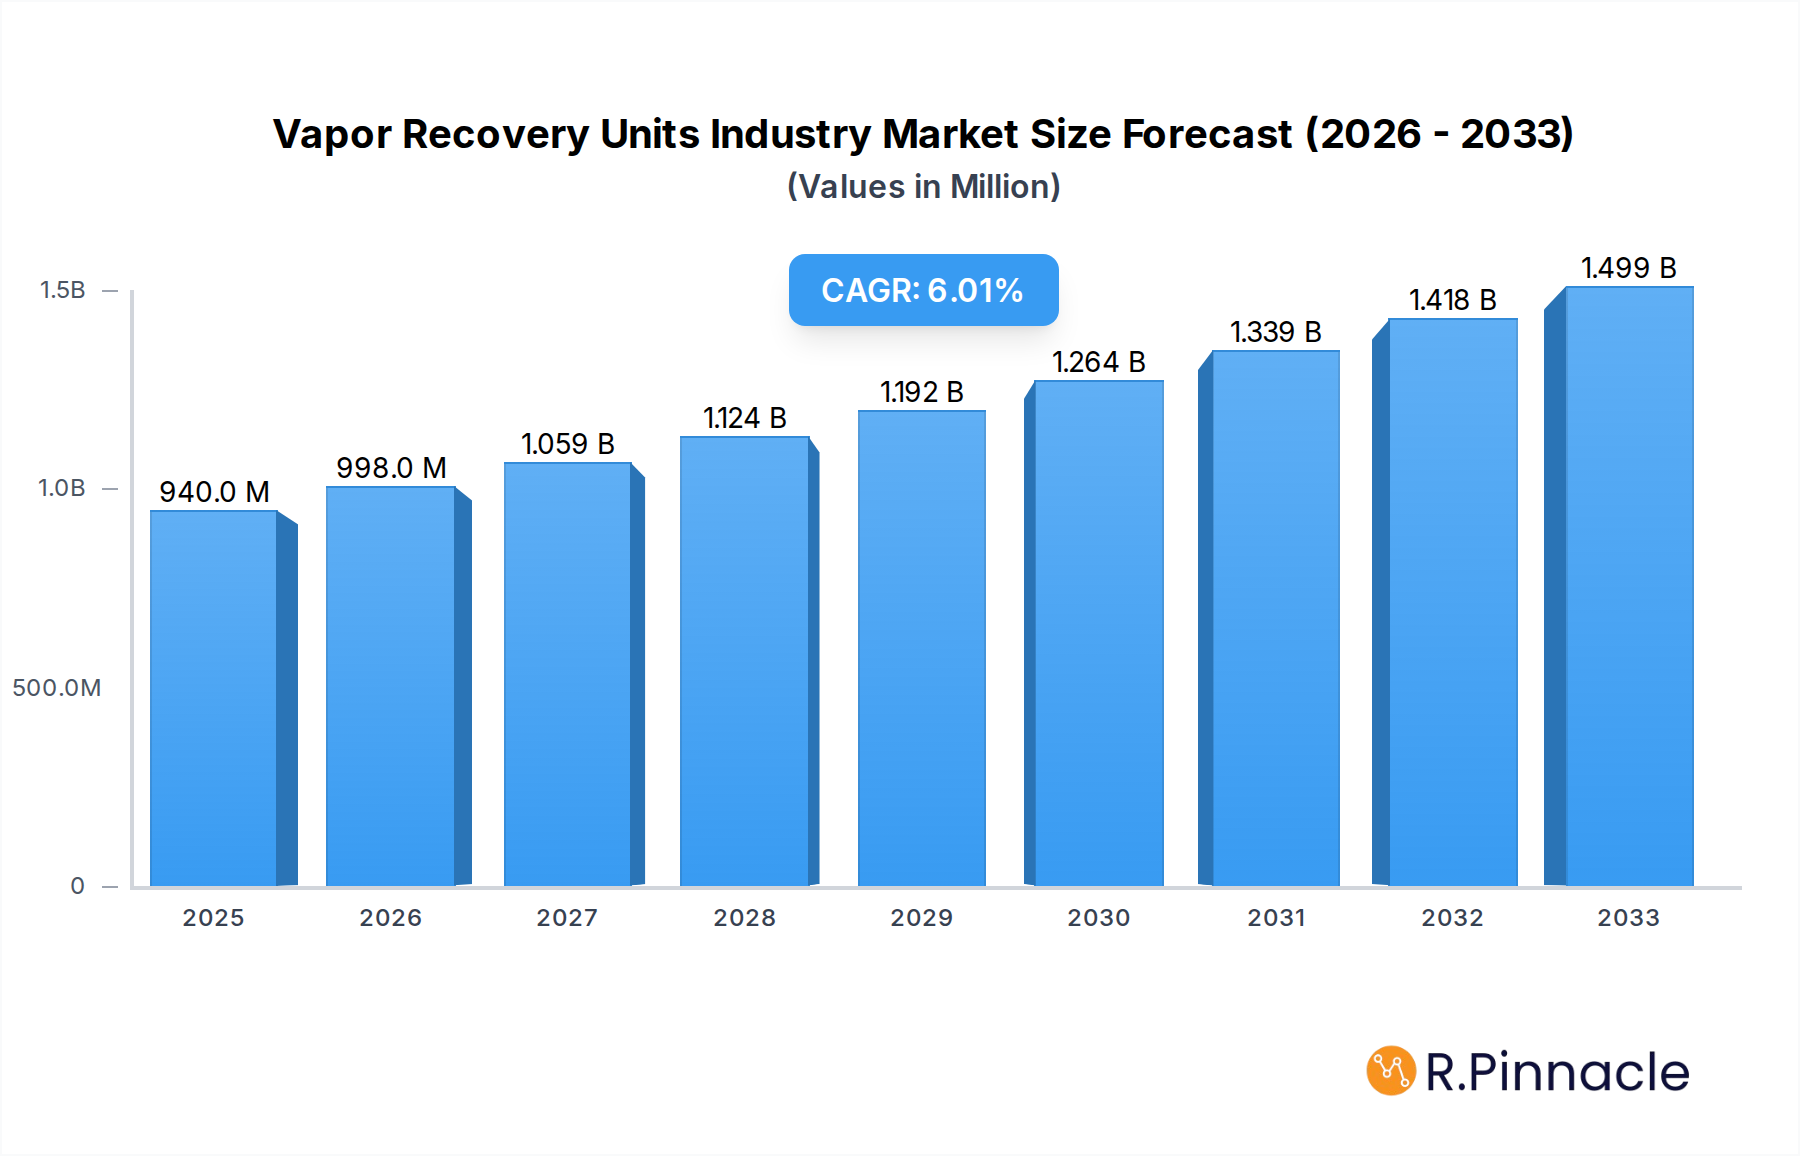
Vapor Recovery Units Industry Market Size (In Million)
The market's upward trajectory is also supported by a growing awareness of the economic benefits associated with VRUs, such as the recovery of valuable hydrocarbons and reduced operational costs. While stringent environmental regulations act as a primary growth driver, the increasing adoption of these units across various industrial applications, from oil terminals and refineries to chemical plants and solvent recovery operations, underscores their critical role in sustainable industrial practices. Key players are investing in research and development to offer more cost-effective and energy-efficient VRU solutions, catering to a diverse range of applications and end-user needs. The North America and Europe regions are expected to lead in market adoption due to well-established environmental frameworks and a strong industrial base, with the Asia Pacific region demonstrating considerable growth potential in the coming years.

Vapor Recovery Units Industry Company Market Share
Vapor Recovery Units Industry Market Structure & Innovation Trends
The Vapor Recovery Units (VRU) industry is characterized by a moderately concentrated market structure, with a blend of established global players and specialized regional manufacturers. Key innovators driving advancements in this sector include Cool Sorption A/S, FLOGISTIX LP, BORSIG Membrane Technology GmbH, Zeeco Inc, ALMA CARBOVAC, Kappa GI, John Zink Company LLC, Kilburn Engineering Ltd, AEREON, Symex GmbH & Co KG, Hy-Bon Engineering Company Inc, and VOCZero Ltd. Innovation is primarily propelled by stringent environmental regulations mandating VOC emission control, coupled with the pursuit of operational efficiency and cost reduction within the Oil & Gas, Chemical & Petrochemical, and other industrial sectors. Regulatory frameworks, such as EPA standards and REACH directives, are pivotal in shaping market demand and technological adoption. While product substitutes exist, such as flare systems, their efficacy and environmental compliance are often inferior to advanced VRU technologies, particularly in sensitive applications like Processing, Storage, and Transportation. End-user demographics are shifting towards a greater emphasis on sustainability and compliance. Mergers and acquisitions (M&A) activities, with an estimated global deal value exceeding $X billion in the historical period, are expected to continue, consolidating market share and fostering technological integration.
Vapor Recovery Units Industry Market Dynamics & Trends
The global Vapor Recovery Units (VRU) market is poised for significant expansion, driven by an escalating global focus on environmental sustainability and stringent regulations governing volatile organic compound (VOC) emissions. The Oil & Gas sector, a primary consumer of VRUs for applications in Processing, Storage, and Transportation of hydrocarbons, continues to be a dominant force, demanding innovative solutions to mitigate fugitive emissions at every stage of the value chain. Similarly, the Chemical & Petrochemical industry is witnessing robust demand for VRUs to comply with emission standards and enhance operational safety, particularly in the handling of hazardous materials. The compound annual growth rate (CAGR) for the VRU market is projected to be a healthy XX%, indicating a sustained upward trajectory. Market penetration is increasing across both developed and emerging economies as industries recognize the economic and environmental benefits of VRU implementation, including reduced product loss and improved air quality. Technological disruptions are a constant feature, with advancements in membrane separation, adsorption, and condensation technologies offering higher recovery efficiencies and lower energy consumption. Consumer preferences are increasingly leaning towards modular, scalable, and intelligent VRU systems that can be integrated seamlessly into existing infrastructure and provide real-time monitoring capabilities. The competitive landscape is dynamic, marked by strategic partnerships, product differentiation, and a growing emphasis on lifecycle services. The overarching trend is towards more sophisticated, cost-effective, and environmentally responsible vapor recovery solutions.
Dominant Regions & Segments in Vapor Recovery Units Industry
North America currently stands as the dominant region in the Vapor Recovery Units (VRU) industry, largely propelled by the extensive Oil & Gas sector in the United States and Canada, coupled with stringent federal and state environmental regulations. Within this region, the Processing segment, encompassing refining operations and upstream production facilities, exhibits the highest demand for VRUs. The Oil & Gas end-user industry underpins this dominance, with companies heavily investing in technologies to reduce VOC emissions during crude oil extraction, storage, and transportation.
- Key Drivers for North American Dominance:
- Stringent Environmental Regulations: The US Environmental Protection Agency (EPA) and various state agencies have implemented rigorous emission control standards, creating a strong market pull for VRU solutions.
- Vast Oil & Gas Infrastructure: The sheer scale of existing oil and gas infrastructure, including refineries, pipelines, and storage terminals, necessitates widespread VRU deployment.
- Technological Advancement and Adoption: North America is a hub for technological innovation in VRU design and implementation, fostering a receptive market for advanced solutions.
- Economic Policies Supporting Environmental Compliance: Government incentives and tax credits often encourage companies to invest in emission reduction technologies.
The Chemical & Petrochemical industry in North America also contributes significantly to the VRU market, with a growing number of facilities adopting these units to manage hazardous air pollutants and comply with evolving environmental mandates. The Storage segment, across both Oil & Gas and Chemical sectors, is also witnessing substantial growth as regulations tighten on tank emissions.
In terms of global market share, Asia-Pacific is emerging as a rapidly growing region, driven by industrialization, increasing energy demand, and a growing awareness of environmental protection. Countries like China and India are witnessing substantial investments in their petrochemical and refining capacities, thereby boosting the demand for VRUs.
Vapor Recovery Units Industry Product Innovations
Product innovations in the Vapor Recovery Units (VRU) industry are centered on enhancing recovery efficiency, reducing operational costs, and improving environmental compliance. Key developments include the integration of advanced membrane technologies for selective VOC separation, energy-efficient adsorption systems utilizing activated carbon or zeolites, and compact, modular designs for easier installation and scalability. These innovations offer superior performance in applications like Processing, Storage, and Transportation, particularly for the Oil & Gas and Chemical & Petrochemical sectors. Competitive advantages stem from lower energy consumption, higher capture rates, and robust data monitoring capabilities.
Report Scope & Segmentation Analysis
This report provides a comprehensive analysis of the Vapor Recovery Units (VRU) market across key segmentations.
Application:
- Processing: This segment focuses on VRUs used in industrial processes to capture and recover vapors emitted during manufacturing or refinement. Projected growth is XX% with a market size of $X billion in 2025.
- Storage: This segment analyzes VRUs deployed in storage facilities, such as tank farms, to mitigate vapor loss and emissions. Expected growth of XX% with a market size of $X billion in 2025.
- Transportation: This segment examines VRUs used during the transportation of volatile liquids, including pipelines and loading/unloading operations. Anticipated growth of XX% with a market size of $X billion in 2025.
End-User:
- Oil & Gas: This segment covers VRUs utilized throughout the upstream, midstream, and downstream oil and gas operations. It is expected to grow at XX% with a market size of $X billion in 2025.
- Chemical & Petrochemical: This segment includes VRUs in chemical plants and refineries to manage emissions. Projected to grow at XX% with a market size of $X billion in 2025.
- Others: This encompasses VRU applications in industries such as pharmaceuticals, food and beverage, and printing. Anticipated growth of XX% with a market size of $X billion in 2025.
Key Drivers of Vapor Recovery Units Industry Growth
The Vapor Recovery Units (VRU) industry's growth is primarily driven by a confluence of critical factors. Escalating environmental regulations globally, mandating the reduction of volatile organic compound (VOC) emissions, are the most significant catalyst, compelling industries to invest in compliant technologies. Furthermore, the inherent economic benefits of VRUs, such as reduced product loss, improved safety, and the potential for revenue generation from recovered vapors, are substantial drivers. Technological advancements, leading to more efficient, cost-effective, and adaptable VRU systems, also fuel market expansion.
Challenges in the Vapor Recovery Units Industry Sector
Despite robust growth, the Vapor Recovery Units (VRU) industry faces several challenges. Stringent and evolving regulatory landscapes can create compliance complexities and necessitate continuous technological upgrades, leading to increased capital expenditure for businesses. High initial investment costs for advanced VRU systems can be a barrier for smaller enterprises. Supply chain disruptions for critical components and the availability of skilled labor for installation and maintenance also pose significant hurdles. Moreover, the presence of cost-effective, albeit less environmentally friendly, alternative emission control methods can create competitive pressure in certain markets.
Emerging Opportunities in Vapor Recovery Units Industry
Emerging opportunities within the Vapor Recovery Units (VRU) industry are centered around technological innovation and expanding market penetration. The development of smart VRU systems with advanced IoT capabilities for real-time monitoring, predictive maintenance, and remote diagnostics presents a significant growth avenue. The increasing focus on carbon capture and utilization (CCU) technologies integrated with VRUs offers a dual benefit for industries. Furthermore, the growing industrialization in emerging economies, particularly in the Asia-Pacific region, opens up new and substantial markets for VRU solutions. The demand for specialized VRUs tailored for specific VOCs or challenging operating conditions also represents an untapped opportunity.
Leading Players in the Vapor Recovery Units Industry Market
- Cool Sorption A/S
- FLOGISTIX LP
- BORSIG Membrane Technology GmbH
- Zeeco Inc
- ALMA CARBOVAC
- Kappa GI
- John Zink Company LLC
- Kilburn Engineering Ltd
- AEREON
- Symex GmbH & Co KG
- Hy-Bon Engineering Company Inc
- VOCZero Ltd
Key Developments in Vapor Recovery Units Industry Industry
- 2024 (Q1): Launch of a new generation of high-efficiency membrane-based VRUs by Cool Sorption A/S, offering increased VOC capture rates for the petrochemical sector.
- 2023 (Q4): Zeeco Inc. secured a significant contract for the supply of VRU systems to a major LNG export terminal in North America, highlighting demand in the energy infrastructure sector.
- 2023 (Q3): BORSIG Membrane Technology GmbH announced a strategic partnership with a leading chemical producer to develop customized VRU solutions for hazardous chemical storage.
- 2023 (Q2): John Zink Company LLC introduced an advanced adsorption-based VRU system with enhanced energy recovery capabilities, targeting the Oil & Gas midstream sector.
- 2022 (Q4): FLOGISTIX LP expanded its product portfolio with the acquisition of a company specializing in modular VRU solutions for smaller-scale oil and gas operations.
Future Outlook for Vapor Recovery Units Industry Market
The future outlook for the Vapor Recovery Units (VRU) market is highly optimistic, driven by an unwavering global commitment to environmental stewardship and increasingly stringent emission control regulations. The continuous growth of the Oil & Gas and Chemical & Petrochemical industries, coupled with the expanding industrial base in emerging economies, will sustain and accelerate demand. Innovations in VRU technology, particularly in areas like smart systems, energy efficiency, and integration with carbon capture solutions, will unlock new market segments and drive value creation. Strategic collaborations and potential M&A activities will likely reshape the competitive landscape, fostering further technological advancements and market consolidation. The VRU market is set to play a pivotal role in achieving global sustainability goals.
Vapor Recovery Units Industry Segmentation
-
1. Application
- 1.1. Processing
- 1.2. Storage
- 1.3. Transportation
-
2. End-User
- 2.1. Oil & Gas
- 2.2. Chemical & Petrochemical
- 2.3. Others
Vapor Recovery Units Industry Segmentation By Geography
- 1. North America
- 2. Europe
- 3. Asia Pacific
- 4. South America
- 5. Middle East and Africa

Vapor Recovery Units Industry Regional Market Share
Geographic Coverage of Vapor Recovery Units Industry
Vapor Recovery Units Industry REPORT HIGHLIGHTS
| Aspects | Details |
|---|---|
| Study Period | 2020-2034 |
| Base Year | 2025 |
| Estimated Year | 2026 |
| Forecast Period | 2026-2034 |
| Historical Period | 2020-2025 |
| Growth Rate | CAGR of 6.11% from 2020-2034 |
| Segmentation |
|
Table of Contents
- 1. Introduction
- 1.1. Research Scope
- 1.2. Market Segmentation
- 1.3. Research Objective
- 1.4. Definitions and Assumptions
- 2. Executive Summary
- 2.1. Market Snapshot
- 3. Market Dynamics
- 3.1. Market Drivers
- 3.2. Market Restrains
- 3.3. Market Trends
- 3.4. Market Opportunities
- 4. Market Factor Analysis
- 4.1. Porters Five Forces
- 4.1.1. Bargaining Power of Suppliers
- 4.1.2. Bargaining Power of Buyers
- 4.1.3. Threat of New Entrants
- 4.1.4. Threat of Substitutes
- 4.1.5. Competitive Rivalry
- 4.2. PESTEL analysis
- 4.3. BCG Analysis
- 4.3.1. Stars (High Growth, High Market Share)
- 4.3.2. Cash Cows (Low Growth, High Market Share)
- 4.3.3. Question Mark (High Growth, Low Market Share)
- 4.3.4. Dogs (Low Growth, Low Market Share)
- 4.4. Ansoff Matrix Analysis
- 4.5. Supply Chain Analysis
- 4.6. Regulatory Landscape
- 4.7. Current Market Potential and Opportunity Assessment (TAM–SAM–SOM Framework)
- 4.8. PRI Analyst Note
- 4.1. Porters Five Forces
- 5. Market Analysis, Insights and Forecast 2021-2033
- 5.1. Market Analysis, Insights and Forecast - by Application
- 5.1.1. Processing
- 5.1.2. Storage
- 5.1.3. Transportation
- 5.2. Market Analysis, Insights and Forecast - by End-User
- 5.2.1. Oil & Gas
- 5.2.2. Chemical & Petrochemical
- 5.2.3. Others
- 5.3. Market Analysis, Insights and Forecast - by Region
- 5.3.1. North America
- 5.3.2. Europe
- 5.3.3. Asia Pacific
- 5.3.4. South America
- 5.3.5. Middle East and Africa
- 5.1. Market Analysis, Insights and Forecast - by Application
- 6. Global Vapor Recovery Units Industry Analysis, Insights and Forecast, 2021-2033
- 6.1. Market Analysis, Insights and Forecast - by Application
- 6.1.1. Processing
- 6.1.2. Storage
- 6.1.3. Transportation
- 6.2. Market Analysis, Insights and Forecast - by End-User
- 6.2.1. Oil & Gas
- 6.2.2. Chemical & Petrochemical
- 6.2.3. Others
- 6.1. Market Analysis, Insights and Forecast - by Application
- 7. North America Vapor Recovery Units Industry Analysis, Insights and Forecast, 2020-2032
- 7.1. Market Analysis, Insights and Forecast - by Application
- 7.1.1. Processing
- 7.1.2. Storage
- 7.1.3. Transportation
- 7.2. Market Analysis, Insights and Forecast - by End-User
- 7.2.1. Oil & Gas
- 7.2.2. Chemical & Petrochemical
- 7.2.3. Others
- 7.1. Market Analysis, Insights and Forecast - by Application
- 8. Europe Vapor Recovery Units Industry Analysis, Insights and Forecast, 2020-2032
- 8.1. Market Analysis, Insights and Forecast - by Application
- 8.1.1. Processing
- 8.1.2. Storage
- 8.1.3. Transportation
- 8.2. Market Analysis, Insights and Forecast - by End-User
- 8.2.1. Oil & Gas
- 8.2.2. Chemical & Petrochemical
- 8.2.3. Others
- 8.1. Market Analysis, Insights and Forecast - by Application
- 9. Asia Pacific Vapor Recovery Units Industry Analysis, Insights and Forecast, 2020-2032
- 9.1. Market Analysis, Insights and Forecast - by Application
- 9.1.1. Processing
- 9.1.2. Storage
- 9.1.3. Transportation
- 9.2. Market Analysis, Insights and Forecast - by End-User
- 9.2.1. Oil & Gas
- 9.2.2. Chemical & Petrochemical
- 9.2.3. Others
- 9.1. Market Analysis, Insights and Forecast - by Application
- 10. South America Vapor Recovery Units Industry Analysis, Insights and Forecast, 2020-2032
- 10.1. Market Analysis, Insights and Forecast - by Application
- 10.1.1. Processing
- 10.1.2. Storage
- 10.1.3. Transportation
- 10.2. Market Analysis, Insights and Forecast - by End-User
- 10.2.1. Oil & Gas
- 10.2.2. Chemical & Petrochemical
- 10.2.3. Others
- 10.1. Market Analysis, Insights and Forecast - by Application
- 11. Middle East and Africa Vapor Recovery Units Industry Analysis, Insights and Forecast, 2020-2032
- 11.1. Market Analysis, Insights and Forecast - by Application
- 11.1.1. Processing
- 11.1.2. Storage
- 11.1.3. Transportation
- 11.2. Market Analysis, Insights and Forecast - by End-User
- 11.2.1. Oil & Gas
- 11.2.2. Chemical & Petrochemical
- 11.2.3. Others
- 11.1. Market Analysis, Insights and Forecast - by Application
- 12. Competitive Analysis
- 12.1. Company Profiles
- 12.1.1 Cool Sorption A/S
- 12.1.1.1. Company Overview
- 12.1.1.2. Products
- 12.1.1.3. Company Financials
- 12.1.1.4. SWOT Analysis
- 12.1.2 FLOGISTIX LP
- 12.1.2.1. Company Overview
- 12.1.2.2. Products
- 12.1.2.3. Company Financials
- 12.1.2.4. SWOT Analysis
- 12.1.3 BORSIG Membrane Technology GmbH
- 12.1.3.1. Company Overview
- 12.1.3.2. Products
- 12.1.3.3. Company Financials
- 12.1.3.4. SWOT Analysis
- 12.1.4 Zeeco Inc
- 12.1.4.1. Company Overview
- 12.1.4.2. Products
- 12.1.4.3. Company Financials
- 12.1.4.4. SWOT Analysis
- 12.1.5 ALMA CARBOVAC
- 12.1.5.1. Company Overview
- 12.1.5.2. Products
- 12.1.5.3. Company Financials
- 12.1.5.4. SWOT Analysis
- 12.1.6 Kappa GI
- 12.1.6.1. Company Overview
- 12.1.6.2. Products
- 12.1.6.3. Company Financials
- 12.1.6.4. SWOT Analysis
- 12.1.7 John Zink Company LLC
- 12.1.7.1. Company Overview
- 12.1.7.2. Products
- 12.1.7.3. Company Financials
- 12.1.7.4. SWOT Analysis
- 12.1.8 Kilburn Engineering Ltd*List Not Exhaustive
- 12.1.8.1. Company Overview
- 12.1.8.2. Products
- 12.1.8.3. Company Financials
- 12.1.8.4. SWOT Analysis
- 12.1.9 AEREON
- 12.1.9.1. Company Overview
- 12.1.9.2. Products
- 12.1.9.3. Company Financials
- 12.1.9.4. SWOT Analysis
- 12.1.10 Symex GmbH & Co KG
- 12.1.10.1. Company Overview
- 12.1.10.2. Products
- 12.1.10.3. Company Financials
- 12.1.10.4. SWOT Analysis
- 12.1.11 Hy-Bon Engineering Company Inc
- 12.1.11.1. Company Overview
- 12.1.11.2. Products
- 12.1.11.3. Company Financials
- 12.1.11.4. SWOT Analysis
- 12.1.12 VOCZero Ltd
- 12.1.12.1. Company Overview
- 12.1.12.2. Products
- 12.1.12.3. Company Financials
- 12.1.12.4. SWOT Analysis
- 12.1.1 Cool Sorption A/S
- 12.2. Market Entropy
- 12.2.1 Company's Key Areas Served
- 12.2.2 Recent Developments
- 12.3. Company Market Share Analysis 2025
- 12.3.1 Top 5 Companies Market Share Analysis
- 12.3.2 Top 3 Companies Market Share Analysis
- 12.4. List of Potential Customers
- 13. Research Methodology
List of Figures
- Figure 1: Global Vapor Recovery Units Industry Revenue Breakdown (billion, %) by Region 2025 & 2033
- Figure 2: North America Vapor Recovery Units Industry Revenue (billion), by Application 2025 & 2033
- Figure 3: North America Vapor Recovery Units Industry Revenue Share (%), by Application 2025 & 2033
- Figure 4: North America Vapor Recovery Units Industry Revenue (billion), by End-User 2025 & 2033
- Figure 5: North America Vapor Recovery Units Industry Revenue Share (%), by End-User 2025 & 2033
- Figure 6: North America Vapor Recovery Units Industry Revenue (billion), by Country 2025 & 2033
- Figure 7: North America Vapor Recovery Units Industry Revenue Share (%), by Country 2025 & 2033
- Figure 8: Europe Vapor Recovery Units Industry Revenue (billion), by Application 2025 & 2033
- Figure 9: Europe Vapor Recovery Units Industry Revenue Share (%), by Application 2025 & 2033
- Figure 10: Europe Vapor Recovery Units Industry Revenue (billion), by End-User 2025 & 2033
- Figure 11: Europe Vapor Recovery Units Industry Revenue Share (%), by End-User 2025 & 2033
- Figure 12: Europe Vapor Recovery Units Industry Revenue (billion), by Country 2025 & 2033
- Figure 13: Europe Vapor Recovery Units Industry Revenue Share (%), by Country 2025 & 2033
- Figure 14: Asia Pacific Vapor Recovery Units Industry Revenue (billion), by Application 2025 & 2033
- Figure 15: Asia Pacific Vapor Recovery Units Industry Revenue Share (%), by Application 2025 & 2033
- Figure 16: Asia Pacific Vapor Recovery Units Industry Revenue (billion), by End-User 2025 & 2033
- Figure 17: Asia Pacific Vapor Recovery Units Industry Revenue Share (%), by End-User 2025 & 2033
- Figure 18: Asia Pacific Vapor Recovery Units Industry Revenue (billion), by Country 2025 & 2033
- Figure 19: Asia Pacific Vapor Recovery Units Industry Revenue Share (%), by Country 2025 & 2033
- Figure 20: South America Vapor Recovery Units Industry Revenue (billion), by Application 2025 & 2033
- Figure 21: South America Vapor Recovery Units Industry Revenue Share (%), by Application 2025 & 2033
- Figure 22: South America Vapor Recovery Units Industry Revenue (billion), by End-User 2025 & 2033
- Figure 23: South America Vapor Recovery Units Industry Revenue Share (%), by End-User 2025 & 2033
- Figure 24: South America Vapor Recovery Units Industry Revenue (billion), by Country 2025 & 2033
- Figure 25: South America Vapor Recovery Units Industry Revenue Share (%), by Country 2025 & 2033
- Figure 26: Middle East and Africa Vapor Recovery Units Industry Revenue (billion), by Application 2025 & 2033
- Figure 27: Middle East and Africa Vapor Recovery Units Industry Revenue Share (%), by Application 2025 & 2033
- Figure 28: Middle East and Africa Vapor Recovery Units Industry Revenue (billion), by End-User 2025 & 2033
- Figure 29: Middle East and Africa Vapor Recovery Units Industry Revenue Share (%), by End-User 2025 & 2033
- Figure 30: Middle East and Africa Vapor Recovery Units Industry Revenue (billion), by Country 2025 & 2033
- Figure 31: Middle East and Africa Vapor Recovery Units Industry Revenue Share (%), by Country 2025 & 2033
List of Tables
- Table 1: Global Vapor Recovery Units Industry Revenue billion Forecast, by Application 2020 & 2033
- Table 2: Global Vapor Recovery Units Industry Revenue billion Forecast, by End-User 2020 & 2033
- Table 3: Global Vapor Recovery Units Industry Revenue billion Forecast, by Region 2020 & 2033
- Table 4: Global Vapor Recovery Units Industry Revenue billion Forecast, by Application 2020 & 2033
- Table 5: Global Vapor Recovery Units Industry Revenue billion Forecast, by End-User 2020 & 2033
- Table 6: Global Vapor Recovery Units Industry Revenue billion Forecast, by Country 2020 & 2033
- Table 7: Global Vapor Recovery Units Industry Revenue billion Forecast, by Application 2020 & 2033
- Table 8: Global Vapor Recovery Units Industry Revenue billion Forecast, by End-User 2020 & 2033
- Table 9: Global Vapor Recovery Units Industry Revenue billion Forecast, by Country 2020 & 2033
- Table 10: Global Vapor Recovery Units Industry Revenue billion Forecast, by Application 2020 & 2033
- Table 11: Global Vapor Recovery Units Industry Revenue billion Forecast, by End-User 2020 & 2033
- Table 12: Global Vapor Recovery Units Industry Revenue billion Forecast, by Country 2020 & 2033
- Table 13: Global Vapor Recovery Units Industry Revenue billion Forecast, by Application 2020 & 2033
- Table 14: Global Vapor Recovery Units Industry Revenue billion Forecast, by End-User 2020 & 2033
- Table 15: Global Vapor Recovery Units Industry Revenue billion Forecast, by Country 2020 & 2033
- Table 16: Global Vapor Recovery Units Industry Revenue billion Forecast, by Application 2020 & 2033
- Table 17: Global Vapor Recovery Units Industry Revenue billion Forecast, by End-User 2020 & 2033
- Table 18: Global Vapor Recovery Units Industry Revenue billion Forecast, by Country 2020 & 2033
Frequently Asked Questions
1. What is the projected Compound Annual Growth Rate (CAGR) of the Vapor Recovery Units Industry?
The projected CAGR is approximately 6.11%.
2. Which companies are prominent players in the Vapor Recovery Units Industry?
Key companies in the market include Cool Sorption A/S, FLOGISTIX LP, BORSIG Membrane Technology GmbH, Zeeco Inc, ALMA CARBOVAC, Kappa GI, John Zink Company LLC, Kilburn Engineering Ltd*List Not Exhaustive, AEREON, Symex GmbH & Co KG, Hy-Bon Engineering Company Inc, VOCZero Ltd.
3. What are the main segments of the Vapor Recovery Units Industry?
The market segments include Application, End-User.
4. Can you provide details about the market size?
The market size is estimated to be USD 0.94 billion as of 2022.
5. What are some drivers contributing to market growth?
4.; Rising Environmental Concerns and Energy Security in the Country4.; Increasing Focus on Renewable Energy.
6. What are the notable trends driving market growth?
Oil & gas Sector to Dominate the Market.
7. Are there any restraints impacting market growth?
4.; Availability of Abundance Natural Fossil Fuel Reserves.
8. Can you provide examples of recent developments in the market?
N/A
9. What pricing options are available for accessing the report?
Pricing options include single-user, multi-user, and enterprise licenses priced at USD 4750, USD 5250, and USD 8750 respectively.
10. Is the market size provided in terms of value or volume?
The market size is provided in terms of value, measured in billion.
11. Are there any specific market keywords associated with the report?
Yes, the market keyword associated with the report is "Vapor Recovery Units Industry," which aids in identifying and referencing the specific market segment covered.
12. How do I determine which pricing option suits my needs best?
The pricing options vary based on user requirements and access needs. Individual users may opt for single-user licenses, while businesses requiring broader access may choose multi-user or enterprise licenses for cost-effective access to the report.
13. Are there any additional resources or data provided in the Vapor Recovery Units Industry report?
While the report offers comprehensive insights, it's advisable to review the specific contents or supplementary materials provided to ascertain if additional resources or data are available.
14. How can I stay updated on further developments or reports in the Vapor Recovery Units Industry?
To stay informed about further developments, trends, and reports in the Vapor Recovery Units Industry, consider subscribing to industry newsletters, following relevant companies and organizations, or regularly checking reputable industry news sources and publications.
Methodology
Step 1 - Identification of Relevant Samples Size from Population Database


Step 2 - Approaches for Defining Global Market Size (Value, Volume* & Price*)

Note*: In applicable scenarios
Step 3 - Data Sources
Primary Research
- Web Analytics
- Survey Reports
- Research Institute
- Latest Research Reports
- Opinion Leaders
Secondary Research
- Annual Reports
- White Paper
- Latest Press Release
- Industry Association
- Paid Database
- Investor Presentations

Step 4 - Data Triangulation
Involves using different sources of information in order to increase the validity of a study
These sources are likely to be stakeholders in a program - participants, other researchers, program staff, other community members, and so on.
Then we put all data in single framework & apply various statistical tools to find out the dynamic on the market.
During the analysis stage, feedback from the stakeholder groups would be compared to determine areas of agreement as well as areas of divergence