

Key Insights
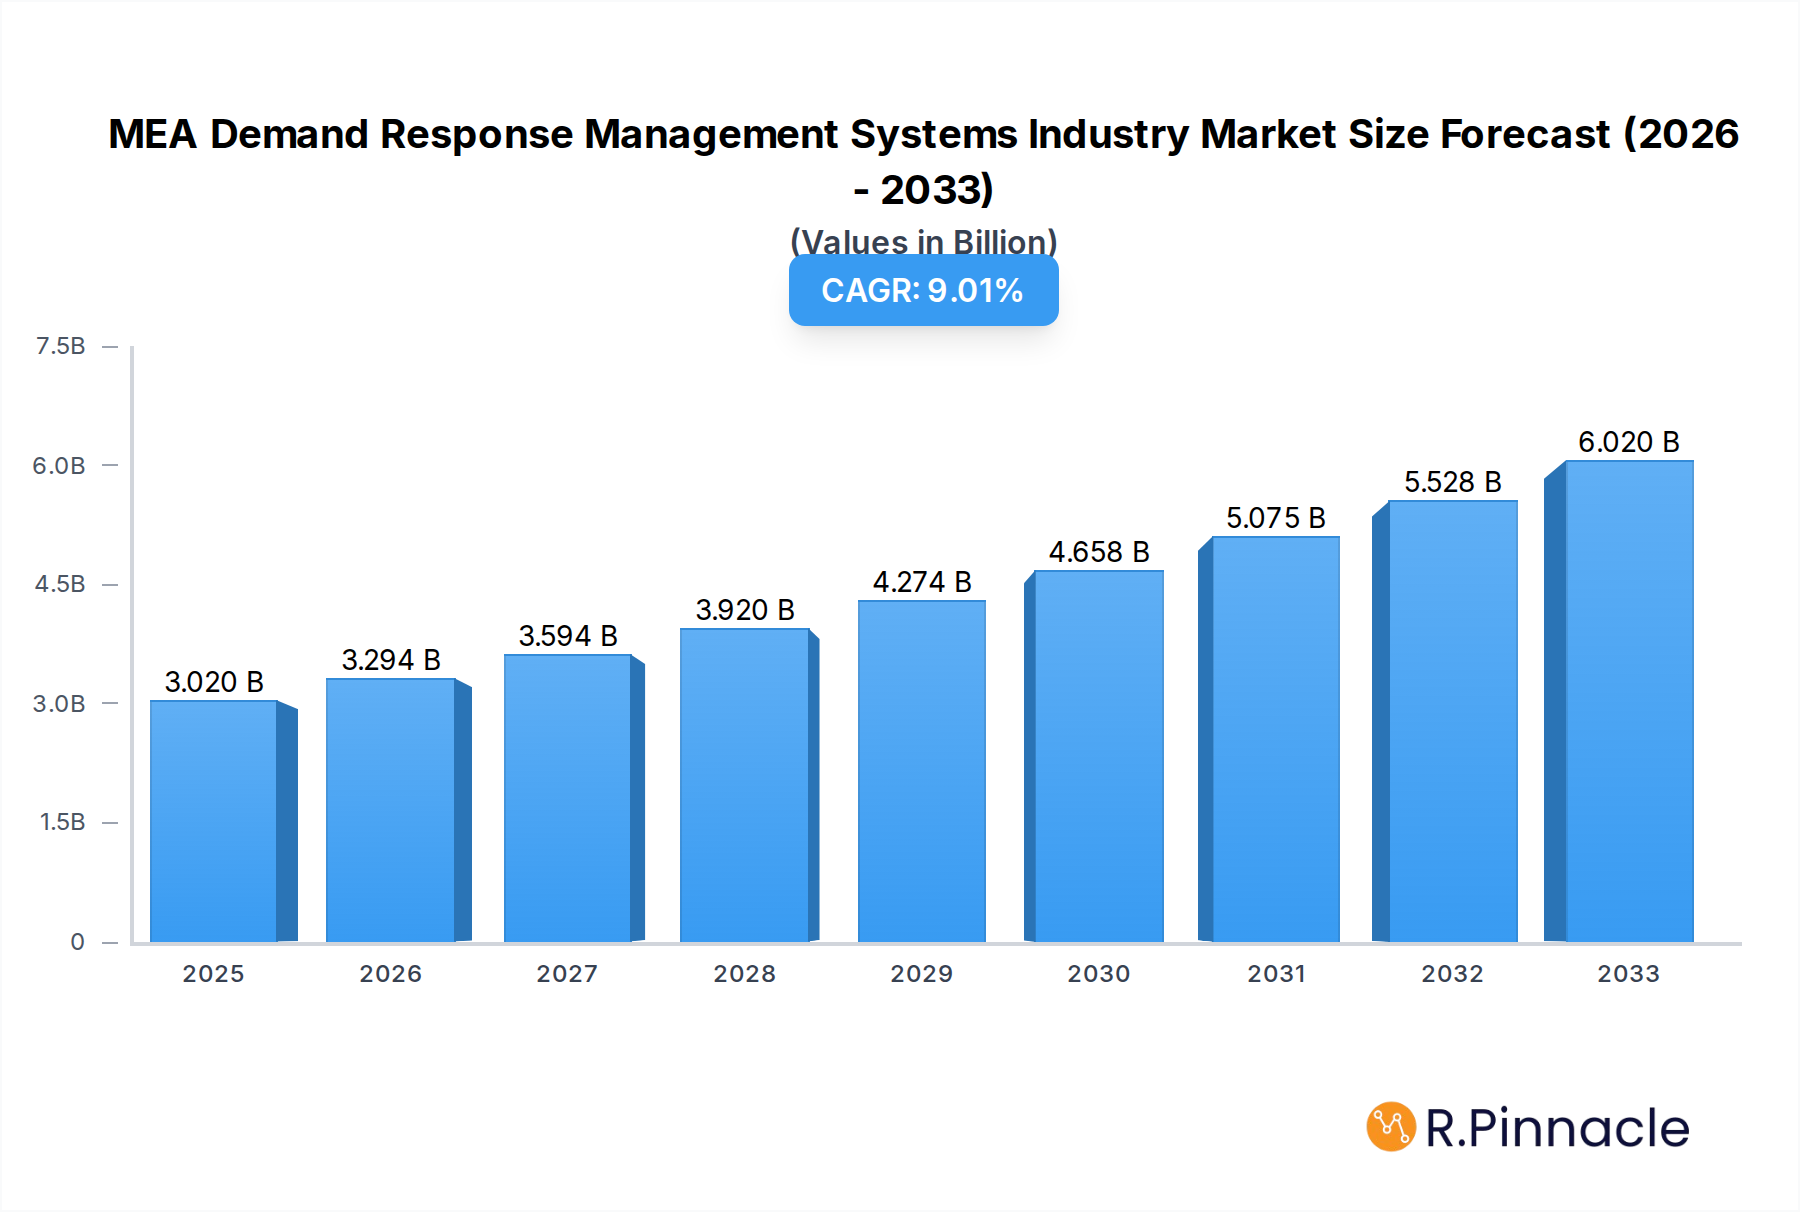
The Middle East and Africa (MEA) Demand Response Management Systems (DRMS) market is poised for significant expansion, projected to reach USD 3.02 billion in 2025. This robust growth is fueled by an impressive CAGR of 9.28%, indicating a dynamic and rapidly evolving sector. Key drivers include the increasing demand for grid stability and reliability, especially as renewable energy integration escalates across the region. Governments and utilities are actively promoting DRMS solutions to manage peak load, reduce energy costs, and enhance overall energy efficiency. The growing adoption of smart grid technologies and the rising awareness among consumers and businesses about the benefits of demand response are further propelling market growth. Furthermore, the increasing number of smart city initiatives across MEA countries, emphasizing sustainable energy management, will undoubtedly contribute to the surge in DRMS adoption.

MEA Demand Response Management Systems Industry Market Size (In Billion)
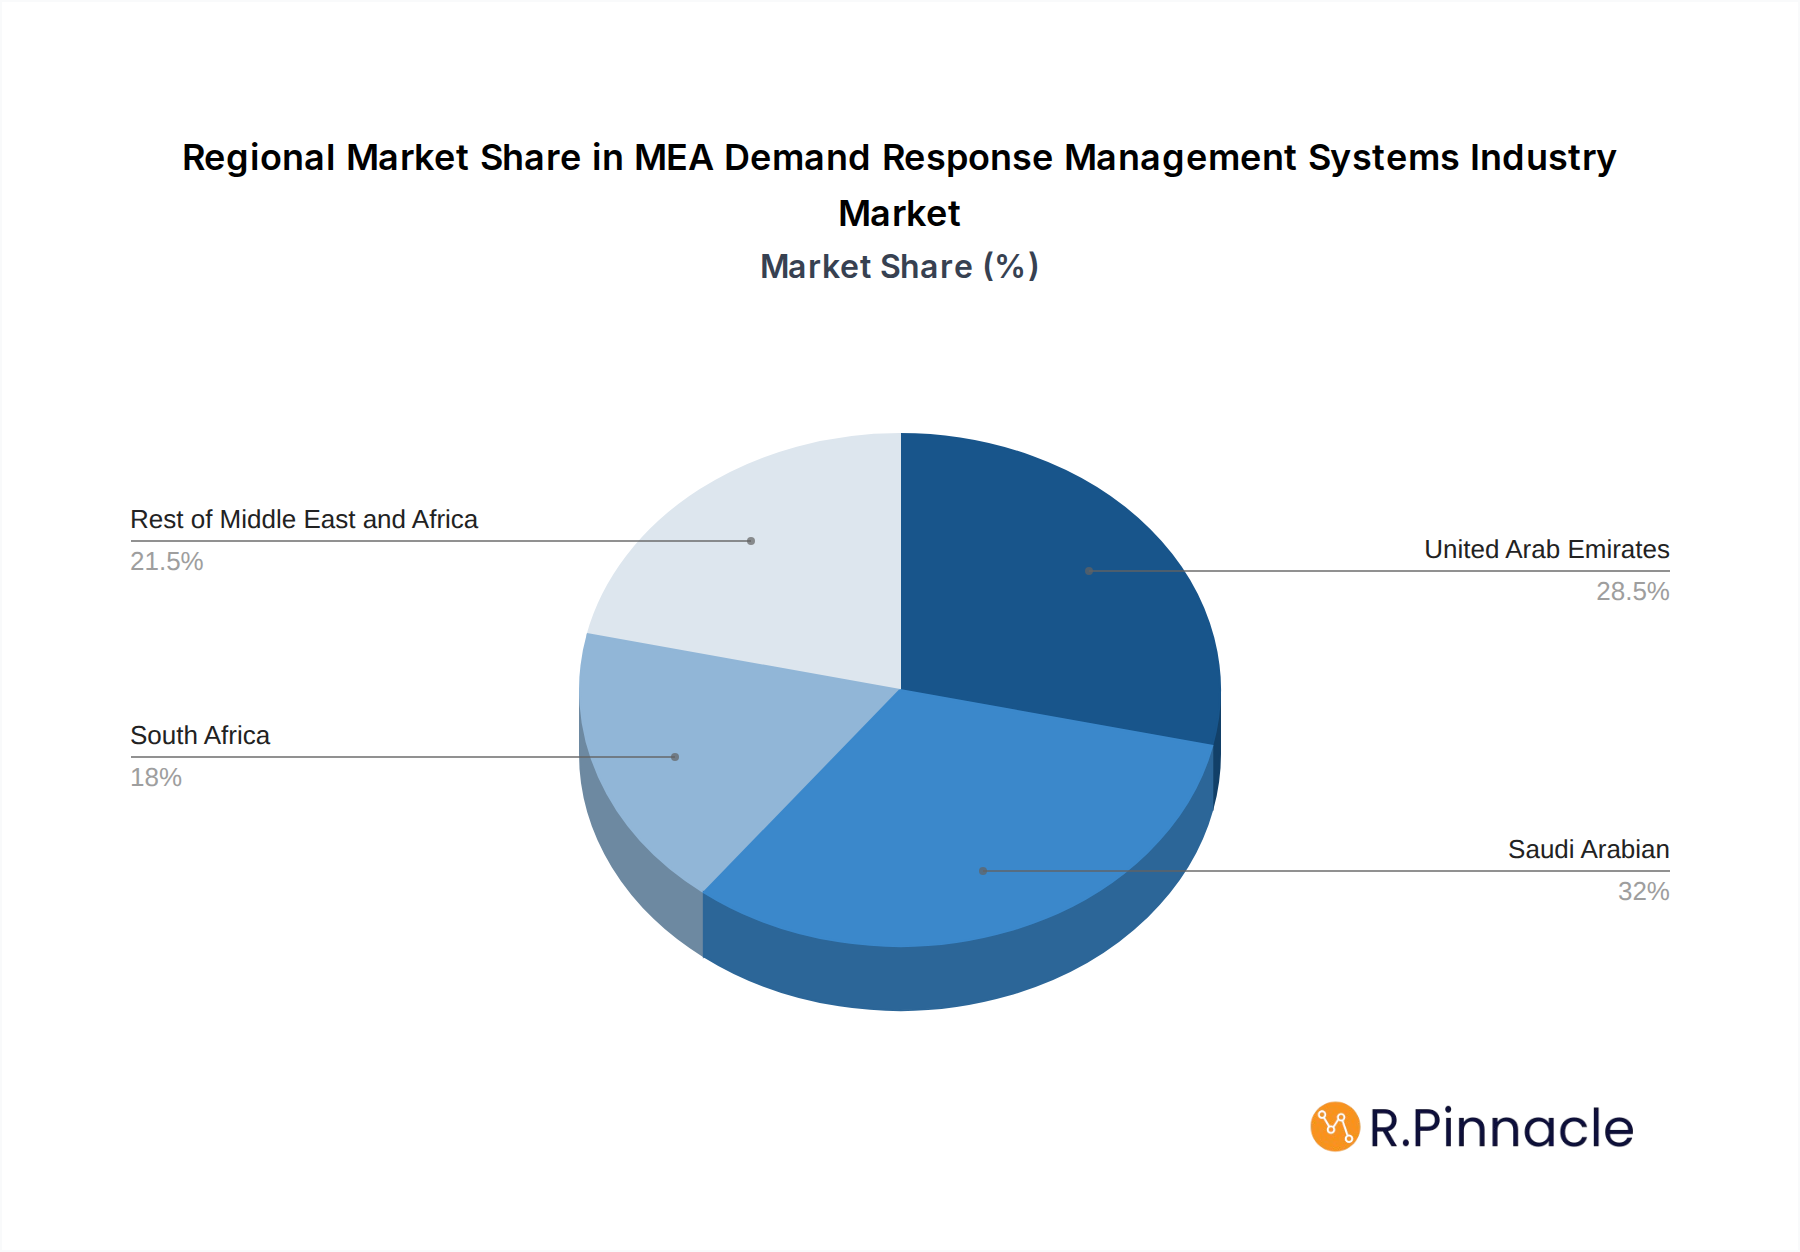
The market is segmented into Conventional Demand Response and Automated Demand Response, with the latter expected to gain significant traction due to its efficiency and real-time control capabilities. Geographically, the United Arab Emirates and Saudi Arabia are anticipated to lead the market, driven by substantial investments in energy infrastructure and a strong focus on energy security. South Africa and the rest of the Middle East and Africa region also present considerable growth opportunities, albeit with varying adoption rates influenced by regulatory frameworks and technological advancements. Major companies like Siemens AG, GE, and Schneider Electric are actively investing in R&D and strategic partnerships to capture market share. However, challenges such as the need for substantial initial investment, data security concerns, and varying levels of regulatory support in some sub-regions might moderate the growth trajectory.
MEA Demand Response Management Systems Industry Company Market Share
This comprehensive market research report delves deep into the Middle East and Africa (MEA) Demand Response Management Systems (DRMS) industry, providing invaluable insights for stakeholders seeking to navigate this rapidly evolving landscape. With a study period spanning from 2019 to 2033, a base year of 2025, and a forecast period from 2025 to 2033, this report offers a robust analysis of market trends, growth drivers, challenges, and future opportunities. We cover key segments including Conventional Demand Response and Automated Demand Response, across critical geographies such as the United Arab Emirates, Saudi Arabia, South Africa, and the Rest of Middle East and Africa. The projected market size is expected to reach billions of US dollars by 2033, driven by increasing grid modernization efforts, renewable energy integration, and the imperative for enhanced energy efficiency.
MEA Demand Response Management Systems Industry Market Structure & Innovation Trends
The MEA Demand Response Management Systems (DRMS) market exhibits a moderate to high concentration, with key players like ABB Ltd, Siemens AG, Schneider Electric, and General Electric Company holding significant market shares. Innovation in the DRMS sector is primarily driven by the escalating need for grid stability, the integration of distributed energy resources (DERs), and advancements in IoT and AI technologies for predictive analytics and automated load shedding. Regulatory frameworks are progressively maturing across the region, with governments increasingly incentivizing demand response programs to reduce peak demand and defer costly infrastructure upgrades. The United Arab Emirates and Saudi Arabia are at the forefront of regulatory development, fostering a conducive environment for DRMS adoption. Product substitutes, while present in traditional energy management solutions, are increasingly being outpaced by the sophisticated capabilities of modern DRMS platforms that offer real-time control and optimization. End-user demographics are diversifying, with a growing adoption among industrial, commercial, and increasingly, residential sectors seeking cost savings and greater energy autonomy. Merger and acquisition (M&A) activities are expected to see an uptick as larger players seek to consolidate their market presence and acquire specialized technological expertise. Estimated M&A deal values are projected to reach billions of US dollars over the forecast period.
MEA Demand Response Management Systems Industry Market Dynamics & Trends
The MEA Demand Response Management Systems (DRMS) market is poised for substantial growth, driven by a confluence of powerful factors. A primary growth driver is the ongoing grid modernization initiatives across the region, necessitated by rapidly increasing electricity demand fueled by population growth and economic development. Governments are investing heavily in upgrading aging grid infrastructure, and DRMS plays a crucial role in enhancing grid flexibility, reliability, and resilience, especially with the increasing penetration of intermittent renewable energy sources like solar and wind power. The push for energy efficiency and carbon emission reduction is another significant catalyst. Countries are setting ambitious sustainability targets, and DRMS provides a cost-effective solution for utilities and grid operators to manage demand during peak hours, thereby reducing reliance on expensive and often less environmentally friendly peaking power plants. Technological disruptions are continuously shaping the market, with the proliferation of smart meters, advanced sensors, and sophisticated communication networks enabling more granular and dynamic demand response capabilities. The adoption of Artificial Intelligence (AI) and Machine Learning (ML) algorithms is transforming DRMS by enabling predictive analytics for load forecasting, optimal dispatch of demand response resources, and personalized energy management strategies for consumers. Consumer preferences are also evolving; as awareness of energy costs and environmental impact grows, both commercial and residential customers are increasingly seeking solutions that offer greater control over their energy consumption and potential cost savings. This shift is fostering a more proactive engagement with demand response programs. Competitive dynamics within the MEA DRMS market are intensifying. Established utility companies are investing in DRMS solutions to optimize their operations and meet regulatory mandates. Technology providers are fiercely competing to offer innovative and integrated solutions, ranging from software platforms to hardware components. The market penetration of DRMS, while still nascent in some sub-regions, is projected to witness a Compound Annual Growth Rate (CAGR) of over xx% during the forecast period. This growth is further propelled by supportive government policies and incentives aimed at promoting DR adoption, such as preferential tariffs and regulatory mandates for grid flexibility. The increasing affordability and accessibility of DRMS technologies, coupled with the growing understanding of their economic and environmental benefits, are creating a fertile ground for market expansion.
Dominant Regions & Segments in MEA Demand Response Management Systems Industry
The United Arab Emirates (UAE) and Saudi Arabia are emerging as the dominant regions within the MEA Demand Response Management Systems (DRMS) industry, driven by proactive government initiatives and substantial investments in smart grid technologies.
United Arab Emirates:
- Key Drivers: The UAE's commitment to becoming a leader in renewable energy integration and its ambitious sustainability goals are significant drivers. Initiatives like the Dubai Clean Energy Strategy 2050 and the Abu Dhabi Vision 2030 mandate the adoption of smart grid technologies, including DRMS, to manage the increasing load from both conventional and renewable sources. The government's focus on reducing carbon emissions and enhancing energy security further bolsters DRMS deployment.
- Dominance Analysis: The UAE's progressive regulatory environment, with entities like the Dubai Electricity and Water Authority (DEWA) and the Abu Dhabi Department of Energy (DoE) actively promoting and implementing demand response programs, positions it as a frontrunner. Investments in smart meter rollouts and the development of comprehensive energy management frameworks provide a robust foundation for DRMS. The Automated Demand Response segment is particularly strong in the UAE due to its advanced technological infrastructure and the adoption of smart grid technologies.
Saudi Arabia:
- Key Drivers: Saudi Arabia's Vision 2030 economic diversification plan includes significant investments in infrastructure development and energy sector modernization. The Kingdom's large-scale renewable energy projects necessitate advanced grid management solutions like DRMS to ensure grid stability and optimize energy distribution. The ongoing efforts to improve energy efficiency and reduce reliance on fossil fuels also contribute to the growing demand for DRMS.
- Dominance Analysis: The Saudi Electricity Company (SEC) is a key player in driving the adoption of DRMS. The country's focus on large industrial consumers and smart city initiatives, such as NEOM, are creating substantial opportunities for DRMS implementation. The Conventional Demand Response segment, though evolving, still holds a significant share due to the presence of large industrial facilities that can participate in peak-shaving programs.
Rest of Middle-East and Africa:
- Key Drivers: While individual countries in this vast region may have varying levels of DRMS adoption, the overall trend is towards increased awareness and implementation. South Africa, with its ongoing challenges in electricity supply, is actively exploring DRMS to alleviate strain on its grid. Other nations are beginning to recognize the economic and environmental benefits of demand response as they invest in grid upgrades and renewable energy.
- Dominance Analysis: This segment represents a nascent but rapidly growing market. Factors like growing urbanization, increasing energy poverty in some areas, and the desire for greater energy independence are creating a long-term demand for smart grid solutions. The Automated Demand Response segment is expected to witness faster growth as connectivity and smart technology become more accessible.
Across these dominant regions, the Automated Demand Response segment is anticipated to experience the most dynamic growth, driven by technological advancements and the need for real-time grid control.
MEA Demand Response Management Systems Industry Product Innovations
Product innovations in the MEA Demand Response Management Systems (DRMS) industry are centered on enhancing grid intelligence and user control. Key developments include the integration of advanced AI and machine learning algorithms for more accurate load forecasting and predictive control, enabling utilities to optimize DR dispatch with greater precision. Furthermore, there's a growing trend towards interoperable and open-source DRMS platforms that facilitate seamless integration with existing grid infrastructure and diverse end-user devices. The development of user-friendly mobile applications and customer portals empowers end-users with real-time data and control over their energy consumption, fostering greater participation. Competitive advantages are being gained through solutions that offer robust cybersecurity features, ensuring the integrity of grid operations, and through the provision of comprehensive analytics and reporting capabilities that demonstrate the economic and environmental benefits of DR programs.
Report Scope & Segmentation Analysis
This report provides an in-depth analysis of the MEA Demand Response Management Systems (DRMS) market, segmented by Type and Geography.
Type Segmentation:
- Conventional Demand Response: This segment encompasses traditional DR programs, often managed manually or with less sophisticated automation, primarily focused on load shedding during peak demand periods. Growth projections indicate a steady but slower expansion compared to automated solutions.
- Automated Demand Response: This segment leverages advanced technologies like smart meters, IoT devices, and communication networks for real-time, automated control of energy consumption. It is projected to witness significant growth due to its superior efficiency and responsiveness, with estimated market sizes reaching billions of US dollars by 2033.
Geography Segmentation:
- United Arab Emirates: Expected to be a leading market with substantial growth driven by smart grid initiatives and renewable energy integration.
- Saudi Arabia: A key growth market, fueled by infrastructure development and energy efficiency mandates.
- South Africa: A significant market with growing demand for grid stability solutions.
- Rest of Middle-East and Africa: This diverse segment represents a nascent but rapidly expanding market with considerable future potential.
Key Drivers of MEA Demand Response Management Systems Industry Growth
The growth of the MEA Demand Response Management Systems (DRMS) industry is propelled by several pivotal factors. Technologically, the widespread deployment of smart meters and the advancements in IoT and AI are enabling more sophisticated and efficient DR capabilities. Economically, the rising costs of energy infrastructure upgrades and the imperative to reduce operational expenses for utilities and consumers alike are making DRMS an attractive investment. Regulatory support is crucial, with governments increasingly implementing policies and incentives that encourage DR adoption to enhance grid reliability and meet sustainability targets. For instance, the UAE's initiatives to promote energy efficiency and the integration of renewables directly stimulate DRMS deployment.
Challenges in the MEA Demand Response Management Systems Industry Sector
Despite its promising growth, the MEA Demand Response Management Systems (DRMS) industry faces several hurdles. Regulatory fragmentation across different countries can impede widespread adoption and create complexities for market players. The initial investment costs for implementing advanced DRMS infrastructure can be a barrier, particularly for smaller utilities or in less developed economies. Supply chain issues related to the availability of specialized hardware and skilled personnel to manage and maintain these systems can also pose challenges. Furthermore, cybersecurity concerns related to grid-connected systems require robust solutions and continuous vigilance. Competitive pressures from established energy management solutions and the need for greater consumer education on the benefits of DR also contribute to the industry's challenges.
Emerging Opportunities in MEA Demand Response Management Systems Industry
Emerging opportunities within the MEA Demand Response Management Systems (DRMS) industry are abundant. The increasing integration of renewable energy sources presents a significant opportunity for DRMS to balance grid fluctuations and enhance stability. The growing trend towards electric vehicle (EV) charging infrastructure offers a new avenue for DR programs to manage charging loads and leverage vehicle-to-grid (V2G) capabilities. The development of smart cities across the region creates a fertile ground for integrated DRMS solutions that optimize urban energy consumption. Furthermore, the expansion of DR programs into the residential sector, driven by smart home technology adoption and consumer demand for cost savings, represents a significant untapped market potential.
Leading Players in the MEA Demand Response Management Systems Industry Market
- ABB Ltd
- Saudi Electricity Company
- Enel SpA
- Mitsubishi Electric Corporation
- Siemens AG
- Alstom SA
- Eaton Corporation PLC
- Schneider Electric
- General Electric Company
Key Developments in MEA Demand Response Management Systems Industry Industry
- Nov 2022: The Abu Dhabi Department of Economic Development (ADDED) expanded the Energy Tariff Incentive Programme (ETIP 2.0) by offering preferential rates for gas and electricity to the industrial sector based on eligibility criteria that include economic impact, Emiratisation rate, and energy management efficiency. This incentivizes energy-efficient practices and implicitly supports demand-side management.
- Apr 2022: The Ministry of Energy and Infrastructure launched a database to monitor energy and water consumption in the UAE government buildings. The database is part of the initiatives of the National Water and Energy Demand Management Programme (NWEDMP). It will help gauge energy and water consumption in government buildings and identify buildings with the highest consumption rates to develop rationalization programs that help minimize carbon emissions and operating costs. This initiative directly contributes to the data collection and analysis essential for effective demand response.
Future Outlook for MEA Demand Response Management Systems Industry Market
The future outlook for the MEA Demand Response Management Systems (DRMS) industry is exceptionally bright, with projections indicating robust and sustained growth. The increasing imperative for grid resilience in the face of climate change and growing energy demand will continue to drive DRMS adoption. As more countries in the region commit to ambitious renewable energy targets, DRMS will become indispensable for managing the intermittency of these sources. The ongoing digital transformation of the energy sector, coupled with advancements in AI and IoT, will unlock new levels of efficiency and automation in demand response. Strategic opportunities lie in developing integrated solutions that encompass grid modernization, renewable energy management, and smart consumer engagement. The market is expected to expand significantly, reaching projected values in the billions of US dollars, as nations prioritize energy security, sustainability, and economic efficiency.
MEA Demand Response Management Systems Industry Segmentation
-
1. Type
- 1.1. Conventional Demand Response
- 1.2. Automated Demand Response
-
2. Geography
- 2.1. United Arab Emirates
- 2.2. Saudi Arabian
- 2.3. South Africa
- 2.4. Res of Middle-East and Africa
MEA Demand Response Management Systems Industry Segmentation By Geography
- 1. United Arab Emirates
- 2. Saudi Arabian
- 3. South Africa
- 4. Res of Middle East and Africa
MEA Demand Response Management Systems Industry Regional Market Share
Geographic Coverage of MEA Demand Response Management Systems Industry
MEA Demand Response Management Systems Industry REPORT HIGHLIGHTS
| Aspects | Details |
|---|---|
| Study Period | 2020-2034 |
| Base Year | 2025 |
| Estimated Year | 2026 |
| Forecast Period | 2026-2034 |
| Historical Period | 2020-2025 |
| Growth Rate | CAGR of 9.28% from 2020-2034 |
| Segmentation |
|
Table of Contents
- 1. Introduction
- 1.1. Research Scope
- 1.2. Market Segmentation
- 1.3. Research Objective
- 1.4. Definitions and Assumptions
- 2. Executive Summary
- 2.1. Market Snapshot
- 3. Market Dynamics
- 3.1. Market Drivers
- 3.2. Market Restrains
- 3.3. Market Trends
- 3.4. Market Opportunities
- 4. Market Factor Analysis
- 4.1. Porters Five Forces
- 4.1.1. Bargaining Power of Suppliers
- 4.1.2. Bargaining Power of Buyers
- 4.1.3. Threat of New Entrants
- 4.1.4. Threat of Substitutes
- 4.1.5. Competitive Rivalry
- 4.2. PESTEL analysis
- 4.3. BCG Analysis
- 4.3.1. Stars (High Growth, High Market Share)
- 4.3.2. Cash Cows (Low Growth, High Market Share)
- 4.3.3. Question Mark (High Growth, Low Market Share)
- 4.3.4. Dogs (Low Growth, Low Market Share)
- 4.4. Ansoff Matrix Analysis
- 4.5. Supply Chain Analysis
- 4.6. Regulatory Landscape
- 4.7. Current Market Potential and Opportunity Assessment (TAM–SAM–SOM Framework)
- 4.8. PRI Analyst Note
- 4.1. Porters Five Forces
- 5. Market Analysis, Insights and Forecast 2021-2033
- 5.1. Market Analysis, Insights and Forecast - by Type
- 5.1.1. Conventional Demand Response
- 5.1.2. Automated Demand Response
- 5.2. Market Analysis, Insights and Forecast - by Geography
- 5.2.1. United Arab Emirates
- 5.2.2. Saudi Arabian
- 5.2.3. South Africa
- 5.2.4. Res of Middle-East and Africa
- 5.3. Market Analysis, Insights and Forecast - by Region
- 5.3.1. United Arab Emirates
- 5.3.2. Saudi Arabian
- 5.3.3. South Africa
- 5.3.4. Res of Middle East and Africa
- 5.1. Market Analysis, Insights and Forecast - by Type
- 6. Global MEA Demand Response Management Systems Industry Analysis, Insights and Forecast, 2021-2033
- 6.1. Market Analysis, Insights and Forecast - by Type
- 6.1.1. Conventional Demand Response
- 6.1.2. Automated Demand Response
- 6.2. Market Analysis, Insights and Forecast - by Geography
- 6.2.1. United Arab Emirates
- 6.2.2. Saudi Arabian
- 6.2.3. South Africa
- 6.2.4. Res of Middle-East and Africa
- 6.1. Market Analysis, Insights and Forecast - by Type
- 7. United Arab Emirates MEA Demand Response Management Systems Industry Analysis, Insights and Forecast, 2020-2032
- 7.1. Market Analysis, Insights and Forecast - by Type
- 7.1.1. Conventional Demand Response
- 7.1.2. Automated Demand Response
- 7.2. Market Analysis, Insights and Forecast - by Geography
- 7.2.1. United Arab Emirates
- 7.2.2. Saudi Arabian
- 7.2.3. South Africa
- 7.2.4. Res of Middle-East and Africa
- 7.1. Market Analysis, Insights and Forecast - by Type
- 8. Saudi Arabian MEA Demand Response Management Systems Industry Analysis, Insights and Forecast, 2020-2032
- 8.1. Market Analysis, Insights and Forecast - by Type
- 8.1.1. Conventional Demand Response
- 8.1.2. Automated Demand Response
- 8.2. Market Analysis, Insights and Forecast - by Geography
- 8.2.1. United Arab Emirates
- 8.2.2. Saudi Arabian
- 8.2.3. South Africa
- 8.2.4. Res of Middle-East and Africa
- 8.1. Market Analysis, Insights and Forecast - by Type
- 9. South Africa MEA Demand Response Management Systems Industry Analysis, Insights and Forecast, 2020-2032
- 9.1. Market Analysis, Insights and Forecast - by Type
- 9.1.1. Conventional Demand Response
- 9.1.2. Automated Demand Response
- 9.2. Market Analysis, Insights and Forecast - by Geography
- 9.2.1. United Arab Emirates
- 9.2.2. Saudi Arabian
- 9.2.3. South Africa
- 9.2.4. Res of Middle-East and Africa
- 9.1. Market Analysis, Insights and Forecast - by Type
- 10. Res of Middle East and Africa MEA Demand Response Management Systems Industry Analysis, Insights and Forecast, 2020-2032
- 10.1. Market Analysis, Insights and Forecast - by Type
- 10.1.1. Conventional Demand Response
- 10.1.2. Automated Demand Response
- 10.2. Market Analysis, Insights and Forecast - by Geography
- 10.2.1. United Arab Emirates
- 10.2.2. Saudi Arabian
- 10.2.3. South Africa
- 10.2.4. Res of Middle-East and Africa
- 10.1. Market Analysis, Insights and Forecast - by Type
- 11. Competitive Analysis
- 11.1. Company Profiles
- 11.1.1 ABB Ltd
- 11.1.1.1. Company Overview
- 11.1.1.2. Products
- 11.1.1.3. Company Financials
- 11.1.1.4. SWOT Analysis
- 11.1.2 Saudi Electricity Company
- 11.1.2.1. Company Overview
- 11.1.2.2. Products
- 11.1.2.3. Company Financials
- 11.1.2.4. SWOT Analysis
- 11.1.3 Enel SpA
- 11.1.3.1. Company Overview
- 11.1.3.2. Products
- 11.1.3.3. Company Financials
- 11.1.3.4. SWOT Analysis
- 11.1.4 Mitsubishi Electric Corporation
- 11.1.4.1. Company Overview
- 11.1.4.2. Products
- 11.1.4.3. Company Financials
- 11.1.4.4. SWOT Analysis
- 11.1.5 Siemens AG
- 11.1.5.1. Company Overview
- 11.1.5.2. Products
- 11.1.5.3. Company Financials
- 11.1.5.4. SWOT Analysis
- 11.1.6 Alstom SA
- 11.1.6.1. Company Overview
- 11.1.6.2. Products
- 11.1.6.3. Company Financials
- 11.1.6.4. SWOT Analysis
- 11.1.7 Eaton Corporation PLC
- 11.1.7.1. Company Overview
- 11.1.7.2. Products
- 11.1.7.3. Company Financials
- 11.1.7.4. SWOT Analysis
- 11.1.8 Schneider Electric
- 11.1.8.1. Company Overview
- 11.1.8.2. Products
- 11.1.8.3. Company Financials
- 11.1.8.4. SWOT Analysis
- 11.1.9 General Electric Company
- 11.1.9.1. Company Overview
- 11.1.9.2. Products
- 11.1.9.3. Company Financials
- 11.1.9.4. SWOT Analysis
- 11.1.1 ABB Ltd
- 11.2. Market Entropy
- 11.2.1 Company's Key Areas Served
- 11.2.2 Recent Developments
- 11.3. Company Market Share Analysis 2025
- 11.3.1 Top 5 Companies Market Share Analysis
- 11.3.2 Top 3 Companies Market Share Analysis
- 11.4. List of Potential Customers
- 12. Research Methodology
List of Figures
- Figure 1: Global MEA Demand Response Management Systems Industry Revenue Breakdown (undefined, %) by Region 2025 & 2033
- Figure 2: United Arab Emirates MEA Demand Response Management Systems Industry Revenue (undefined), by Type 2025 & 2033
- Figure 3: United Arab Emirates MEA Demand Response Management Systems Industry Revenue Share (%), by Type 2025 & 2033
- Figure 4: United Arab Emirates MEA Demand Response Management Systems Industry Revenue (undefined), by Geography 2025 & 2033
- Figure 5: United Arab Emirates MEA Demand Response Management Systems Industry Revenue Share (%), by Geography 2025 & 2033
- Figure 6: United Arab Emirates MEA Demand Response Management Systems Industry Revenue (undefined), by Country 2025 & 2033
- Figure 7: United Arab Emirates MEA Demand Response Management Systems Industry Revenue Share (%), by Country 2025 & 2033
- Figure 8: Saudi Arabian MEA Demand Response Management Systems Industry Revenue (undefined), by Type 2025 & 2033
- Figure 9: Saudi Arabian MEA Demand Response Management Systems Industry Revenue Share (%), by Type 2025 & 2033
- Figure 10: Saudi Arabian MEA Demand Response Management Systems Industry Revenue (undefined), by Geography 2025 & 2033
- Figure 11: Saudi Arabian MEA Demand Response Management Systems Industry Revenue Share (%), by Geography 2025 & 2033
- Figure 12: Saudi Arabian MEA Demand Response Management Systems Industry Revenue (undefined), by Country 2025 & 2033
- Figure 13: Saudi Arabian MEA Demand Response Management Systems Industry Revenue Share (%), by Country 2025 & 2033
- Figure 14: South Africa MEA Demand Response Management Systems Industry Revenue (undefined), by Type 2025 & 2033
- Figure 15: South Africa MEA Demand Response Management Systems Industry Revenue Share (%), by Type 2025 & 2033
- Figure 16: South Africa MEA Demand Response Management Systems Industry Revenue (undefined), by Geography 2025 & 2033
- Figure 17: South Africa MEA Demand Response Management Systems Industry Revenue Share (%), by Geography 2025 & 2033
- Figure 18: South Africa MEA Demand Response Management Systems Industry Revenue (undefined), by Country 2025 & 2033
- Figure 19: South Africa MEA Demand Response Management Systems Industry Revenue Share (%), by Country 2025 & 2033
- Figure 20: Res of Middle East and Africa MEA Demand Response Management Systems Industry Revenue (undefined), by Type 2025 & 2033
- Figure 21: Res of Middle East and Africa MEA Demand Response Management Systems Industry Revenue Share (%), by Type 2025 & 2033
- Figure 22: Res of Middle East and Africa MEA Demand Response Management Systems Industry Revenue (undefined), by Geography 2025 & 2033
- Figure 23: Res of Middle East and Africa MEA Demand Response Management Systems Industry Revenue Share (%), by Geography 2025 & 2033
- Figure 24: Res of Middle East and Africa MEA Demand Response Management Systems Industry Revenue (undefined), by Country 2025 & 2033
- Figure 25: Res of Middle East and Africa MEA Demand Response Management Systems Industry Revenue Share (%), by Country 2025 & 2033
List of Tables
- Table 1: Global MEA Demand Response Management Systems Industry Revenue undefined Forecast, by Type 2020 & 2033
- Table 2: Global MEA Demand Response Management Systems Industry Revenue undefined Forecast, by Geography 2020 & 2033
- Table 3: Global MEA Demand Response Management Systems Industry Revenue undefined Forecast, by Region 2020 & 2033
- Table 4: Global MEA Demand Response Management Systems Industry Revenue undefined Forecast, by Type 2020 & 2033
- Table 5: Global MEA Demand Response Management Systems Industry Revenue undefined Forecast, by Geography 2020 & 2033
- Table 6: Global MEA Demand Response Management Systems Industry Revenue undefined Forecast, by Country 2020 & 2033
- Table 7: Global MEA Demand Response Management Systems Industry Revenue undefined Forecast, by Type 2020 & 2033
- Table 8: Global MEA Demand Response Management Systems Industry Revenue undefined Forecast, by Geography 2020 & 2033
- Table 9: Global MEA Demand Response Management Systems Industry Revenue undefined Forecast, by Country 2020 & 2033
- Table 10: Global MEA Demand Response Management Systems Industry Revenue undefined Forecast, by Type 2020 & 2033
- Table 11: Global MEA Demand Response Management Systems Industry Revenue undefined Forecast, by Geography 2020 & 2033
- Table 12: Global MEA Demand Response Management Systems Industry Revenue undefined Forecast, by Country 2020 & 2033
- Table 13: Global MEA Demand Response Management Systems Industry Revenue undefined Forecast, by Type 2020 & 2033
- Table 14: Global MEA Demand Response Management Systems Industry Revenue undefined Forecast, by Geography 2020 & 2033
- Table 15: Global MEA Demand Response Management Systems Industry Revenue undefined Forecast, by Country 2020 & 2033
Frequently Asked Questions
1. What is the projected Compound Annual Growth Rate (CAGR) of the MEA Demand Response Management Systems Industry?
The projected CAGR is approximately 9.28%.
2. Which companies are prominent players in the MEA Demand Response Management Systems Industry?
Key companies in the market include ABB Ltd, Saudi Electricity Company, Enel SpA, Mitsubishi Electric Corporation, Siemens AG, Alstom SA, Eaton Corporation PLC, Schneider Electric, General Electric Company.
3. What are the main segments of the MEA Demand Response Management Systems Industry?
The market segments include Type, Geography.
4. Can you provide details about the market size?
The market size is estimated to be USD XXX N/A as of 2022.
5. What are some drivers contributing to market growth?
4.; Need for Efficient Energy Management Systems4.; Growing Penetration of Renewable Energy Sources.
6. What are the notable trends driving market growth?
Automated Demand Response System to Grow at the Fastest Rate.
7. Are there any restraints impacting market growth?
4.; Privacy Concerns on the Industrial Demand Response Management Systems.
8. Can you provide examples of recent developments in the market?
Nov 2022: The Abu Dhabi Department of Economic Development (ADDED) expanded the Energy Tariff Incentive Programme (ETIP 2.0) by offering preferential rates for gas and electricity to the industrial sector based on eligibility criteria that include economic impact, Emiratisation rate, and energy management efficiency.
9. What pricing options are available for accessing the report?
Pricing options include single-user, multi-user, and enterprise licenses priced at USD 4750, USD 5250, and USD 8750 respectively.
10. Is the market size provided in terms of value or volume?
The market size is provided in terms of value, measured in N/A.
11. Are there any specific market keywords associated with the report?
Yes, the market keyword associated with the report is "MEA Demand Response Management Systems Industry," which aids in identifying and referencing the specific market segment covered.
12. How do I determine which pricing option suits my needs best?
The pricing options vary based on user requirements and access needs. Individual users may opt for single-user licenses, while businesses requiring broader access may choose multi-user or enterprise licenses for cost-effective access to the report.
13. Are there any additional resources or data provided in the MEA Demand Response Management Systems Industry report?
While the report offers comprehensive insights, it's advisable to review the specific contents or supplementary materials provided to ascertain if additional resources or data are available.
14. How can I stay updated on further developments or reports in the MEA Demand Response Management Systems Industry?
To stay informed about further developments, trends, and reports in the MEA Demand Response Management Systems Industry, consider subscribing to industry newsletters, following relevant companies and organizations, or regularly checking reputable industry news sources and publications.
Methodology
Step 1 - Identification of Relevant Samples Size from Population Database


Step 2 - Approaches for Defining Global Market Size (Value, Volume* & Price*)

Note*: In applicable scenarios
Step 3 - Data Sources
Primary Research
- Web Analytics
- Survey Reports
- Research Institute
- Latest Research Reports
- Opinion Leaders
Secondary Research
- Annual Reports
- White Paper
- Latest Press Release
- Industry Association
- Paid Database
- Investor Presentations

Step 4 - Data Triangulation
Involves using different sources of information in order to increase the validity of a study
These sources are likely to be stakeholders in a program - participants, other researchers, program staff, other community members, and so on.
Then we put all data in single framework & apply various statistical tools to find out the dynamic on the market.
During the analysis stage, feedback from the stakeholder groups would be compared to determine areas of agreement as well as areas of divergence