
Key Insights
The Asia-Pacific (APAC) plastic caps and closures market is experiencing robust growth, driven by the region's burgeoning food and beverage, pharmaceutical, and personal care industries. A 4.90% CAGR indicates a significant expansion, projected to reach a substantial market value by 2033. The market's dynamism is fueled by several key factors. Rising disposable incomes and changing consumer lifestyles are boosting demand for packaged goods, creating a strong pull for plastic caps and closures across diverse sectors. Furthermore, the increasing adoption of convenient packaging formats, especially in the beverage and food industries, directly translates to higher demand for these essential components. While environmental concerns related to plastic waste represent a potential restraint, the market is witnessing a gradual shift towards sustainable materials and recycling initiatives, mitigating this challenge to some extent. The segment breakdown reveals that PET, PP, LDPE, and HDPE materials dominate, reflecting their suitability for various applications and cost-effectiveness. Within APAC, China and India are key growth drivers, given their large populations and expanding manufacturing sectors. However, other countries like Japan and South Korea also contribute significantly to the overall market value. The competitive landscape includes both global giants like Amcor and Berry Global, and regional players, showcasing a mix of established brands and emerging companies. This dynamic interplay of factors signifies significant opportunities for players within the APAC plastic caps and closures market.
This growth is projected to continue, although at a potentially moderating pace as market saturation in certain segments occurs. The ongoing focus on sustainability will increasingly influence material choices and packaging designs. Companies are likely to prioritize investments in research and development to create eco-friendly alternatives, including bio-based plastics and improved recycling technologies. This innovation will be crucial for long-term growth and addressing environmental concerns. Geographical expansion within APAC, particularly focusing on emerging markets with rapidly developing economies, will also remain a key strategy for market participants. The strategic partnerships and mergers and acquisitions are expected to shape the competitive landscape. Ultimately, the future of the APAC plastic caps and closures market hinges on adapting to evolving consumer preferences, environmental regulations, and technological advancements.
APAC Plastic Caps & Closure Industry Report: 2019-2033
This comprehensive report provides a detailed analysis of the Asia-Pacific (APAC) plastic caps and closure industry, offering invaluable insights for industry professionals, investors, and strategic planners. Covering the period from 2019 to 2033, with a base year of 2025, this report forecasts robust growth and examines the key factors shaping the market's future. The study delves into market segmentation, competitive dynamics, and emerging trends, equipping you with the knowledge to make informed decisions in this dynamic sector. The report includes extensive data on market size, CAGR, and market share, across diverse segments and countries.
APAC Plastic Caps & Closure Industry Market Structure & Innovation Trends
This section analyzes the competitive landscape of the APAC plastic caps and closures market, examining market concentration, innovation drivers, regulatory frameworks, and the impact of mergers and acquisitions (M&A) activity. The report utilizes data from the historical period (2019-2024) and estimated year (2025) to build a robust forecast for 2025-2033.
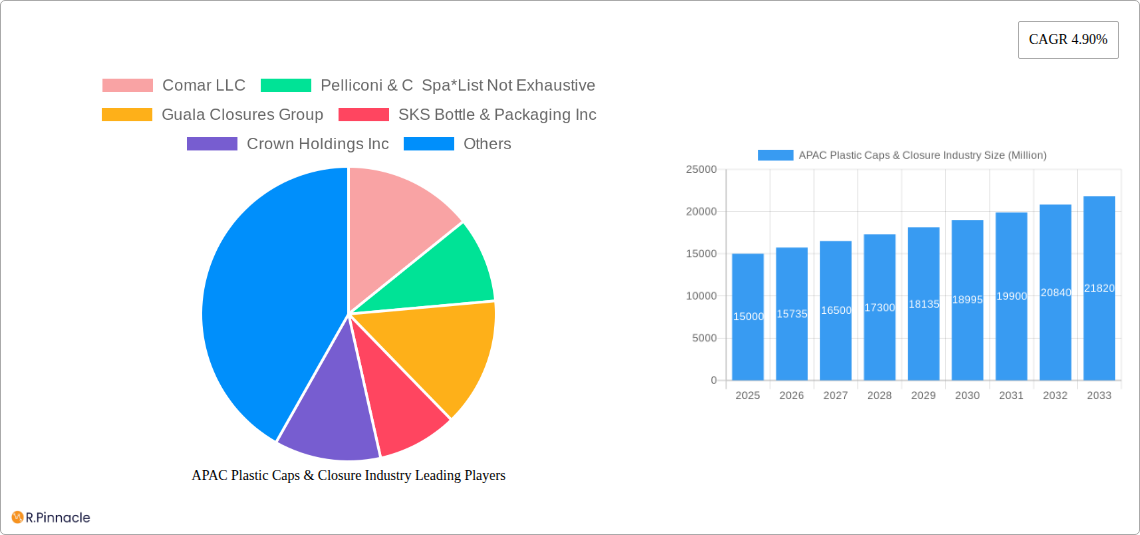
- Market Concentration: The APAC plastic caps and closures market exhibits a moderately concentrated structure, with several major players holding significant market share. While precise figures are proprietary to the full report, we can say that the top 5 players likely account for approximately xx% of the total market value.
- Innovation Drivers: Sustainability concerns are a major driver of innovation, pushing companies toward eco-friendly materials like recycled PET and biodegradable polymers. Furthermore, demand for tamper-evident closures, convenient dispensing mechanisms, and improved barrier properties are driving product development.
- Regulatory Frameworks: Stringent environmental regulations in various APAC countries are influencing the adoption of sustainable packaging solutions. Furthermore, food safety regulations are also impacting material selection and manufacturing processes.
- Product Substitutes: While plastic remains dominant, the industry is witnessing the emergence of alternative materials like paper, metal, and bio-based plastics, posing a potential threat to market growth. However, these substitutes currently hold a small market share.
- End-user Demographics: The growing population, increasing disposable incomes, and changing consumer preferences in APAC are driving demand for diverse packaging solutions across various end-user industries.
- M&A Activities: The industry has witnessed notable M&A activities, including the June 2020 acquisition of Albea Group's dispensing business by Silgan Holdings Inc. for $900 million. This consolidation highlights the strategic importance of the market and the ongoing competition among key players. This deal, and others, are analyzed in detail within the complete report.
APAC Plastic Caps & Closure Industry Market Dynamics & Trends
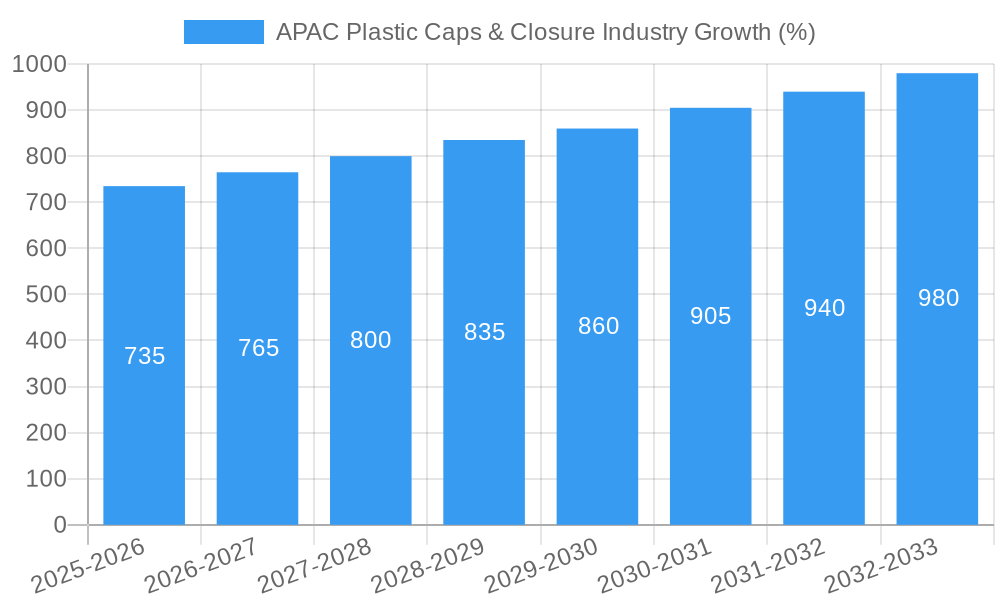
This section provides a detailed examination of the factors influencing the growth of the APAC plastic caps and closure market. The analysis incorporates growth drivers, technological advancements, evolving consumer preferences, and competitive dynamics. We present key market metrics like the Compound Annual Growth Rate (CAGR) and market penetration rates. The market is expected to experience significant growth during the forecast period (2025-2033), driven by factors such as increasing demand from the food and beverage, pharmaceutical, and cosmetic industries, coupled with the rising adoption of convenient packaging solutions. Technological advancements in material science and closure design are also driving market expansion, and consumer preference for sustainable and tamper-evident packaging is influencing the market trajectory. The competitive landscape is characterized by both fierce competition among established players and the emergence of new entrants, creating a dynamic market environment. Further details on CAGR and market penetration by specific segment are available in the full report.
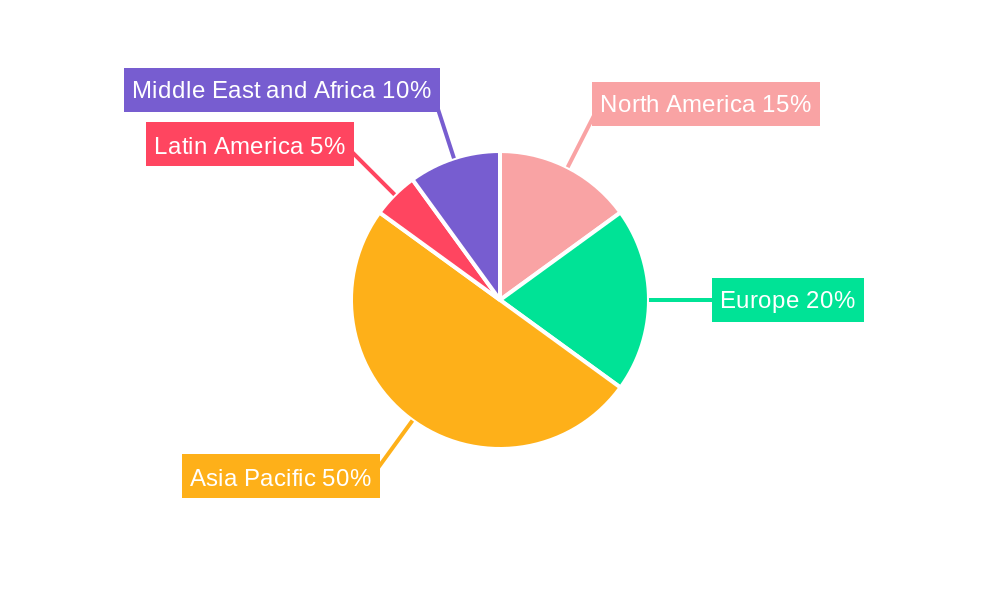
Dominant Regions & Segments in APAC Plastic Caps & Closure Industry
This section identifies the leading regions, countries, and segments within the APAC plastic caps and closures market. We analyze the market dominance of key players based on regional presence, manufacturing capabilities, and market penetration within each segment. The analysis encompasses different materials (PET, PP, LDPE, HDPE, Other Materials) and end-user industries (Beverage, Food, Pharmaceutical and Healthcare, Cosmetics and Toiletries, Household Chemicals, Other End-user Industries).
Leading Regions: China and India are expected to dominate the market due to their large populations, rapid economic growth, and expanding manufacturing sectors. Japan also holds a significant position owing to its advanced technology and well-established packaging industry.
Key Drivers by Country:
- China: Strong economic growth, substantial manufacturing base, and increasing demand for consumer goods.
- India: Rapidly growing population, rising disposable incomes, and expanding middle class.
- Japan: Technological advancements, stringent quality standards, and focus on innovation in packaging materials and designs.
- Rest of APAC: Diverse growth patterns depending on the specific country and its economic conditions.
Dominant Segments: The beverage segment (particularly bottled water and RTD drinks) is anticipated to drive significant demand, followed by the food and pharmaceutical/healthcare sectors. The detailed breakdown of market share by segment and country is included within the comprehensive report.
APAC Plastic Caps & Closure Industry Product Innovations
The APAC plastic caps and closures market is characterized by continuous product innovation, driven by the need for enhanced functionality, sustainability, and improved consumer experience. Recent advancements include the development of lightweight closures, improved dispensing mechanisms, and closures incorporating recycled content. These innovations are helping manufacturers meet the growing demands for eco-friendly and convenient packaging solutions, while also enhancing the overall product appeal for consumers. The market is witnessing a growing adoption of smart closures, incorporating features such as RFID technology and tamper-evident seals, thus enhancing supply chain traceability and consumer safety.
Report Scope & Segmentation Analysis
This report provides a comprehensive analysis of the APAC plastic caps and closures market, segmented by material (PET, PP, LDPE, HDPE, Other Materials), end-user industry (Beverage, Food, Pharmaceutical and Healthcare, Cosmetics and Toiletries, Household Chemicals, Other End-user Industries), and country (China, India, Japan, Rest of Asia-Pacific). The report offers detailed market size estimations, growth projections, and competitive landscape analysis for each segment. Market sizes are provided in Millions of dollars for each segment and region, outlining the significant growth opportunities present in this dynamic sector.
Key Drivers of APAC Plastic Caps & Closure Industry Growth
Several factors are fueling the growth of the APAC plastic caps and closures market. Firstly, the burgeoning food and beverage industry, with its increasing demand for packaged products, is a significant driver. Secondly, rapid economic expansion across the region is leading to increased consumer spending on packaged goods. Thirdly, advancements in materials science and packaging technology are providing innovative solutions to meet evolving consumer preferences. Finally, favorable government regulations and investment in infrastructure are also contributing to market growth.
Challenges in the APAC Plastic Caps & Closure Industry Sector
The APAC plastic caps and closures market faces several challenges. Fluctuations in raw material prices and supply chain disruptions due to geopolitical events can impact profitability. Furthermore, growing environmental concerns and the push for sustainable packaging solutions are placing pressure on manufacturers to adopt eco-friendly materials and production methods. Lastly, intense competition among numerous players, both domestic and international, presents significant challenges.
Emerging Opportunities in APAC Plastic Caps & Closure Industry
The APAC plastic caps and closures market offers several exciting opportunities. The rising demand for convenient and sustainable packaging solutions presents considerable potential. Furthermore, the increasing adoption of e-commerce and online retail is creating opportunities for innovative packaging designs. The growth of the healthcare sector and the increasing need for pharmaceutical packaging are also creating significant opportunities in this market. Lastly, the exploration of new materials and technologies offers significant potential for future market expansion.
Leading Players in the APAC Plastic Caps & Closure Industry Market
- Comar LLC
- Pelliconi & C Spa
- Guala Closures Group
- SKS Bottle & Packaging Inc
- Crown Holdings Inc
- AptarGroup Inc
- Albea Group
- Coral Products PLC
- Evergreen Packaging Inc
- Nippon closures Co Ltd
- BERICAP GmbH & Co KG
- Tetra Pak International SA
- Berry Global Inc
- O Berk Company LLC
- Silgan Holdings Inc
- Closure Systems International
- MJS Packaging
- Amcor Ltd
Key Developments in APAC Plastic Caps & Closure Industry Industry
- June 2020: Silgan Holdings Inc. acquired the dispensing business of the Albea Group for $900 million, significantly altering the competitive landscape.
Future Outlook for APAC Plastic Caps & Closure Industry Market
The APAC plastic caps and closures market is poised for continued growth, driven by sustained economic expansion, increasing consumer demand, and technological innovation. The focus on sustainable packaging solutions and the emergence of new materials will further shape market dynamics. Strategic investments in research and development, along with collaborations to improve supply chain efficiency, will be crucial for success in this competitive environment. The market is expected to witness a steady increase in the demand for specialized closures and packaging solutions catering to niche market segments.
APAC Plastic Caps & Closure Industry Segmentation
-
1. Material
- 1.1. PET
- 1.2. PP
- 1.3. LDPE and HDPE
- 1.4. Other Materials
-
2. End-user Industry
- 2.1. Beverage
- 2.2. Food
- 2.3. Pharmaceutical and Healthcare
- 2.4. Cosmetics and Toiletries
- 2.5. Househol
- 2.6. Other En
APAC Plastic Caps & Closure Industry Segmentation By Geography
-
1. North America
- 1.1. United States
- 1.2. Canada
- 1.3. Mexico
-
2. South America
- 2.1. Brazil
- 2.2. Argentina
- 2.3. Rest of South America
-
3. Europe
- 3.1. United Kingdom
- 3.2. Germany
- 3.3. France
- 3.4. Italy
- 3.5. Spain
- 3.6. Russia
- 3.7. Benelux
- 3.8. Nordics
- 3.9. Rest of Europe
-
4. Middle East & Africa
- 4.1. Turkey
- 4.2. Israel
- 4.3. GCC
- 4.4. North Africa
- 4.5. South Africa
- 4.6. Rest of Middle East & Africa
-
5. Asia Pacific
- 5.1. China
- 5.2. India
- 5.3. Japan
- 5.4. South Korea
- 5.5. ASEAN
- 5.6. Oceania
- 5.7. Rest of Asia Pacific
APAC Plastic Caps & Closure Industry REPORT HIGHLIGHTS
| Aspects | Details |
|---|---|
| Study Period | 2019-2033 |
| Base Year | 2024 |
| Estimated Year | 2025 |
| Forecast Period | 2025-2033 |
| Historical Period | 2019-2024 |
| Growth Rate | CAGR of 4.90% from 2019-2033 |
| Segmentation |
|
Table of Contents
- 1. Introduction
- 1.1. Research Scope
- 1.2. Market Segmentation
- 1.3. Research Methodology
- 1.4. Definitions and Assumptions
- 2. Executive Summary
- 2.1. Introduction
- 3. Market Dynamics
- 3.1. Introduction
- 3.2. Market Drivers
- 3.2.1. Growing Consumption of Single Serve Beverages; Advent of Innovative Products
- 3.3. Market Restrains
- 3.3.1. Regulations on Usage of Pet Bottles/Caps in Pharmaceutical Drugs and Food Packaging
- 3.4. Market Trends
- 3.4.1. PET is Expected to Witness Significant Growth
- 4. Market Factor Analysis
- 4.1. Porters Five Forces
- 4.2. Supply/Value Chain
- 4.3. PESTEL analysis
- 4.4. Market Entropy
- 4.5. Patent/Trademark Analysis
- 5. Global APAC Plastic Caps & Closure Industry Analysis, Insights and Forecast, 2019-2031
- 5.1. Market Analysis, Insights and Forecast - by Material
- 5.1.1. PET
- 5.1.2. PP
- 5.1.3. LDPE and HDPE
- 5.1.4. Other Materials
- 5.2. Market Analysis, Insights and Forecast - by End-user Industry
- 5.2.1. Beverage
- 5.2.2. Food
- 5.2.3. Pharmaceutical and Healthcare
- 5.2.4. Cosmetics and Toiletries
- 5.2.5. Househol
- 5.2.6. Other En
- 5.3. Market Analysis, Insights and Forecast - by Region
- 5.3.1. North America
- 5.3.2. South America
- 5.3.3. Europe
- 5.3.4. Middle East & Africa
- 5.3.5. Asia Pacific
- 5.1. Market Analysis, Insights and Forecast - by Material
- 6. North America APAC Plastic Caps & Closure Industry Analysis, Insights and Forecast, 2019-2031
- 6.1. Market Analysis, Insights and Forecast - by Material
- 6.1.1. PET
- 6.1.2. PP
- 6.1.3. LDPE and HDPE
- 6.1.4. Other Materials
- 6.2. Market Analysis, Insights and Forecast - by End-user Industry
- 6.2.1. Beverage
- 6.2.2. Food
- 6.2.3. Pharmaceutical and Healthcare
- 6.2.4. Cosmetics and Toiletries
- 6.2.5. Househol
- 6.2.6. Other En
- 6.1. Market Analysis, Insights and Forecast - by Material
- 7. South America APAC Plastic Caps & Closure Industry Analysis, Insights and Forecast, 2019-2031
- 7.1. Market Analysis, Insights and Forecast - by Material
- 7.1.1. PET
- 7.1.2. PP
- 7.1.3. LDPE and HDPE
- 7.1.4. Other Materials
- 7.2. Market Analysis, Insights and Forecast - by End-user Industry
- 7.2.1. Beverage
- 7.2.2. Food
- 7.2.3. Pharmaceutical and Healthcare
- 7.2.4. Cosmetics and Toiletries
- 7.2.5. Househol
- 7.2.6. Other En
- 7.1. Market Analysis, Insights and Forecast - by Material
- 8. Europe APAC Plastic Caps & Closure Industry Analysis, Insights and Forecast, 2019-2031
- 8.1. Market Analysis, Insights and Forecast - by Material
- 8.1.1. PET
- 8.1.2. PP
- 8.1.3. LDPE and HDPE
- 8.1.4. Other Materials
- 8.2. Market Analysis, Insights and Forecast - by End-user Industry
- 8.2.1. Beverage
- 8.2.2. Food
- 8.2.3. Pharmaceutical and Healthcare
- 8.2.4. Cosmetics and Toiletries
- 8.2.5. Househol
- 8.2.6. Other En
- 8.1. Market Analysis, Insights and Forecast - by Material
- 9. Middle East & Africa APAC Plastic Caps & Closure Industry Analysis, Insights and Forecast, 2019-2031
- 9.1. Market Analysis, Insights and Forecast - by Material
- 9.1.1. PET
- 9.1.2. PP
- 9.1.3. LDPE and HDPE
- 9.1.4. Other Materials
- 9.2. Market Analysis, Insights and Forecast - by End-user Industry
- 9.2.1. Beverage
- 9.2.2. Food
- 9.2.3. Pharmaceutical and Healthcare
- 9.2.4. Cosmetics and Toiletries
- 9.2.5. Househol
- 9.2.6. Other En
- 9.1. Market Analysis, Insights and Forecast - by Material
- 10. Asia Pacific APAC Plastic Caps & Closure Industry Analysis, Insights and Forecast, 2019-2031
- 10.1. Market Analysis, Insights and Forecast - by Material
- 10.1.1. PET
- 10.1.2. PP
- 10.1.3. LDPE and HDPE
- 10.1.4. Other Materials
- 10.2. Market Analysis, Insights and Forecast - by End-user Industry
- 10.2.1. Beverage
- 10.2.2. Food
- 10.2.3. Pharmaceutical and Healthcare
- 10.2.4. Cosmetics and Toiletries
- 10.2.5. Househol
- 10.2.6. Other En
- 10.1. Market Analysis, Insights and Forecast - by Material
- 11. North America APAC Plastic Caps & Closure Industry Analysis, Insights and Forecast, 2019-2031
- 11.1. Market Analysis, Insights and Forecast - By Country/Sub-region
- 11.1.1 United States
- 11.1.2 Canada
- 12. Europe APAC Plastic Caps & Closure Industry Analysis, Insights and Forecast, 2019-2031
- 12.1. Market Analysis, Insights and Forecast - By Country/Sub-region
- 12.1.1 United Kingdom
- 12.1.2 Germany
- 12.1.3 France
- 12.1.4 Italy
- 12.1.5 Spain
- 12.1.6 Rest of Europe
- 13. Asia Pacific APAC Plastic Caps & Closure Industry Analysis, Insights and Forecast, 2019-2031
- 13.1. Market Analysis, Insights and Forecast - By Country/Sub-region
- 13.1.1 China
- 13.1.2 India
- 13.1.3 Japan
- 13.1.4 Australia
- 13.1.5 South Korea
- 13.1.6 Southeast Asia
- 13.1.7 Rest of Asia Pacific
- 14. Latin America APAC Plastic Caps & Closure Industry Analysis, Insights and Forecast, 2019-2031
- 14.1. Market Analysis, Insights and Forecast - By Country/Sub-region
- 14.1.1.
- 15. Middle East and Africa APAC Plastic Caps & Closure Industry Analysis, Insights and Forecast, 2019-2031
- 15.1. Market Analysis, Insights and Forecast - By Country/Sub-region
- 15.1.1.
- 16. Competitive Analysis
- 16.1. Global Market Share Analysis 2024
- 16.2. Company Profiles
- 16.2.1 Comar LLC
- 16.2.1.1. Overview
- 16.2.1.2. Products
- 16.2.1.3. SWOT Analysis
- 16.2.1.4. Recent Developments
- 16.2.1.5. Financials (Based on Availability)
- 16.2.2 Pelliconi & C Spa*List Not Exhaustive
- 16.2.2.1. Overview
- 16.2.2.2. Products
- 16.2.2.3. SWOT Analysis
- 16.2.2.4. Recent Developments
- 16.2.2.5. Financials (Based on Availability)
- 16.2.3 Guala Closures Group
- 16.2.3.1. Overview
- 16.2.3.2. Products
- 16.2.3.3. SWOT Analysis
- 16.2.3.4. Recent Developments
- 16.2.3.5. Financials (Based on Availability)
- 16.2.4 SKS Bottle & Packaging Inc
- 16.2.4.1. Overview
- 16.2.4.2. Products
- 16.2.4.3. SWOT Analysis
- 16.2.4.4. Recent Developments
- 16.2.4.5. Financials (Based on Availability)
- 16.2.5 Crown Holdings Inc
- 16.2.5.1. Overview
- 16.2.5.2. Products
- 16.2.5.3. SWOT Analysis
- 16.2.5.4. Recent Developments
- 16.2.5.5. Financials (Based on Availability)
- 16.2.6 AptarGroup Inc
- 16.2.6.1. Overview
- 16.2.6.2. Products
- 16.2.6.3. SWOT Analysis
- 16.2.6.4. Recent Developments
- 16.2.6.5. Financials (Based on Availability)
- 16.2.7 Albea Group
- 16.2.7.1. Overview
- 16.2.7.2. Products
- 16.2.7.3. SWOT Analysis
- 16.2.7.4. Recent Developments
- 16.2.7.5. Financials (Based on Availability)
- 16.2.8 Coral Products PLC
- 16.2.8.1. Overview
- 16.2.8.2. Products
- 16.2.8.3. SWOT Analysis
- 16.2.8.4. Recent Developments
- 16.2.8.5. Financials (Based on Availability)
- 16.2.9 Evergreen Packaging Inc
- 16.2.9.1. Overview
- 16.2.9.2. Products
- 16.2.9.3. SWOT Analysis
- 16.2.9.4. Recent Developments
- 16.2.9.5. Financials (Based on Availability)
- 16.2.10 Nippon closures Co Ltd
- 16.2.10.1. Overview
- 16.2.10.2. Products
- 16.2.10.3. SWOT Analysis
- 16.2.10.4. Recent Developments
- 16.2.10.5. Financials (Based on Availability)
- 16.2.11 BERICAP GmbH & Co KG
- 16.2.11.1. Overview
- 16.2.11.2. Products
- 16.2.11.3. SWOT Analysis
- 16.2.11.4. Recent Developments
- 16.2.11.5. Financials (Based on Availability)
- 16.2.12 Tetra Pak International SA
- 16.2.12.1. Overview
- 16.2.12.2. Products
- 16.2.12.3. SWOT Analysis
- 16.2.12.4. Recent Developments
- 16.2.12.5. Financials (Based on Availability)
- 16.2.13 Berry Global Inc
- 16.2.13.1. Overview
- 16.2.13.2. Products
- 16.2.13.3. SWOT Analysis
- 16.2.13.4. Recent Developments
- 16.2.13.5. Financials (Based on Availability)
- 16.2.14 O Berk Company LLC
- 16.2.14.1. Overview
- 16.2.14.2. Products
- 16.2.14.3. SWOT Analysis
- 16.2.14.4. Recent Developments
- 16.2.14.5. Financials (Based on Availability)
- 16.2.15 Silgan Holdings Inc
- 16.2.15.1. Overview
- 16.2.15.2. Products
- 16.2.15.3. SWOT Analysis
- 16.2.15.4. Recent Developments
- 16.2.15.5. Financials (Based on Availability)
- 16.2.16 Closure Systems International
- 16.2.16.1. Overview
- 16.2.16.2. Products
- 16.2.16.3. SWOT Analysis
- 16.2.16.4. Recent Developments
- 16.2.16.5. Financials (Based on Availability)
- 16.2.17 MJS Packaging
- 16.2.17.1. Overview
- 16.2.17.2. Products
- 16.2.17.3. SWOT Analysis
- 16.2.17.4. Recent Developments
- 16.2.17.5. Financials (Based on Availability)
- 16.2.18 Amcor Ltd
- 16.2.18.1. Overview
- 16.2.18.2. Products
- 16.2.18.3. SWOT Analysis
- 16.2.18.4. Recent Developments
- 16.2.18.5. Financials (Based on Availability)
- 16.2.1 Comar LLC
List of Figures
- Figure 1: Global APAC Plastic Caps & Closure Industry Revenue Breakdown (Million, %) by Region 2024 & 2032
- Figure 2: North America APAC Plastic Caps & Closure Industry Revenue (Million), by Country 2024 & 2032
- Figure 3: North America APAC Plastic Caps & Closure Industry Revenue Share (%), by Country 2024 & 2032
- Figure 4: Europe APAC Plastic Caps & Closure Industry Revenue (Million), by Country 2024 & 2032
- Figure 5: Europe APAC Plastic Caps & Closure Industry Revenue Share (%), by Country 2024 & 2032
- Figure 6: Asia Pacific APAC Plastic Caps & Closure Industry Revenue (Million), by Country 2024 & 2032
- Figure 7: Asia Pacific APAC Plastic Caps & Closure Industry Revenue Share (%), by Country 2024 & 2032
- Figure 8: Latin America APAC Plastic Caps & Closure Industry Revenue (Million), by Country 2024 & 2032
- Figure 9: Latin America APAC Plastic Caps & Closure Industry Revenue Share (%), by Country 2024 & 2032
- Figure 10: Middle East and Africa APAC Plastic Caps & Closure Industry Revenue (Million), by Country 2024 & 2032
- Figure 11: Middle East and Africa APAC Plastic Caps & Closure Industry Revenue Share (%), by Country 2024 & 2032
- Figure 12: North America APAC Plastic Caps & Closure Industry Revenue (Million), by Material 2024 & 2032
- Figure 13: North America APAC Plastic Caps & Closure Industry Revenue Share (%), by Material 2024 & 2032
- Figure 14: North America APAC Plastic Caps & Closure Industry Revenue (Million), by End-user Industry 2024 & 2032
- Figure 15: North America APAC Plastic Caps & Closure Industry Revenue Share (%), by End-user Industry 2024 & 2032
- Figure 16: North America APAC Plastic Caps & Closure Industry Revenue (Million), by Country 2024 & 2032
- Figure 17: North America APAC Plastic Caps & Closure Industry Revenue Share (%), by Country 2024 & 2032
- Figure 18: South America APAC Plastic Caps & Closure Industry Revenue (Million), by Material 2024 & 2032
- Figure 19: South America APAC Plastic Caps & Closure Industry Revenue Share (%), by Material 2024 & 2032
- Figure 20: South America APAC Plastic Caps & Closure Industry Revenue (Million), by End-user Industry 2024 & 2032
- Figure 21: South America APAC Plastic Caps & Closure Industry Revenue Share (%), by End-user Industry 2024 & 2032
- Figure 22: South America APAC Plastic Caps & Closure Industry Revenue (Million), by Country 2024 & 2032
- Figure 23: South America APAC Plastic Caps & Closure Industry Revenue Share (%), by Country 2024 & 2032
- Figure 24: Europe APAC Plastic Caps & Closure Industry Revenue (Million), by Material 2024 & 2032
- Figure 25: Europe APAC Plastic Caps & Closure Industry Revenue Share (%), by Material 2024 & 2032
- Figure 26: Europe APAC Plastic Caps & Closure Industry Revenue (Million), by End-user Industry 2024 & 2032
- Figure 27: Europe APAC Plastic Caps & Closure Industry Revenue Share (%), by End-user Industry 2024 & 2032
- Figure 28: Europe APAC Plastic Caps & Closure Industry Revenue (Million), by Country 2024 & 2032
- Figure 29: Europe APAC Plastic Caps & Closure Industry Revenue Share (%), by Country 2024 & 2032
- Figure 30: Middle East & Africa APAC Plastic Caps & Closure Industry Revenue (Million), by Material 2024 & 2032
- Figure 31: Middle East & Africa APAC Plastic Caps & Closure Industry Revenue Share (%), by Material 2024 & 2032
- Figure 32: Middle East & Africa APAC Plastic Caps & Closure Industry Revenue (Million), by End-user Industry 2024 & 2032
- Figure 33: Middle East & Africa APAC Plastic Caps & Closure Industry Revenue Share (%), by End-user Industry 2024 & 2032
- Figure 34: Middle East & Africa APAC Plastic Caps & Closure Industry Revenue (Million), by Country 2024 & 2032
- Figure 35: Middle East & Africa APAC Plastic Caps & Closure Industry Revenue Share (%), by Country 2024 & 2032
- Figure 36: Asia Pacific APAC Plastic Caps & Closure Industry Revenue (Million), by Material 2024 & 2032
- Figure 37: Asia Pacific APAC Plastic Caps & Closure Industry Revenue Share (%), by Material 2024 & 2032
- Figure 38: Asia Pacific APAC Plastic Caps & Closure Industry Revenue (Million), by End-user Industry 2024 & 2032
- Figure 39: Asia Pacific APAC Plastic Caps & Closure Industry Revenue Share (%), by End-user Industry 2024 & 2032
- Figure 40: Asia Pacific APAC Plastic Caps & Closure Industry Revenue (Million), by Country 2024 & 2032
- Figure 41: Asia Pacific APAC Plastic Caps & Closure Industry Revenue Share (%), by Country 2024 & 2032
List of Tables
- Table 1: Global APAC Plastic Caps & Closure Industry Revenue Million Forecast, by Region 2019 & 2032
- Table 2: Global APAC Plastic Caps & Closure Industry Revenue Million Forecast, by Material 2019 & 2032
- Table 3: Global APAC Plastic Caps & Closure Industry Revenue Million Forecast, by End-user Industry 2019 & 2032
- Table 4: Global APAC Plastic Caps & Closure Industry Revenue Million Forecast, by Region 2019 & 2032
- Table 5: Global APAC Plastic Caps & Closure Industry Revenue Million Forecast, by Country 2019 & 2032
- Table 6: United States APAC Plastic Caps & Closure Industry Revenue (Million) Forecast, by Application 2019 & 2032
- Table 7: Canada APAC Plastic Caps & Closure Industry Revenue (Million) Forecast, by Application 2019 & 2032
- Table 8: Global APAC Plastic Caps & Closure Industry Revenue Million Forecast, by Country 2019 & 2032
- Table 9: United Kingdom APAC Plastic Caps & Closure Industry Revenue (Million) Forecast, by Application 2019 & 2032
- Table 10: Germany APAC Plastic Caps & Closure Industry Revenue (Million) Forecast, by Application 2019 & 2032
- Table 11: France APAC Plastic Caps & Closure Industry Revenue (Million) Forecast, by Application 2019 & 2032
- Table 12: Italy APAC Plastic Caps & Closure Industry Revenue (Million) Forecast, by Application 2019 & 2032
- Table 13: Spain APAC Plastic Caps & Closure Industry Revenue (Million) Forecast, by Application 2019 & 2032
- Table 14: Rest of Europe APAC Plastic Caps & Closure Industry Revenue (Million) Forecast, by Application 2019 & 2032
- Table 15: Global APAC Plastic Caps & Closure Industry Revenue Million Forecast, by Country 2019 & 2032
- Table 16: China APAC Plastic Caps & Closure Industry Revenue (Million) Forecast, by Application 2019 & 2032
- Table 17: India APAC Plastic Caps & Closure Industry Revenue (Million) Forecast, by Application 2019 & 2032
- Table 18: Japan APAC Plastic Caps & Closure Industry Revenue (Million) Forecast, by Application 2019 & 2032
- Table 19: Australia APAC Plastic Caps & Closure Industry Revenue (Million) Forecast, by Application 2019 & 2032
- Table 20: South Korea APAC Plastic Caps & Closure Industry Revenue (Million) Forecast, by Application 2019 & 2032
- Table 21: Southeast Asia APAC Plastic Caps & Closure Industry Revenue (Million) Forecast, by Application 2019 & 2032
- Table 22: Rest of Asia Pacific APAC Plastic Caps & Closure Industry Revenue (Million) Forecast, by Application 2019 & 2032
- Table 23: Global APAC Plastic Caps & Closure Industry Revenue Million Forecast, by Country 2019 & 2032
- Table 24: APAC Plastic Caps & Closure Industry Revenue (Million) Forecast, by Application 2019 & 2032
- Table 25: Global APAC Plastic Caps & Closure Industry Revenue Million Forecast, by Country 2019 & 2032
- Table 26: APAC Plastic Caps & Closure Industry Revenue (Million) Forecast, by Application 2019 & 2032
- Table 27: Global APAC Plastic Caps & Closure Industry Revenue Million Forecast, by Material 2019 & 2032
- Table 28: Global APAC Plastic Caps & Closure Industry Revenue Million Forecast, by End-user Industry 2019 & 2032
- Table 29: Global APAC Plastic Caps & Closure Industry Revenue Million Forecast, by Country 2019 & 2032
- Table 30: United States APAC Plastic Caps & Closure Industry Revenue (Million) Forecast, by Application 2019 & 2032
- Table 31: Canada APAC Plastic Caps & Closure Industry Revenue (Million) Forecast, by Application 2019 & 2032
- Table 32: Mexico APAC Plastic Caps & Closure Industry Revenue (Million) Forecast, by Application 2019 & 2032
- Table 33: Global APAC Plastic Caps & Closure Industry Revenue Million Forecast, by Material 2019 & 2032
- Table 34: Global APAC Plastic Caps & Closure Industry Revenue Million Forecast, by End-user Industry 2019 & 2032
- Table 35: Global APAC Plastic Caps & Closure Industry Revenue Million Forecast, by Country 2019 & 2032
- Table 36: Brazil APAC Plastic Caps & Closure Industry Revenue (Million) Forecast, by Application 2019 & 2032
- Table 37: Argentina APAC Plastic Caps & Closure Industry Revenue (Million) Forecast, by Application 2019 & 2032
- Table 38: Rest of South America APAC Plastic Caps & Closure Industry Revenue (Million) Forecast, by Application 2019 & 2032
- Table 39: Global APAC Plastic Caps & Closure Industry Revenue Million Forecast, by Material 2019 & 2032
- Table 40: Global APAC Plastic Caps & Closure Industry Revenue Million Forecast, by End-user Industry 2019 & 2032
- Table 41: Global APAC Plastic Caps & Closure Industry Revenue Million Forecast, by Country 2019 & 2032
- Table 42: United Kingdom APAC Plastic Caps & Closure Industry Revenue (Million) Forecast, by Application 2019 & 2032
- Table 43: Germany APAC Plastic Caps & Closure Industry Revenue (Million) Forecast, by Application 2019 & 2032
- Table 44: France APAC Plastic Caps & Closure Industry Revenue (Million) Forecast, by Application 2019 & 2032
- Table 45: Italy APAC Plastic Caps & Closure Industry Revenue (Million) Forecast, by Application 2019 & 2032
- Table 46: Spain APAC Plastic Caps & Closure Industry Revenue (Million) Forecast, by Application 2019 & 2032
- Table 47: Russia APAC Plastic Caps & Closure Industry Revenue (Million) Forecast, by Application 2019 & 2032
- Table 48: Benelux APAC Plastic Caps & Closure Industry Revenue (Million) Forecast, by Application 2019 & 2032
- Table 49: Nordics APAC Plastic Caps & Closure Industry Revenue (Million) Forecast, by Application 2019 & 2032
- Table 50: Rest of Europe APAC Plastic Caps & Closure Industry Revenue (Million) Forecast, by Application 2019 & 2032
- Table 51: Global APAC Plastic Caps & Closure Industry Revenue Million Forecast, by Material 2019 & 2032
- Table 52: Global APAC Plastic Caps & Closure Industry Revenue Million Forecast, by End-user Industry 2019 & 2032
- Table 53: Global APAC Plastic Caps & Closure Industry Revenue Million Forecast, by Country 2019 & 2032
- Table 54: Turkey APAC Plastic Caps & Closure Industry Revenue (Million) Forecast, by Application 2019 & 2032
- Table 55: Israel APAC Plastic Caps & Closure Industry Revenue (Million) Forecast, by Application 2019 & 2032
- Table 56: GCC APAC Plastic Caps & Closure Industry Revenue (Million) Forecast, by Application 2019 & 2032
- Table 57: North Africa APAC Plastic Caps & Closure Industry Revenue (Million) Forecast, by Application 2019 & 2032
- Table 58: South Africa APAC Plastic Caps & Closure Industry Revenue (Million) Forecast, by Application 2019 & 2032
- Table 59: Rest of Middle East & Africa APAC Plastic Caps & Closure Industry Revenue (Million) Forecast, by Application 2019 & 2032
- Table 60: Global APAC Plastic Caps & Closure Industry Revenue Million Forecast, by Material 2019 & 2032
- Table 61: Global APAC Plastic Caps & Closure Industry Revenue Million Forecast, by End-user Industry 2019 & 2032
- Table 62: Global APAC Plastic Caps & Closure Industry Revenue Million Forecast, by Country 2019 & 2032
- Table 63: China APAC Plastic Caps & Closure Industry Revenue (Million) Forecast, by Application 2019 & 2032
- Table 64: India APAC Plastic Caps & Closure Industry Revenue (Million) Forecast, by Application 2019 & 2032
- Table 65: Japan APAC Plastic Caps & Closure Industry Revenue (Million) Forecast, by Application 2019 & 2032
- Table 66: South Korea APAC Plastic Caps & Closure Industry Revenue (Million) Forecast, by Application 2019 & 2032
- Table 67: ASEAN APAC Plastic Caps & Closure Industry Revenue (Million) Forecast, by Application 2019 & 2032
- Table 68: Oceania APAC Plastic Caps & Closure Industry Revenue (Million) Forecast, by Application 2019 & 2032
- Table 69: Rest of Asia Pacific APAC Plastic Caps & Closure Industry Revenue (Million) Forecast, by Application 2019 & 2032
Frequently Asked Questions
1. What is the projected Compound Annual Growth Rate (CAGR) of the APAC Plastic Caps & Closure Industry?
The projected CAGR is approximately 4.90%.
2. Which companies are prominent players in the APAC Plastic Caps & Closure Industry?
Key companies in the market include Comar LLC, Pelliconi & C Spa*List Not Exhaustive, Guala Closures Group, SKS Bottle & Packaging Inc, Crown Holdings Inc, AptarGroup Inc, Albea Group, Coral Products PLC, Evergreen Packaging Inc, Nippon closures Co Ltd, BERICAP GmbH & Co KG, Tetra Pak International SA, Berry Global Inc, O Berk Company LLC, Silgan Holdings Inc, Closure Systems International, MJS Packaging, Amcor Ltd.
3. What are the main segments of the APAC Plastic Caps & Closure Industry?
The market segments include Material, End-user Industry.
4. Can you provide details about the market size?
The market size is estimated to be USD XX Million as of 2022.
5. What are some drivers contributing to market growth?
Growing Consumption of Single Serve Beverages; Advent of Innovative Products.
6. What are the notable trends driving market growth?
PET is Expected to Witness Significant Growth.
7. Are there any restraints impacting market growth?
Regulations on Usage of Pet Bottles/Caps in Pharmaceutical Drugs and Food Packaging.
8. Can you provide examples of recent developments in the market?
June 2020 - Silgan Holdings Inc., a leading supplier of sustainable rigid packaging solutions for consumer goods products, acquired the dispensing business of the Albea Group for $900 million.
9. What pricing options are available for accessing the report?
Pricing options include single-user, multi-user, and enterprise licenses priced at USD 4750, USD 4950, and USD 6800 respectively.
10. Is the market size provided in terms of value or volume?
The market size is provided in terms of value, measured in Million.
11. Are there any specific market keywords associated with the report?
Yes, the market keyword associated with the report is "APAC Plastic Caps & Closure Industry," which aids in identifying and referencing the specific market segment covered.
12. How do I determine which pricing option suits my needs best?
The pricing options vary based on user requirements and access needs. Individual users may opt for single-user licenses, while businesses requiring broader access may choose multi-user or enterprise licenses for cost-effective access to the report.
13. Are there any additional resources or data provided in the APAC Plastic Caps & Closure Industry report?
While the report offers comprehensive insights, it's advisable to review the specific contents or supplementary materials provided to ascertain if additional resources or data are available.
14. How can I stay updated on further developments or reports in the APAC Plastic Caps & Closure Industry?
To stay informed about further developments, trends, and reports in the APAC Plastic Caps & Closure Industry, consider subscribing to industry newsletters, following relevant companies and organizations, or regularly checking reputable industry news sources and publications.
Methodology
Step 1 - Identification of Relevant Samples Size from Population Database


Step 2 - Approaches for Defining Global Market Size (Value, Volume* & Price*)

Note*: In applicable scenarios
Step 3 - Data Sources
Primary Research
- Web Analytics
- Survey Reports
- Research Institute
- Latest Research Reports
- Opinion Leaders
Secondary Research
- Annual Reports
- White Paper
- Latest Press Release
- Industry Association
- Paid Database
- Investor Presentations

Step 4 - Data Triangulation
Involves using different sources of information in order to increase the validity of a study
These sources are likely to be stakeholders in a program - participants, other researchers, program staff, other community members, and so on.
Then we put all data in single framework & apply various statistical tools to find out the dynamic on the market.
During the analysis stage, feedback from the stakeholder groups would be compared to determine areas of agreement as well as areas of divergence


