
Key Insights
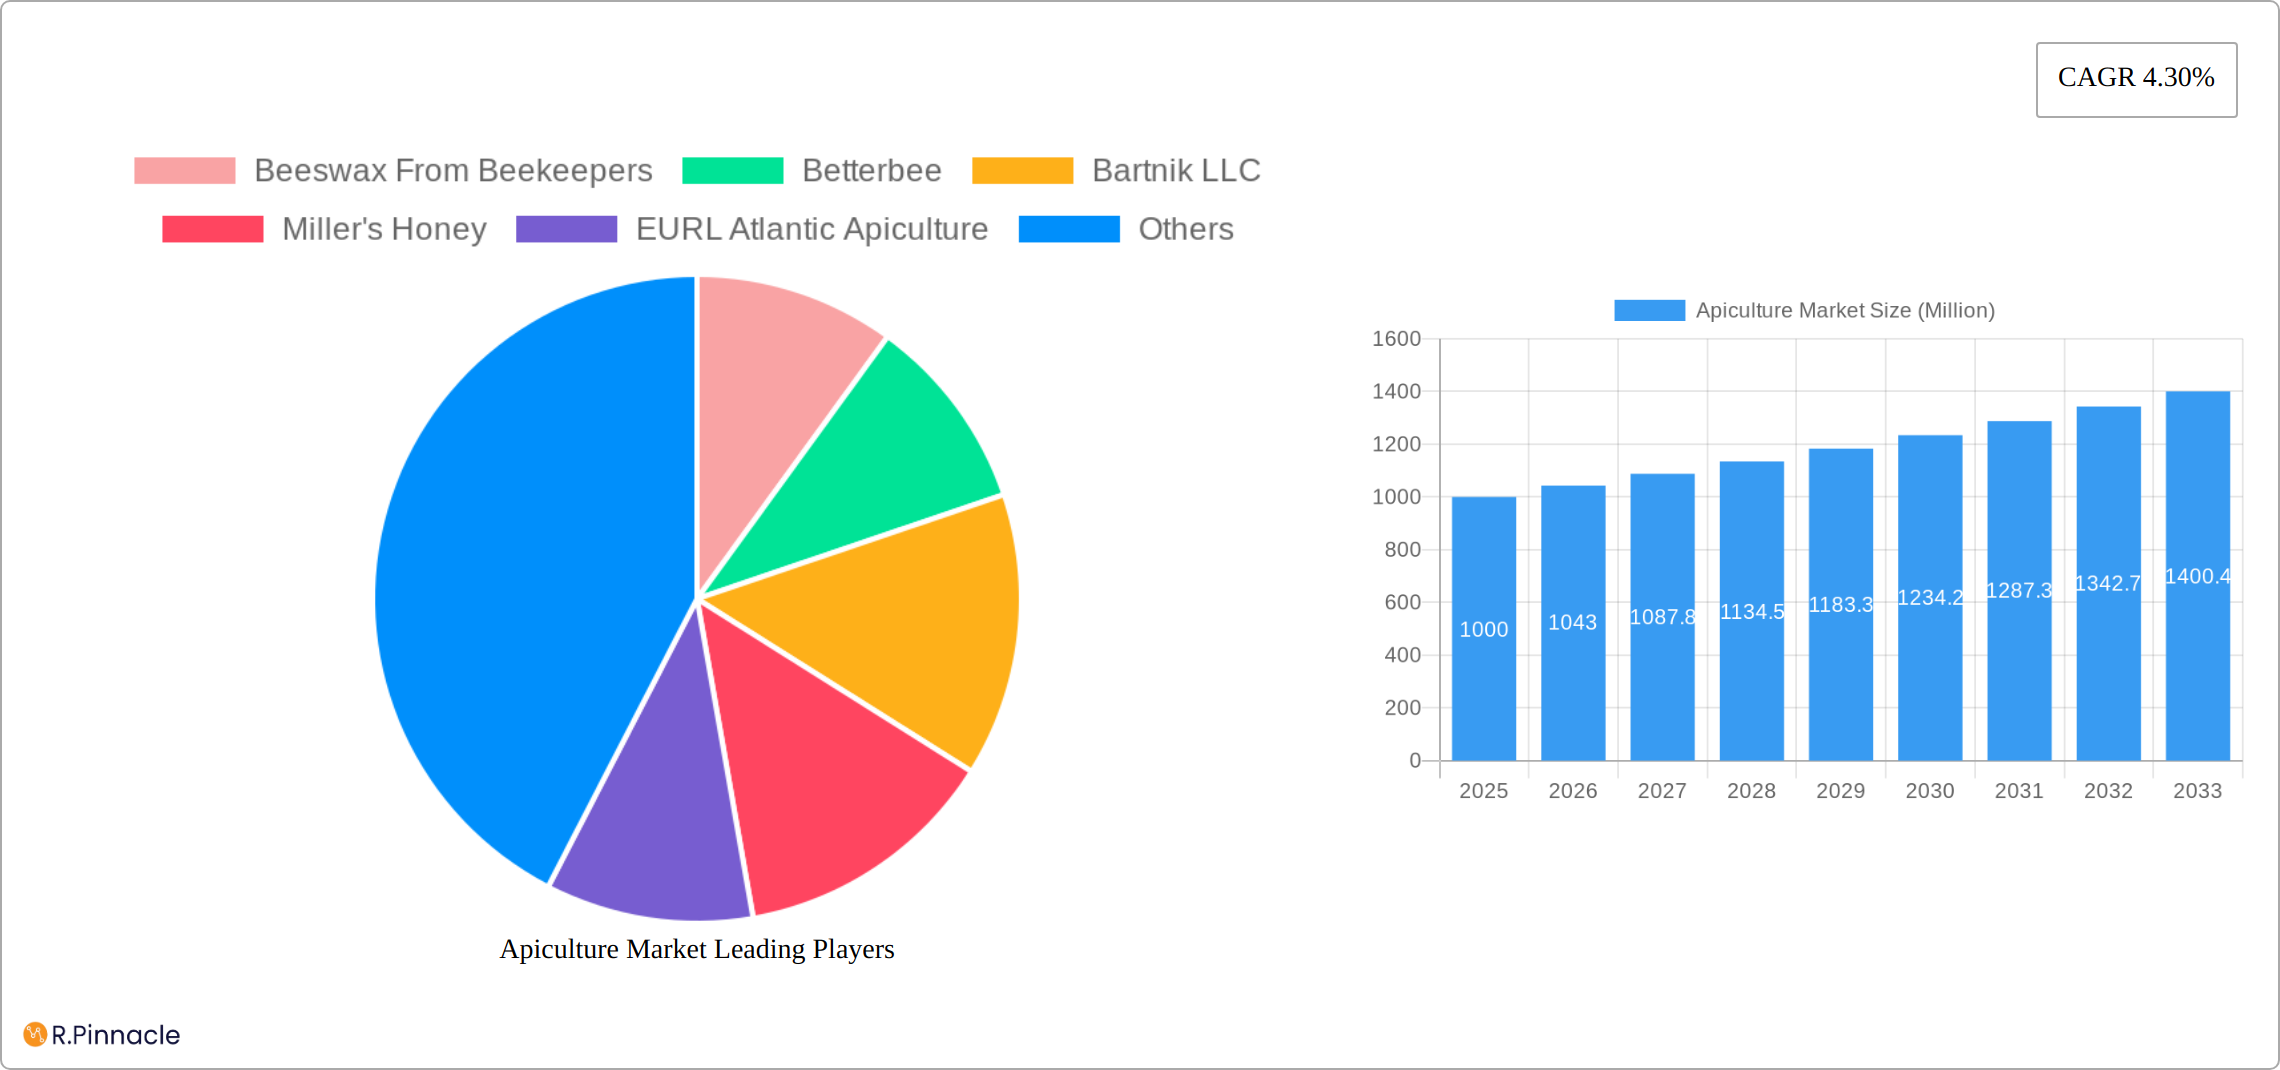
The global apiculture market, encompassing honey, beeswax, live bees, and other products, is experiencing steady growth, projected to maintain a Compound Annual Growth Rate (CAGR) of 4.30% from 2025 to 2033. This expansion is driven by several key factors. Rising consumer awareness of the health benefits of honey and beeswax in food, cosmetics, and pharmaceuticals fuels demand. The growing popularity of natural and organic products further contributes to market expansion. Increased adoption of sustainable agricultural practices and rising demand for pollination services in agriculture also positively influence market growth. The market is segmented by product type (honey, beeswax, live bees, others) and application (medical, food & beverages, cosmetics, others), offering diverse opportunities for market players. Regional variations in market size exist, with North America and Europe currently holding significant shares, although the Asia-Pacific region presents considerable growth potential due to increasing honey consumption and expanding beekeeping activities.
However, the apiculture market also faces challenges. The declining bee population due to habitat loss, pesticide use, and climate change poses a significant threat. Fluctuations in honey production due to unpredictable weather patterns and disease outbreaks create price volatility and impact profitability. Competition from synthetic substitutes in certain applications, particularly in the cosmetics industry, also represents a restraining force. Companies involved in apiculture are focusing on sustainable beekeeping practices, developing innovative products, and expanding into new markets to overcome these challenges and capitalize on the growth opportunities presented by this dynamic sector. The market's success hinges on addressing environmental concerns while meeting the rising global demand for apiculture products.
Apiculture Market Report: 2019-2033 Forecast
This comprehensive report provides a detailed analysis of the global apiculture market, encompassing historical data (2019-2024), current estimates (2025), and future projections (2025-2033). It offers invaluable insights for industry professionals, investors, and stakeholders seeking to understand market dynamics, growth opportunities, and competitive landscapes within the apiculture sector. The report covers a market valued at $XX Million in 2025, projected to reach $XX Million by 2033, exhibiting a CAGR of XX%.
Apiculture Market Structure & Innovation Trends
The global apiculture market is characterized by a moderately fragmented structure with several large players and numerous smaller regional operators. Market share is distributed among companies like Beeswax From Beekeepers, Betterbee, Bartnik LLC, Miller's Honey, EURL Atlantic Apiculture, Arnold honey bee services, Clearskys, PhytoPharma International Ltd (Bee-Fuse Technology), Beehive Botanicals, and Pastili Limited, amongst others. While exact market share figures are unavailable for all players, some dominate specific segments. Innovation is driven by factors such as the increasing demand for natural and organic products, technological advancements in beekeeping practices (e.g., automated hive monitoring), and the development of novel bee-derived products. Regulatory frameworks vary across regions, impacting the production and trade of apiculture products. Substitutes exist for some apiculture products (e.g., artificial sweeteners for honey), but the natural and unique properties of honey, beeswax, and other bee products provide a strong competitive advantage. End-user demographics encompass a wide range of consumers and industries, including individuals consuming honey, food and beverage manufacturers utilizing honey and beeswax, cosmetic companies using beeswax and propolis, and the pharmaceutical industry using bee venom and propolis for medicinal purposes. Mergers and acquisitions (M&A) activity is relatively frequent, with deals driven by consolidation, expanding market reach, and acquiring specialized technologies. Notable M&A activity in the past few years is detailed in the Key Developments section, although precise deal values for these transactions are unavailable.

Apiculture Market Dynamics & Trends
The apiculture market is experiencing robust growth, driven by several key factors. Rising consumer awareness regarding the health benefits of honey and other bee products fuels demand, particularly in health-conscious markets. The growing popularity of natural and organic food and cosmetics further boosts market expansion. Technological advancements, such as improved beekeeping equipment and techniques for honey extraction and processing, enhance efficiency and product quality. Shifting consumer preferences toward ethically sourced and sustainably produced products drive the adoption of certification programs like the True Source Honey Certification Program, impacting sourcing strategies. The competitive landscape is intense, with companies competing on factors such as product quality, price, brand reputation, and distribution networks. Market penetration is highest in developed countries with established beekeeping industries and a strong preference for natural products, although developing markets are showing rapid growth.
Dominant Regions & Segments in Apiculture Market
Dominant Region: Currently, North America and Europe hold significant market share owing to well-established beekeeping industries, high consumer awareness of honey and bee products, and favorable regulatory environments. Asia-Pacific shows immense growth potential due to a burgeoning population and rising disposable incomes, driving increased demand for food, beverage, and cosmetic products.
Dominant Product Type: Honey continues to dominate the apiculture market, accounting for the largest revenue share due to its widespread use in food and beverages and growing health applications.
Dominant Application: The food and beverage segment is currently the most significant end-use application for apiculture products, owing to the extensive utilization of honey as a natural sweetener and ingredient. The cosmetics segment is also experiencing a considerable rise, driven by the increasing demand for natural and organic beauty products.
Key Drivers for Regional Dominance:
North America & Europe: Strong consumer demand for natural and organic products, established beekeeping infrastructure, favorable regulatory frameworks, and significant investment in research & development.
Asia-Pacific: Rapidly growing population, increasing disposable incomes, rising health consciousness, and an expanding food and beverage industry.
Apiculture Market Product Innovations
The apiculture market is experiencing a wave of innovation, driven by increasing consumer demand for natural, traceable, and ethically-sourced products. This is evident in the expansion of bee-derived products beyond traditional honey. Propolis and bee venom are finding increased use in pharmaceuticals and cosmetics, capitalizing on their purported health benefits. Technological advancements are revolutionizing hive management, leading to improved honey production, enhanced bee health, and more efficient extraction methods that result in higher-quality honey and beeswax. Furthermore, sustainable beekeeping practices are gaining traction, emphasizing responsible harvesting and environmental stewardship. This holistic approach ensures the long-term viability of the industry while meeting the growing consumer preference for transparency and sustainability.
Report Scope & Segmentation Analysis
This report segments the apiculture market by Product Type (Honey, Beeswax, Live Bees, Others) and Application (Medical, Food & Beverages, Cosmetics, Others). Each segment is analyzed for market size, growth projections, and competitive dynamics. For instance, the honey segment exhibits high growth due to increasing health consciousness, while the beeswax segment benefits from use in cosmetics and candles. The live bees segment is driven by the needs of both commercial and hobbyist beekeepers. The "Others" category includes propolis, royal jelly, and bee pollen, each showing unique growth trajectories based on their specific applications and market demand.
Key Drivers of Apiculture Market Growth
Several factors propel the growth of the apiculture market. The increasing consumer preference for natural and organic products fuels demand for honey and beeswax. Technological advancements, leading to enhanced hive management, improved honey extraction techniques, and innovative product formulations, enhance market efficiency and product quality. Government initiatives supporting sustainable beekeeping practices and regulations promoting the use of natural ingredients are also key drivers. The expansion of food and beverage, cosmetic, and pharmaceutical industries that utilize bee products contributes significantly to the market’s expansion.
Challenges in the Apiculture Market Sector
The apiculture market faces challenges including the decline in bee populations due to habitat loss, disease, and pesticide use. This impacts honey production and creates supply chain disruptions. Stringent regulatory frameworks and certifications increase the cost and complexity of product entry into the market. Intense competition amongst producers creates pressure on pricing and profit margins. These challenges, along with fluctuating honey prices due to climate variations, present significant obstacles to industry growth. The unpredictable nature of honey production due to environmental factors presents further difficulties for market stability.
Emerging Opportunities in Apiculture Market
Emerging opportunities exist in developing specialized bee products, exploring new applications for propolis and bee venom, and tapping into untapped markets in developing economies. The increasing demand for sustainable and ethically sourced products presents a significant opportunity for businesses that can showcase their commitment to responsible beekeeping practices. Innovation in packaging and distribution can further enhance the market's reach and efficiency. Exploring the potential of utilizing bee products in new sectors like nutraceuticals holds significant promise for future market growth.
Leading Players in the Apiculture Market Market
- Beeswax From Beekeepers
- Betterbee
- Bartnik LLC
- Miller's Honey
- EURL Atlantic Apiculture
- Arnold honey bee services
- Clearskys
- PhytoPharma International Ltd (Bee-Fuse Technology)
- Beehive Botanicals
- Pastili Limited
Key Developments in Apiculture Market Industry
April 2021: Billy Bee and Doyon (McCormick & Company Inc.) announced a commitment to 100% Canadian honey sourcing, underscoring the growing consumer demand for transparency and ethical sourcing practices. This move significantly boosted the adoption of the True Source Honey Certification Program.
March 2021: Comvita's launch of a state-of-the-art Wellness Lab solidified their position as an innovator and demonstrated a strong commitment to brand experience within the premium Mānuka honey market.
January 2022: The merger of Nature Nate's and Sweet Harvest Foods signifies a notable consolidation within the honey supply chain. This strategic move is expected to drive efficiency, improve resource management, and enhance control over agricultural production.
Ongoing Trends: Increased focus on traceability, sustainable beekeeping, and the development of new bee products (e.g., propolis-based pharmaceuticals) are reshaping the industry landscape.
Future Outlook for Apiculture Market Market
The apiculture market is poised for significant growth over the forecast period, driven by factors such as increasing health consciousness, growing demand for natural and organic products, and technological advancements. The continued development of innovative bee products, expansion into new markets, and a strong focus on sustainability will further fuel market expansion. Strategic partnerships, acquisitions, and investment in research and development will play a crucial role in shaping the future of the apiculture market. Efforts towards better bee health and sustainable beekeeping practices will significantly impact the long-term growth and stability of the market.
Apiculture Market Segmentation
-
1. Product Type
- 1.1. Honey
- 1.2. Beeswax
- 1.3. Live-bees
- 1.4. Others
-
2. Application
- 2.1. Medical
- 2.2. Food Beverages
- 2.3. Cosmetics
- 2.4. Others
Apiculture Market Segmentation By Geography
-
1. North America
- 1.1. United States
- 1.2. Canada
- 1.3. Mexico
- 1.4. Rest of North America
-
2. Europe
- 2.1. Germany
- 2.2. United Kingdom
- 2.3. France
- 2.4. Russia
- 2.5. Spain
- 2.6. Rest of Europe
-
3. Asia Pacific
- 3.1. China
- 3.2. Japan
- 3.3. India
- 3.4. South Korea
- 3.5. Rest of Asia Pacific
-
4. South America
- 4.1. Brazil
- 4.2. Argentina
- 4.3. Rest of South America
-
5. Middle East and Africa
- 5.1. United Arab Emirates
- 5.2. South Africa
- 5.3. Rest of Middle East and Africa

Apiculture Market REPORT HIGHLIGHTS
| Aspects | Details |
|---|---|
| Study Period | 2019-2033 |
| Base Year | 2024 |
| Estimated Year | 2025 |
| Forecast Period | 2025-2033 |
| Historical Period | 2019-2024 |
| Growth Rate | CAGR of 4.30% from 2019-2033 |
| Segmentation |
|
Table of Contents
- 1. Introduction
- 1.1. Research Scope
- 1.2. Market Segmentation
- 1.3. Research Methodology
- 1.4. Definitions and Assumptions
- 2. Executive Summary
- 2.1. Introduction
- 3. Market Dynamics
- 3.1. Introduction
- 3.2. Market Drivers
- 3.2.1. Rising Trend of Ingestible Beauty Products; Growing demand for Nutrient-Enriched Cosmetic Products
- 3.3. Market Restrains
- 3.3.1. Availability of Counterfeit Beauty Supplements Products
- 3.4. Market Trends
- 3.4.1. Honey Emerges As a Functional Sweetener
- 4. Market Factor Analysis
- 4.1. Porters Five Forces
- 4.2. Supply/Value Chain
- 4.3. PESTEL analysis
- 4.4. Market Entropy
- 4.5. Patent/Trademark Analysis
- 5. Global Apiculture Market Analysis, Insights and Forecast, 2019-2031
- 5.1. Market Analysis, Insights and Forecast - by Product Type
- 5.1.1. Honey
- 5.1.2. Beeswax
- 5.1.3. Live-bees
- 5.1.4. Others
- 5.2. Market Analysis, Insights and Forecast - by Application
- 5.2.1. Medical
- 5.2.2. Food Beverages
- 5.2.3. Cosmetics
- 5.2.4. Others
- 5.3. Market Analysis, Insights and Forecast - by Region
- 5.3.1. North America
- 5.3.2. Europe
- 5.3.3. Asia Pacific
- 5.3.4. South America
- 5.3.5. Middle East and Africa
- 5.1. Market Analysis, Insights and Forecast - by Product Type
- 6. North America Apiculture Market Analysis, Insights and Forecast, 2019-2031
- 6.1. Market Analysis, Insights and Forecast - by Product Type
- 6.1.1. Honey
- 6.1.2. Beeswax
- 6.1.3. Live-bees
- 6.1.4. Others
- 6.2. Market Analysis, Insights and Forecast - by Application
- 6.2.1. Medical
- 6.2.2. Food Beverages
- 6.2.3. Cosmetics
- 6.2.4. Others
- 6.1. Market Analysis, Insights and Forecast - by Product Type
- 7. Europe Apiculture Market Analysis, Insights and Forecast, 2019-2031
- 7.1. Market Analysis, Insights and Forecast - by Product Type
- 7.1.1. Honey
- 7.1.2. Beeswax
- 7.1.3. Live-bees
- 7.1.4. Others
- 7.2. Market Analysis, Insights and Forecast - by Application
- 7.2.1. Medical
- 7.2.2. Food Beverages
- 7.2.3. Cosmetics
- 7.2.4. Others
- 7.1. Market Analysis, Insights and Forecast - by Product Type
- 8. Asia Pacific Apiculture Market Analysis, Insights and Forecast, 2019-2031
- 8.1. Market Analysis, Insights and Forecast - by Product Type
- 8.1.1. Honey
- 8.1.2. Beeswax
- 8.1.3. Live-bees
- 8.1.4. Others
- 8.2. Market Analysis, Insights and Forecast - by Application
- 8.2.1. Medical
- 8.2.2. Food Beverages
- 8.2.3. Cosmetics
- 8.2.4. Others
- 8.1. Market Analysis, Insights and Forecast - by Product Type
- 9. South America Apiculture Market Analysis, Insights and Forecast, 2019-2031
- 9.1. Market Analysis, Insights and Forecast - by Product Type
- 9.1.1. Honey
- 9.1.2. Beeswax
- 9.1.3. Live-bees
- 9.1.4. Others
- 9.2. Market Analysis, Insights and Forecast - by Application
- 9.2.1. Medical
- 9.2.2. Food Beverages
- 9.2.3. Cosmetics
- 9.2.4. Others
- 9.1. Market Analysis, Insights and Forecast - by Product Type
- 10. Middle East and Africa Apiculture Market Analysis, Insights and Forecast, 2019-2031
- 10.1. Market Analysis, Insights and Forecast - by Product Type
- 10.1.1. Honey
- 10.1.2. Beeswax
- 10.1.3. Live-bees
- 10.1.4. Others
- 10.2. Market Analysis, Insights and Forecast - by Application
- 10.2.1. Medical
- 10.2.2. Food Beverages
- 10.2.3. Cosmetics
- 10.2.4. Others
- 10.1. Market Analysis, Insights and Forecast - by Product Type
- 11. North America Apiculture Market Analysis, Insights and Forecast, 2019-2031
- 11.1. Market Analysis, Insights and Forecast - By Country/Sub-region
- 11.1.1 United States
- 11.1.2 Canada
- 11.1.3 Mexico
- 11.1.4 Rest of North America
- 12. Europe Apiculture Market Analysis, Insights and Forecast, 2019-2031
- 12.1. Market Analysis, Insights and Forecast - By Country/Sub-region
- 12.1.1 Germany
- 12.1.2 United Kingdom
- 12.1.3 France
- 12.1.4 Russia
- 12.1.5 Spain
- 12.1.6 Rest of Europe
- 13. Asia Pacific Apiculture Market Analysis, Insights and Forecast, 2019-2031
- 13.1. Market Analysis, Insights and Forecast - By Country/Sub-region
- 13.1.1 China
- 13.1.2 Japan
- 13.1.3 India
- 13.1.4 South Korea
- 13.1.5 Rest of Asia Pacific
- 14. South America Apiculture Market Analysis, Insights and Forecast, 2019-2031
- 14.1. Market Analysis, Insights and Forecast - By Country/Sub-region
- 14.1.1 Brazil
- 14.1.2 Argentina
- 14.1.3 Rest of South America
- 15. Middle East and Africa Apiculture Market Analysis, Insights and Forecast, 2019-2031
- 15.1. Market Analysis, Insights and Forecast - By Country/Sub-region
- 15.1.1 United Arab Emirates
- 15.1.2 South Africa
- 15.1.3 Rest of Middle East and Africa
- 16. Competitive Analysis
- 16.1. Global Market Share Analysis 2024
- 16.2. Company Profiles
- 16.2.1 Beeswax From Beekeepers
- 16.2.1.1. Overview
- 16.2.1.2. Products
- 16.2.1.3. SWOT Analysis
- 16.2.1.4. Recent Developments
- 16.2.1.5. Financials (Based on Availability)
- 16.2.2 Betterbee
- 16.2.2.1. Overview
- 16.2.2.2. Products
- 16.2.2.3. SWOT Analysis
- 16.2.2.4. Recent Developments
- 16.2.2.5. Financials (Based on Availability)
- 16.2.3 Bartnik LLC
- 16.2.3.1. Overview
- 16.2.3.2. Products
- 16.2.3.3. SWOT Analysis
- 16.2.3.4. Recent Developments
- 16.2.3.5. Financials (Based on Availability)
- 16.2.4 Miller's Honey
- 16.2.4.1. Overview
- 16.2.4.2. Products
- 16.2.4.3. SWOT Analysis
- 16.2.4.4. Recent Developments
- 16.2.4.5. Financials (Based on Availability)
- 16.2.5 EURL Atlantic Apiculture
- 16.2.5.1. Overview
- 16.2.5.2. Products
- 16.2.5.3. SWOT Analysis
- 16.2.5.4. Recent Developments
- 16.2.5.5. Financials (Based on Availability)
- 16.2.6 Arnold honey bee services
- 16.2.6.1. Overview
- 16.2.6.2. Products
- 16.2.6.3. SWOT Analysis
- 16.2.6.4. Recent Developments
- 16.2.6.5. Financials (Based on Availability)
- 16.2.7 Clearskys
- 16.2.7.1. Overview
- 16.2.7.2. Products
- 16.2.7.3. SWOT Analysis
- 16.2.7.4. Recent Developments
- 16.2.7.5. Financials (Based on Availability)
- 16.2.8 PhytoPharma International Ltd (Bee-Fuse Technology)*List Not Exhaustive
- 16.2.8.1. Overview
- 16.2.8.2. Products
- 16.2.8.3. SWOT Analysis
- 16.2.8.4. Recent Developments
- 16.2.8.5. Financials (Based on Availability)
- 16.2.9 Beehive Botanicals
- 16.2.9.1. Overview
- 16.2.9.2. Products
- 16.2.9.3. SWOT Analysis
- 16.2.9.4. Recent Developments
- 16.2.9.5. Financials (Based on Availability)
- 16.2.10 Pastili Limited
- 16.2.10.1. Overview
- 16.2.10.2. Products
- 16.2.10.3. SWOT Analysis
- 16.2.10.4. Recent Developments
- 16.2.10.5. Financials (Based on Availability)
- 16.2.1 Beeswax From Beekeepers
List of Figures
- Figure 1: Global Apiculture Market Revenue Breakdown (Million, %) by Region 2024 & 2032
- Figure 2: North America Apiculture Market Revenue (Million), by Country 2024 & 2032
- Figure 3: North America Apiculture Market Revenue Share (%), by Country 2024 & 2032
- Figure 4: Europe Apiculture Market Revenue (Million), by Country 2024 & 2032
- Figure 5: Europe Apiculture Market Revenue Share (%), by Country 2024 & 2032
- Figure 6: Asia Pacific Apiculture Market Revenue (Million), by Country 2024 & 2032
- Figure 7: Asia Pacific Apiculture Market Revenue Share (%), by Country 2024 & 2032
- Figure 8: South America Apiculture Market Revenue (Million), by Country 2024 & 2032
- Figure 9: South America Apiculture Market Revenue Share (%), by Country 2024 & 2032
- Figure 10: Middle East and Africa Apiculture Market Revenue (Million), by Country 2024 & 2032
- Figure 11: Middle East and Africa Apiculture Market Revenue Share (%), by Country 2024 & 2032
- Figure 12: North America Apiculture Market Revenue (Million), by Product Type 2024 & 2032
- Figure 13: North America Apiculture Market Revenue Share (%), by Product Type 2024 & 2032
- Figure 14: North America Apiculture Market Revenue (Million), by Application 2024 & 2032
- Figure 15: North America Apiculture Market Revenue Share (%), by Application 2024 & 2032
- Figure 16: North America Apiculture Market Revenue (Million), by Country 2024 & 2032
- Figure 17: North America Apiculture Market Revenue Share (%), by Country 2024 & 2032
- Figure 18: Europe Apiculture Market Revenue (Million), by Product Type 2024 & 2032
- Figure 19: Europe Apiculture Market Revenue Share (%), by Product Type 2024 & 2032
- Figure 20: Europe Apiculture Market Revenue (Million), by Application 2024 & 2032
- Figure 21: Europe Apiculture Market Revenue Share (%), by Application 2024 & 2032
- Figure 22: Europe Apiculture Market Revenue (Million), by Country 2024 & 2032
- Figure 23: Europe Apiculture Market Revenue Share (%), by Country 2024 & 2032
- Figure 24: Asia Pacific Apiculture Market Revenue (Million), by Product Type 2024 & 2032
- Figure 25: Asia Pacific Apiculture Market Revenue Share (%), by Product Type 2024 & 2032
- Figure 26: Asia Pacific Apiculture Market Revenue (Million), by Application 2024 & 2032
- Figure 27: Asia Pacific Apiculture Market Revenue Share (%), by Application 2024 & 2032
- Figure 28: Asia Pacific Apiculture Market Revenue (Million), by Country 2024 & 2032
- Figure 29: Asia Pacific Apiculture Market Revenue Share (%), by Country 2024 & 2032
- Figure 30: South America Apiculture Market Revenue (Million), by Product Type 2024 & 2032
- Figure 31: South America Apiculture Market Revenue Share (%), by Product Type 2024 & 2032
- Figure 32: South America Apiculture Market Revenue (Million), by Application 2024 & 2032
- Figure 33: South America Apiculture Market Revenue Share (%), by Application 2024 & 2032
- Figure 34: South America Apiculture Market Revenue (Million), by Country 2024 & 2032
- Figure 35: South America Apiculture Market Revenue Share (%), by Country 2024 & 2032
- Figure 36: Middle East and Africa Apiculture Market Revenue (Million), by Product Type 2024 & 2032
- Figure 37: Middle East and Africa Apiculture Market Revenue Share (%), by Product Type 2024 & 2032
- Figure 38: Middle East and Africa Apiculture Market Revenue (Million), by Application 2024 & 2032
- Figure 39: Middle East and Africa Apiculture Market Revenue Share (%), by Application 2024 & 2032
- Figure 40: Middle East and Africa Apiculture Market Revenue (Million), by Country 2024 & 2032
- Figure 41: Middle East and Africa Apiculture Market Revenue Share (%), by Country 2024 & 2032
List of Tables
- Table 1: Global Apiculture Market Revenue Million Forecast, by Region 2019 & 2032
- Table 2: Global Apiculture Market Revenue Million Forecast, by Product Type 2019 & 2032
- Table 3: Global Apiculture Market Revenue Million Forecast, by Application 2019 & 2032
- Table 4: Global Apiculture Market Revenue Million Forecast, by Region 2019 & 2032
- Table 5: Global Apiculture Market Revenue Million Forecast, by Country 2019 & 2032
- Table 6: United States Apiculture Market Revenue (Million) Forecast, by Application 2019 & 2032
- Table 7: Canada Apiculture Market Revenue (Million) Forecast, by Application 2019 & 2032
- Table 8: Mexico Apiculture Market Revenue (Million) Forecast, by Application 2019 & 2032
- Table 9: Rest of North America Apiculture Market Revenue (Million) Forecast, by Application 2019 & 2032
- Table 10: Global Apiculture Market Revenue Million Forecast, by Country 2019 & 2032
- Table 11: Germany Apiculture Market Revenue (Million) Forecast, by Application 2019 & 2032
- Table 12: United Kingdom Apiculture Market Revenue (Million) Forecast, by Application 2019 & 2032
- Table 13: France Apiculture Market Revenue (Million) Forecast, by Application 2019 & 2032
- Table 14: Russia Apiculture Market Revenue (Million) Forecast, by Application 2019 & 2032
- Table 15: Spain Apiculture Market Revenue (Million) Forecast, by Application 2019 & 2032
- Table 16: Rest of Europe Apiculture Market Revenue (Million) Forecast, by Application 2019 & 2032
- Table 17: Global Apiculture Market Revenue Million Forecast, by Country 2019 & 2032
- Table 18: China Apiculture Market Revenue (Million) Forecast, by Application 2019 & 2032
- Table 19: Japan Apiculture Market Revenue (Million) Forecast, by Application 2019 & 2032
- Table 20: India Apiculture Market Revenue (Million) Forecast, by Application 2019 & 2032
- Table 21: South Korea Apiculture Market Revenue (Million) Forecast, by Application 2019 & 2032
- Table 22: Rest of Asia Pacific Apiculture Market Revenue (Million) Forecast, by Application 2019 & 2032
- Table 23: Global Apiculture Market Revenue Million Forecast, by Country 2019 & 2032
- Table 24: Brazil Apiculture Market Revenue (Million) Forecast, by Application 2019 & 2032
- Table 25: Argentina Apiculture Market Revenue (Million) Forecast, by Application 2019 & 2032
- Table 26: Rest of South America Apiculture Market Revenue (Million) Forecast, by Application 2019 & 2032
- Table 27: Global Apiculture Market Revenue Million Forecast, by Country 2019 & 2032
- Table 28: United Arab Emirates Apiculture Market Revenue (Million) Forecast, by Application 2019 & 2032
- Table 29: South Africa Apiculture Market Revenue (Million) Forecast, by Application 2019 & 2032
- Table 30: Rest of Middle East and Africa Apiculture Market Revenue (Million) Forecast, by Application 2019 & 2032
- Table 31: Global Apiculture Market Revenue Million Forecast, by Product Type 2019 & 2032
- Table 32: Global Apiculture Market Revenue Million Forecast, by Application 2019 & 2032
- Table 33: Global Apiculture Market Revenue Million Forecast, by Country 2019 & 2032
- Table 34: United States Apiculture Market Revenue (Million) Forecast, by Application 2019 & 2032
- Table 35: Canada Apiculture Market Revenue (Million) Forecast, by Application 2019 & 2032
- Table 36: Mexico Apiculture Market Revenue (Million) Forecast, by Application 2019 & 2032
- Table 37: Rest of North America Apiculture Market Revenue (Million) Forecast, by Application 2019 & 2032
- Table 38: Global Apiculture Market Revenue Million Forecast, by Product Type 2019 & 2032
- Table 39: Global Apiculture Market Revenue Million Forecast, by Application 2019 & 2032
- Table 40: Global Apiculture Market Revenue Million Forecast, by Country 2019 & 2032
- Table 41: Germany Apiculture Market Revenue (Million) Forecast, by Application 2019 & 2032
- Table 42: United Kingdom Apiculture Market Revenue (Million) Forecast, by Application 2019 & 2032
- Table 43: France Apiculture Market Revenue (Million) Forecast, by Application 2019 & 2032
- Table 44: Russia Apiculture Market Revenue (Million) Forecast, by Application 2019 & 2032
- Table 45: Spain Apiculture Market Revenue (Million) Forecast, by Application 2019 & 2032
- Table 46: Rest of Europe Apiculture Market Revenue (Million) Forecast, by Application 2019 & 2032
- Table 47: Global Apiculture Market Revenue Million Forecast, by Product Type 2019 & 2032
- Table 48: Global Apiculture Market Revenue Million Forecast, by Application 2019 & 2032
- Table 49: Global Apiculture Market Revenue Million Forecast, by Country 2019 & 2032
- Table 50: China Apiculture Market Revenue (Million) Forecast, by Application 2019 & 2032
- Table 51: Japan Apiculture Market Revenue (Million) Forecast, by Application 2019 & 2032
- Table 52: India Apiculture Market Revenue (Million) Forecast, by Application 2019 & 2032
- Table 53: South Korea Apiculture Market Revenue (Million) Forecast, by Application 2019 & 2032
- Table 54: Rest of Asia Pacific Apiculture Market Revenue (Million) Forecast, by Application 2019 & 2032
- Table 55: Global Apiculture Market Revenue Million Forecast, by Product Type 2019 & 2032
- Table 56: Global Apiculture Market Revenue Million Forecast, by Application 2019 & 2032
- Table 57: Global Apiculture Market Revenue Million Forecast, by Country 2019 & 2032
- Table 58: Brazil Apiculture Market Revenue (Million) Forecast, by Application 2019 & 2032
- Table 59: Argentina Apiculture Market Revenue (Million) Forecast, by Application 2019 & 2032
- Table 60: Rest of South America Apiculture Market Revenue (Million) Forecast, by Application 2019 & 2032
- Table 61: Global Apiculture Market Revenue Million Forecast, by Product Type 2019 & 2032
- Table 62: Global Apiculture Market Revenue Million Forecast, by Application 2019 & 2032
- Table 63: Global Apiculture Market Revenue Million Forecast, by Country 2019 & 2032
- Table 64: United Arab Emirates Apiculture Market Revenue (Million) Forecast, by Application 2019 & 2032
- Table 65: South Africa Apiculture Market Revenue (Million) Forecast, by Application 2019 & 2032
- Table 66: Rest of Middle East and Africa Apiculture Market Revenue (Million) Forecast, by Application 2019 & 2032
Frequently Asked Questions
1. What is the projected Compound Annual Growth Rate (CAGR) of the Apiculture Market?
The projected CAGR is approximately 4.30%.
2. Which companies are prominent players in the Apiculture Market?
Key companies in the market include Beeswax From Beekeepers, Betterbee, Bartnik LLC, Miller's Honey, EURL Atlantic Apiculture, Arnold honey bee services, Clearskys, PhytoPharma International Ltd (Bee-Fuse Technology)*List Not Exhaustive, Beehive Botanicals, Pastili Limited.
3. What are the main segments of the Apiculture Market?
The market segments include Product Type, Application.
4. Can you provide details about the market size?
The market size is estimated to be USD XX Million as of 2022.
5. What are some drivers contributing to market growth?
Rising Trend of Ingestible Beauty Products; Growing demand for Nutrient-Enriched Cosmetic Products.
6. What are the notable trends driving market growth?
Honey Emerges As a Functional Sweetener.
7. Are there any restraints impacting market growth?
Availability of Counterfeit Beauty Supplements Products.
8. Can you provide examples of recent developments in the market?
January 2022: Nature Nate's merged with Cannon Falls, Minnesota-based Sweet Harvest Foods, an independent private equity business that invests in supply chain and agricultural production enterprises on a controlling basis.
9. What pricing options are available for accessing the report?
Pricing options include single-user, multi-user, and enterprise licenses priced at USD 4750, USD 5250, and USD 8750 respectively.
10. Is the market size provided in terms of value or volume?
The market size is provided in terms of value, measured in Million.
11. Are there any specific market keywords associated with the report?
Yes, the market keyword associated with the report is "Apiculture Market," which aids in identifying and referencing the specific market segment covered.
12. How do I determine which pricing option suits my needs best?
The pricing options vary based on user requirements and access needs. Individual users may opt for single-user licenses, while businesses requiring broader access may choose multi-user or enterprise licenses for cost-effective access to the report.
13. Are there any additional resources or data provided in the Apiculture Market report?
While the report offers comprehensive insights, it's advisable to review the specific contents or supplementary materials provided to ascertain if additional resources or data are available.
14. How can I stay updated on further developments or reports in the Apiculture Market?
To stay informed about further developments, trends, and reports in the Apiculture Market, consider subscribing to industry newsletters, following relevant companies and organizations, or regularly checking reputable industry news sources and publications.
Methodology
Step 1 - Identification of Relevant Samples Size from Population Database


Step 2 - Approaches for Defining Global Market Size (Value, Volume* & Price*)

Note*: In applicable scenarios
Step 3 - Data Sources
Primary Research
- Web Analytics
- Survey Reports
- Research Institute
- Latest Research Reports
- Opinion Leaders
Secondary Research
- Annual Reports
- White Paper
- Latest Press Release
- Industry Association
- Paid Database
- Investor Presentations

Step 4 - Data Triangulation
Involves using different sources of information in order to increase the validity of a study
These sources are likely to be stakeholders in a program - participants, other researchers, program staff, other community members, and so on.
Then we put all data in single framework & apply various statistical tools to find out the dynamic on the market.
During the analysis stage, feedback from the stakeholder groups would be compared to determine areas of agreement as well as areas of divergence


