
Key Insights
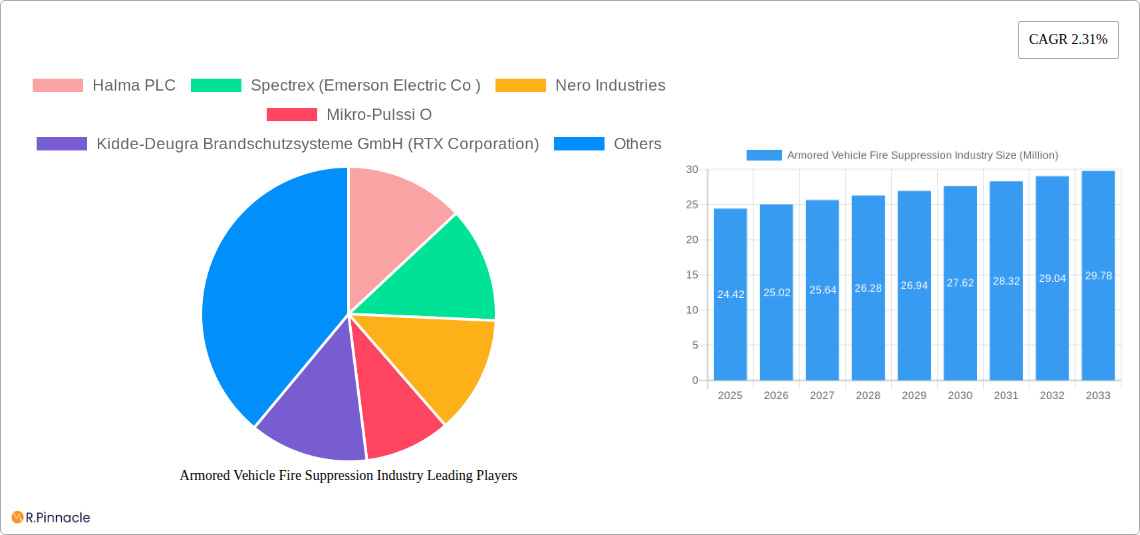
The global Armored Vehicle Fire Suppression Systems market, valued at $24.42 million in 2025, is projected to experience steady growth, driven by increasing demand for enhanced safety features in military and defense vehicles. The Compound Annual Growth Rate (CAGR) of 2.31% from 2019-2033 indicates a consistent, albeit moderate, expansion. This growth is fueled by several factors. Firstly, the rising adoption of advanced fire suppression technologies, such as those using clean agents like inert gases, is gaining traction due to their environmental friendliness and effectiveness. Secondly, stringent government regulations regarding fire safety in armored vehicles are pushing manufacturers to integrate robust fire suppression systems. Finally, the increasing modernization and technological advancements within the military and defense sectors are driving demand for technologically sophisticated systems. The market is segmented by vehicle type, with combat vehicles and troop transport vehicles comprising the largest shares. North America, particularly the United States, is expected to dominate the market due to its strong military presence and substantial investments in defense technology. However, other regions like Asia-Pacific are projected to witness significant growth driven by rising defense budgets and increasing procurement of armored vehicles. Market restraints include the relatively high cost of advanced suppression systems and potential supply chain challenges impacting the availability of key components.
The competitive landscape is characterized by a mix of established players and specialized smaller companies. Major players like Halma PLC, Emerson Electric Co. (through Spectrex), and RTX Corporation (through Kidde-Deugra) leverage their expertise in fire safety technology and extensive distribution networks to maintain market share. However, innovative startups and specialized firms focusing on niche technologies are also contributing to the market's dynamism. Future growth will hinge on continuous technological advancements, collaborations between system integrators and vehicle manufacturers, and strategic investments in research and development to meet evolving safety standards and customer demands. The forecast period (2025-2033) presents significant opportunities for both established and emerging players to capitalize on this growing market, particularly through the development of lighter, more effective, and environmentally conscious fire suppression solutions for the next generation of armored vehicles.
Armored Vehicle Fire Suppression Industry: A Comprehensive Market Report (2019-2033)
This comprehensive report provides an in-depth analysis of the Armored Vehicle Fire Suppression industry, offering actionable insights for industry professionals, investors, and strategists. The report covers the period 2019-2033, with a base year of 2025 and a forecast period of 2025-2033. The market is segmented by vehicle type, including combat vehicles, troop transport vehicles, and other vehicle types. Key players such as Halma PLC, Spectrex (Emerson Electric Co), and others are analyzed for their market share and strategic initiatives. The report projects a market valued at xx Million by 2033, presenting a compelling opportunity for growth and innovation.
Armored Vehicle Fire Suppression Industry Market Structure & Innovation Trends
The Armored Vehicle Fire Suppression market exhibits a moderately concentrated structure, with a few major players holding significant market share. Halma PLC, Spectrex (Emerson Electric Co), and Kidde-Deugra Brandschutzsysteme GmbH (RTX Corporation) are among the key players, collectively accounting for an estimated xx% of the global market share in 2025. Innovation is driven by the need for enhanced fire suppression efficiency, reduced system weight, and integration with advanced vehicle systems. Stringent safety regulations across various geographies significantly influence product development and adoption. Product substitutes are limited, primarily focused on alternative fire suppression agents. The end-user demographic comprises primarily military and defense organizations, with increasing demand from law enforcement and specialized civilian applications. M&A activity has been moderate, with deal values in the xx Million range over the historical period, primarily focused on expanding product portfolios and geographic reach. For example, a recent acquisition (if available, specify with year and companies) impacted the market by…
Armored Vehicle Fire Suppression Industry Market Dynamics & Trends
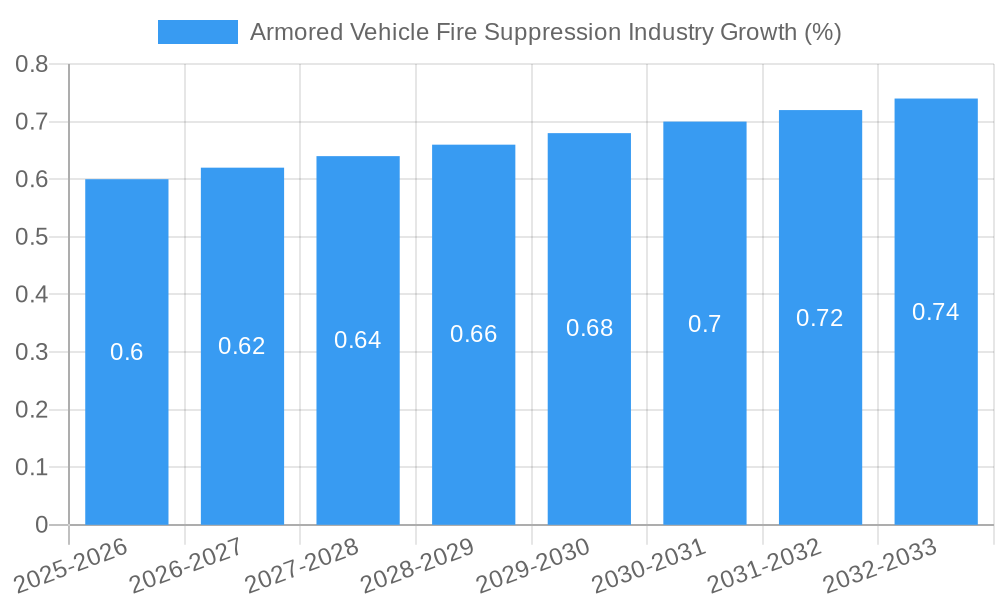
The global Armored Vehicle Fire Suppression market is projected to witness a CAGR of xx% during the forecast period (2025-2033), driven by several factors. Increasing defense budgets globally, modernization of armored vehicle fleets, and rising demand for enhanced safety features are key growth drivers. Technological advancements, such as the development of more efficient and environmentally friendly suppression agents, are further fueling market expansion. Market penetration is relatively high in developed nations, with significant growth potential in emerging economies. The competitive landscape is characterized by both intense rivalry among established players and the emergence of innovative startups offering specialized solutions. Consumer preferences are shifting towards lighter, more efficient, and environmentally friendly systems. Technological disruptions, such as the adoption of autonomous and electric armored vehicles, are creating both opportunities and challenges for the industry.
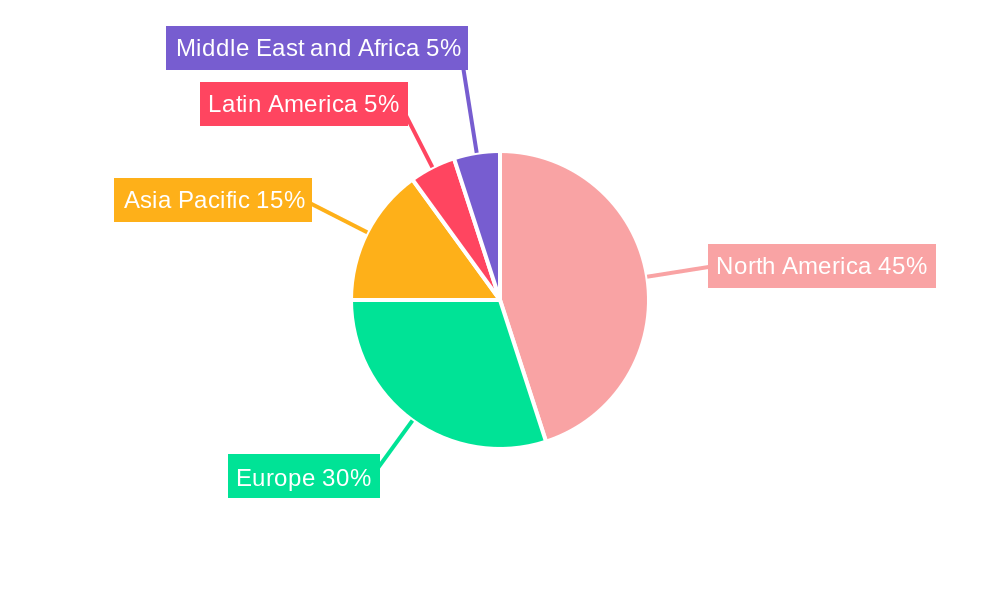
Dominant Regions & Segments in Armored Vehicle Fire Suppression Industry
The North American market currently dominates the Armored Vehicle Fire Suppression industry, accounting for approximately xx% of the global market share in 2025. This dominance stems from robust defense spending, a large fleet of armored vehicles, and a well-established technological base.
Key Drivers in North America:
- High defense expenditure and modernization programs.
- Strong technological capabilities and innovation ecosystem.
- Stringent safety regulations driving product adoption.
Dominant Vehicle Segment: Combat vehicles represent the largest segment within the Armored Vehicle Fire Suppression market. The high value of combat vehicles and their crucial role in military operations necessitate advanced fire suppression systems. The troop transport vehicle segment is also experiencing significant growth, driven by the increasing importance of troop safety and protection.
Detailed analysis reveals that the other vehicle types segment, while smaller than combat and troop transport vehicles, still displays robust growth potential due to an increasing range of specialized applications including law enforcement and civilian security. Further details on regional and segmental growth trajectories are elaborated within the full report.
Armored Vehicle Fire Suppression Industry Product Innovations
Recent product innovations include the development of lighter-weight fire suppression systems, improved agent delivery mechanisms, and enhanced integration with vehicle control systems. These advancements aim to minimize system weight, improve fire suppression efficiency, and enhance overall vehicle performance and safety. The market is witnessing a trend towards environmentally friendly and less toxic suppression agents, aligning with global sustainability initiatives. These technological advancements are improving market fit and driving competitive advantage.
Report Scope & Segmentation Analysis
This report comprehensively segments the Armored Vehicle Fire Suppression market by vehicle type:
Combat Vehicles: This segment encompasses fire suppression systems designed for tanks, armored personnel carriers, and other combat vehicles. Market size in 2025 is estimated at xx Million, projected to reach xx Million by 2033, driven by modernization efforts and procurement programs. Competition is high, with established players focusing on differentiation through technological advancements.
Troop Transport Vehicles: This segment covers fire suppression systems for vehicles primarily designed for transporting personnel. The 2025 market size is estimated at xx Million, projected to reach xx Million by 2033. Growth is driven by increased focus on troop safety and comfort. Competitive dynamics are moderate, with several players vying for market share.
Other Vehicle Types: This includes specialized armored vehicles used for law enforcement, security, and other applications. This segment is smaller than the others, but has significant growth potential. The 2025 market size is estimated at xx Million, projected to reach xx Million by 2033.
Key Drivers of Armored Vehicle Fire Suppression Industry Growth
Several factors propel the Armored Vehicle Fire Suppression market's growth. Firstly, escalating global defense spending fuels demand for advanced fire suppression systems in modernized armored vehicle fleets. Secondly, stringent safety regulations necessitate improved fire safety standards across diverse vehicle types. Thirdly, continuous technological advancements, including the adoption of lighter and more efficient suppression agents, drive market expansion.
Challenges in the Armored Vehicle Fire Suppression Industry Sector
The industry faces challenges including fluctuating defense budgets, which can impact procurement decisions. Supply chain disruptions and the availability of critical components may hinder production and timely delivery. The competitive landscape, with both established and emerging players, intensifies the pressure to innovate and maintain cost competitiveness. Regulatory compliance requirements add complexity to product development and market entry.
Emerging Opportunities in Armored Vehicle Fire Suppression Industry
The rising adoption of autonomous and electric armored vehicles presents lucrative opportunities. Further, expansion into emerging markets with increasing demand for security and defense solutions holds significant potential. Developing specialized fire suppression systems for niche applications, such as specialized rescue vehicles and unmanned ground vehicles, also opens doors for growth.
Leading Players in the Armored Vehicle Fire Suppression Industry Market
- Halma PLC
- Spectrex (Emerson Electric Co)
- Nero Industries
- Mikro-Pulssi O
- Kidde-Deugra Brandschutzsysteme GmbH (RTX Corporation)
- N2 Towers Inc
- Bulldog Direct Protective Systems Inc
- ExploSpot Systems (Pty) Ltd
- Fire Protection Technologies Pty Ltd
- Marotta Controls Inc
Key Developments in Armored Vehicle Fire Suppression Industry Industry
- 2022 Q3: Halma PLC announced a new lightweight fire suppression system for combat vehicles.
- 2023 Q1: Spectrex released an improved agent designed to minimize environmental impact.
- (Add other key developments with dates)
Future Outlook for Armored Vehicle Fire Suppression Industry Market
The Armored Vehicle Fire Suppression market is poised for sustained growth, driven by ongoing technological advancements, increasing defense spending, and the need for enhanced safety standards. Strategic partnerships, focused innovation, and expansion into emerging markets present key opportunities for market participants. The market is expected to witness a consolidation trend, with larger players acquiring smaller companies to expand their product portfolios and global reach.
Armored Vehicle Fire Suppression Industry Segmentation
-
1. Vehicle Type
- 1.1. Combat Vehicles
- 1.2. Troop Transport Vehicles
- 1.3. Other Vehicle Types
Armored Vehicle Fire Suppression Industry Segmentation By Geography
-
1. North America
- 1.1. United States
- 1.2. Canada
-
2. Europe
- 2.1. United Kingdom
- 2.2. Germany
- 2.3. France
- 2.4. Russia
- 2.5. Rest of Europe
-
3. Asia Pacific
- 3.1. China
- 3.2. India
- 3.3. Japan
- 3.4. South Korea
- 3.5. Rest of Asia Pacific
-
4. Latin America
- 4.1. Brazil
- 4.2. Rest of Latin America
-
5. Middle East and Africa
- 5.1. United Arab Emirates
- 5.2. Saudi Arabia
- 5.3. Turkey
- 5.4. Egypt
- 5.5. Rest of Middle East and Africa
Armored Vehicle Fire Suppression Industry REPORT HIGHLIGHTS
| Aspects | Details |
|---|---|
| Study Period | 2019-2033 |
| Base Year | 2024 |
| Estimated Year | 2025 |
| Forecast Period | 2025-2033 |
| Historical Period | 2019-2024 |
| Growth Rate | CAGR of 2.31% from 2019-2033 |
| Segmentation |
|
Table of Contents
- 1. Introduction
- 1.1. Research Scope
- 1.2. Market Segmentation
- 1.3. Research Methodology
- 1.4. Definitions and Assumptions
- 2. Executive Summary
- 2.1. Introduction
- 3. Market Dynamics
- 3.1. Introduction
- 3.2. Market Drivers
- 3.3. Market Restrains
- 3.4. Market Trends
- 3.4.1. Combat Vehicles to Witness Highest Growth During the Forecast Period
- 4. Market Factor Analysis
- 4.1. Porters Five Forces
- 4.2. Supply/Value Chain
- 4.3. PESTEL analysis
- 4.4. Market Entropy
- 4.5. Patent/Trademark Analysis
- 5. Global Armored Vehicle Fire Suppression Industry Analysis, Insights and Forecast, 2019-2031
- 5.1. Market Analysis, Insights and Forecast - by Vehicle Type
- 5.1.1. Combat Vehicles
- 5.1.2. Troop Transport Vehicles
- 5.1.3. Other Vehicle Types
- 5.2. Market Analysis, Insights and Forecast - by Region
- 5.2.1. North America
- 5.2.2. Europe
- 5.2.3. Asia Pacific
- 5.2.4. Latin America
- 5.2.5. Middle East and Africa
- 5.1. Market Analysis, Insights and Forecast - by Vehicle Type
- 6. North America Armored Vehicle Fire Suppression Industry Analysis, Insights and Forecast, 2019-2031
- 6.1. Market Analysis, Insights and Forecast - by Vehicle Type
- 6.1.1. Combat Vehicles
- 6.1.2. Troop Transport Vehicles
- 6.1.3. Other Vehicle Types
- 6.1. Market Analysis, Insights and Forecast - by Vehicle Type
- 7. Europe Armored Vehicle Fire Suppression Industry Analysis, Insights and Forecast, 2019-2031
- 7.1. Market Analysis, Insights and Forecast - by Vehicle Type
- 7.1.1. Combat Vehicles
- 7.1.2. Troop Transport Vehicles
- 7.1.3. Other Vehicle Types
- 7.1. Market Analysis, Insights and Forecast - by Vehicle Type
- 8. Asia Pacific Armored Vehicle Fire Suppression Industry Analysis, Insights and Forecast, 2019-2031
- 8.1. Market Analysis, Insights and Forecast - by Vehicle Type
- 8.1.1. Combat Vehicles
- 8.1.2. Troop Transport Vehicles
- 8.1.3. Other Vehicle Types
- 8.1. Market Analysis, Insights and Forecast - by Vehicle Type
- 9. Latin America Armored Vehicle Fire Suppression Industry Analysis, Insights and Forecast, 2019-2031
- 9.1. Market Analysis, Insights and Forecast - by Vehicle Type
- 9.1.1. Combat Vehicles
- 9.1.2. Troop Transport Vehicles
- 9.1.3. Other Vehicle Types
- 9.1. Market Analysis, Insights and Forecast - by Vehicle Type
- 10. Middle East and Africa Armored Vehicle Fire Suppression Industry Analysis, Insights and Forecast, 2019-2031
- 10.1. Market Analysis, Insights and Forecast - by Vehicle Type
- 10.1.1. Combat Vehicles
- 10.1.2. Troop Transport Vehicles
- 10.1.3. Other Vehicle Types
- 10.1. Market Analysis, Insights and Forecast - by Vehicle Type
- 11. North America Armored Vehicle Fire Suppression Industry Analysis, Insights and Forecast, 2019-2031
- 11.1. Market Analysis, Insights and Forecast - By Country/Sub-region
- 11.1.1 United States
- 11.1.2 Canada
- 12. Europe Armored Vehicle Fire Suppression Industry Analysis, Insights and Forecast, 2019-2031
- 12.1. Market Analysis, Insights and Forecast - By Country/Sub-region
- 12.1.1 United Kingdom
- 12.1.2 Germany
- 12.1.3 France
- 12.1.4 Russia
- 12.1.5 Rest of Europe
- 13. Asia Pacific Armored Vehicle Fire Suppression Industry Analysis, Insights and Forecast, 2019-2031
- 13.1. Market Analysis, Insights and Forecast - By Country/Sub-region
- 13.1.1 China
- 13.1.2 India
- 13.1.3 Japan
- 13.1.4 South Korea
- 13.1.5 Rest of Asia Pacific
- 14. Latin America Armored Vehicle Fire Suppression Industry Analysis, Insights and Forecast, 2019-2031
- 14.1. Market Analysis, Insights and Forecast - By Country/Sub-region
- 14.1.1 Brazil
- 14.1.2 Rest of Latin America
- 15. Middle East and Africa Armored Vehicle Fire Suppression Industry Analysis, Insights and Forecast, 2019-2031
- 15.1. Market Analysis, Insights and Forecast - By Country/Sub-region
- 15.1.1 United Arab Emirates
- 15.1.2 Saudi Arabia
- 15.1.3 Turkey
- 15.1.4 Egypt
- 15.1.5 Rest of Middle East and Africa
- 16. Competitive Analysis
- 16.1. Global Market Share Analysis 2024
- 16.2. Company Profiles
- 16.2.1 Halma PLC
- 16.2.1.1. Overview
- 16.2.1.2. Products
- 16.2.1.3. SWOT Analysis
- 16.2.1.4. Recent Developments
- 16.2.1.5. Financials (Based on Availability)
- 16.2.2 Spectrex (Emerson Electric Co )
- 16.2.2.1. Overview
- 16.2.2.2. Products
- 16.2.2.3. SWOT Analysis
- 16.2.2.4. Recent Developments
- 16.2.2.5. Financials (Based on Availability)
- 16.2.3 Nero Industries
- 16.2.3.1. Overview
- 16.2.3.2. Products
- 16.2.3.3. SWOT Analysis
- 16.2.3.4. Recent Developments
- 16.2.3.5. Financials (Based on Availability)
- 16.2.4 Mikro-Pulssi O
- 16.2.4.1. Overview
- 16.2.4.2. Products
- 16.2.4.3. SWOT Analysis
- 16.2.4.4. Recent Developments
- 16.2.4.5. Financials (Based on Availability)
- 16.2.5 Kidde-Deugra Brandschutzsysteme GmbH (RTX Corporation)
- 16.2.5.1. Overview
- 16.2.5.2. Products
- 16.2.5.3. SWOT Analysis
- 16.2.5.4. Recent Developments
- 16.2.5.5. Financials (Based on Availability)
- 16.2.6 N2 Towers Inc
- 16.2.6.1. Overview
- 16.2.6.2. Products
- 16.2.6.3. SWOT Analysis
- 16.2.6.4. Recent Developments
- 16.2.6.5. Financials (Based on Availability)
- 16.2.7 Bulldog Direct Protective Systems Inc
- 16.2.7.1. Overview
- 16.2.7.2. Products
- 16.2.7.3. SWOT Analysis
- 16.2.7.4. Recent Developments
- 16.2.7.5. Financials (Based on Availability)
- 16.2.8 ExploSpot Systems (Pty) Ltd
- 16.2.8.1. Overview
- 16.2.8.2. Products
- 16.2.8.3. SWOT Analysis
- 16.2.8.4. Recent Developments
- 16.2.8.5. Financials (Based on Availability)
- 16.2.9 Fire Protection Technologies Pty Ltd
- 16.2.9.1. Overview
- 16.2.9.2. Products
- 16.2.9.3. SWOT Analysis
- 16.2.9.4. Recent Developments
- 16.2.9.5. Financials (Based on Availability)
- 16.2.10 Marotta Controls Inc
- 16.2.10.1. Overview
- 16.2.10.2. Products
- 16.2.10.3. SWOT Analysis
- 16.2.10.4. Recent Developments
- 16.2.10.5. Financials (Based on Availability)
- 16.2.1 Halma PLC
List of Figures
- Figure 1: Global Armored Vehicle Fire Suppression Industry Revenue Breakdown (Million, %) by Region 2024 & 2032
- Figure 2: North America Armored Vehicle Fire Suppression Industry Revenue (Million), by Country 2024 & 2032
- Figure 3: North America Armored Vehicle Fire Suppression Industry Revenue Share (%), by Country 2024 & 2032
- Figure 4: Europe Armored Vehicle Fire Suppression Industry Revenue (Million), by Country 2024 & 2032
- Figure 5: Europe Armored Vehicle Fire Suppression Industry Revenue Share (%), by Country 2024 & 2032
- Figure 6: Asia Pacific Armored Vehicle Fire Suppression Industry Revenue (Million), by Country 2024 & 2032
- Figure 7: Asia Pacific Armored Vehicle Fire Suppression Industry Revenue Share (%), by Country 2024 & 2032
- Figure 8: Latin America Armored Vehicle Fire Suppression Industry Revenue (Million), by Country 2024 & 2032
- Figure 9: Latin America Armored Vehicle Fire Suppression Industry Revenue Share (%), by Country 2024 & 2032
- Figure 10: Middle East and Africa Armored Vehicle Fire Suppression Industry Revenue (Million), by Country 2024 & 2032
- Figure 11: Middle East and Africa Armored Vehicle Fire Suppression Industry Revenue Share (%), by Country 2024 & 2032
- Figure 12: North America Armored Vehicle Fire Suppression Industry Revenue (Million), by Vehicle Type 2024 & 2032
- Figure 13: North America Armored Vehicle Fire Suppression Industry Revenue Share (%), by Vehicle Type 2024 & 2032
- Figure 14: North America Armored Vehicle Fire Suppression Industry Revenue (Million), by Country 2024 & 2032
- Figure 15: North America Armored Vehicle Fire Suppression Industry Revenue Share (%), by Country 2024 & 2032
- Figure 16: Europe Armored Vehicle Fire Suppression Industry Revenue (Million), by Vehicle Type 2024 & 2032
- Figure 17: Europe Armored Vehicle Fire Suppression Industry Revenue Share (%), by Vehicle Type 2024 & 2032
- Figure 18: Europe Armored Vehicle Fire Suppression Industry Revenue (Million), by Country 2024 & 2032
- Figure 19: Europe Armored Vehicle Fire Suppression Industry Revenue Share (%), by Country 2024 & 2032
- Figure 20: Asia Pacific Armored Vehicle Fire Suppression Industry Revenue (Million), by Vehicle Type 2024 & 2032
- Figure 21: Asia Pacific Armored Vehicle Fire Suppression Industry Revenue Share (%), by Vehicle Type 2024 & 2032
- Figure 22: Asia Pacific Armored Vehicle Fire Suppression Industry Revenue (Million), by Country 2024 & 2032
- Figure 23: Asia Pacific Armored Vehicle Fire Suppression Industry Revenue Share (%), by Country 2024 & 2032
- Figure 24: Latin America Armored Vehicle Fire Suppression Industry Revenue (Million), by Vehicle Type 2024 & 2032
- Figure 25: Latin America Armored Vehicle Fire Suppression Industry Revenue Share (%), by Vehicle Type 2024 & 2032
- Figure 26: Latin America Armored Vehicle Fire Suppression Industry Revenue (Million), by Country 2024 & 2032
- Figure 27: Latin America Armored Vehicle Fire Suppression Industry Revenue Share (%), by Country 2024 & 2032
- Figure 28: Middle East and Africa Armored Vehicle Fire Suppression Industry Revenue (Million), by Vehicle Type 2024 & 2032
- Figure 29: Middle East and Africa Armored Vehicle Fire Suppression Industry Revenue Share (%), by Vehicle Type 2024 & 2032
- Figure 30: Middle East and Africa Armored Vehicle Fire Suppression Industry Revenue (Million), by Country 2024 & 2032
- Figure 31: Middle East and Africa Armored Vehicle Fire Suppression Industry Revenue Share (%), by Country 2024 & 2032
List of Tables
- Table 1: Global Armored Vehicle Fire Suppression Industry Revenue Million Forecast, by Region 2019 & 2032
- Table 2: Global Armored Vehicle Fire Suppression Industry Revenue Million Forecast, by Vehicle Type 2019 & 2032
- Table 3: Global Armored Vehicle Fire Suppression Industry Revenue Million Forecast, by Region 2019 & 2032
- Table 4: Global Armored Vehicle Fire Suppression Industry Revenue Million Forecast, by Country 2019 & 2032
- Table 5: United States Armored Vehicle Fire Suppression Industry Revenue (Million) Forecast, by Application 2019 & 2032
- Table 6: Canada Armored Vehicle Fire Suppression Industry Revenue (Million) Forecast, by Application 2019 & 2032
- Table 7: Global Armored Vehicle Fire Suppression Industry Revenue Million Forecast, by Country 2019 & 2032
- Table 8: United Kingdom Armored Vehicle Fire Suppression Industry Revenue (Million) Forecast, by Application 2019 & 2032
- Table 9: Germany Armored Vehicle Fire Suppression Industry Revenue (Million) Forecast, by Application 2019 & 2032
- Table 10: France Armored Vehicle Fire Suppression Industry Revenue (Million) Forecast, by Application 2019 & 2032
- Table 11: Russia Armored Vehicle Fire Suppression Industry Revenue (Million) Forecast, by Application 2019 & 2032
- Table 12: Rest of Europe Armored Vehicle Fire Suppression Industry Revenue (Million) Forecast, by Application 2019 & 2032
- Table 13: Global Armored Vehicle Fire Suppression Industry Revenue Million Forecast, by Country 2019 & 2032
- Table 14: China Armored Vehicle Fire Suppression Industry Revenue (Million) Forecast, by Application 2019 & 2032
- Table 15: India Armored Vehicle Fire Suppression Industry Revenue (Million) Forecast, by Application 2019 & 2032
- Table 16: Japan Armored Vehicle Fire Suppression Industry Revenue (Million) Forecast, by Application 2019 & 2032
- Table 17: South Korea Armored Vehicle Fire Suppression Industry Revenue (Million) Forecast, by Application 2019 & 2032
- Table 18: Rest of Asia Pacific Armored Vehicle Fire Suppression Industry Revenue (Million) Forecast, by Application 2019 & 2032
- Table 19: Global Armored Vehicle Fire Suppression Industry Revenue Million Forecast, by Country 2019 & 2032
- Table 20: Brazil Armored Vehicle Fire Suppression Industry Revenue (Million) Forecast, by Application 2019 & 2032
- Table 21: Rest of Latin America Armored Vehicle Fire Suppression Industry Revenue (Million) Forecast, by Application 2019 & 2032
- Table 22: Global Armored Vehicle Fire Suppression Industry Revenue Million Forecast, by Country 2019 & 2032
- Table 23: United Arab Emirates Armored Vehicle Fire Suppression Industry Revenue (Million) Forecast, by Application 2019 & 2032
- Table 24: Saudi Arabia Armored Vehicle Fire Suppression Industry Revenue (Million) Forecast, by Application 2019 & 2032
- Table 25: Turkey Armored Vehicle Fire Suppression Industry Revenue (Million) Forecast, by Application 2019 & 2032
- Table 26: Egypt Armored Vehicle Fire Suppression Industry Revenue (Million) Forecast, by Application 2019 & 2032
- Table 27: Rest of Middle East and Africa Armored Vehicle Fire Suppression Industry Revenue (Million) Forecast, by Application 2019 & 2032
- Table 28: Global Armored Vehicle Fire Suppression Industry Revenue Million Forecast, by Vehicle Type 2019 & 2032
- Table 29: Global Armored Vehicle Fire Suppression Industry Revenue Million Forecast, by Country 2019 & 2032
- Table 30: United States Armored Vehicle Fire Suppression Industry Revenue (Million) Forecast, by Application 2019 & 2032
- Table 31: Canada Armored Vehicle Fire Suppression Industry Revenue (Million) Forecast, by Application 2019 & 2032
- Table 32: Global Armored Vehicle Fire Suppression Industry Revenue Million Forecast, by Vehicle Type 2019 & 2032
- Table 33: Global Armored Vehicle Fire Suppression Industry Revenue Million Forecast, by Country 2019 & 2032
- Table 34: United Kingdom Armored Vehicle Fire Suppression Industry Revenue (Million) Forecast, by Application 2019 & 2032
- Table 35: Germany Armored Vehicle Fire Suppression Industry Revenue (Million) Forecast, by Application 2019 & 2032
- Table 36: France Armored Vehicle Fire Suppression Industry Revenue (Million) Forecast, by Application 2019 & 2032
- Table 37: Russia Armored Vehicle Fire Suppression Industry Revenue (Million) Forecast, by Application 2019 & 2032
- Table 38: Rest of Europe Armored Vehicle Fire Suppression Industry Revenue (Million) Forecast, by Application 2019 & 2032
- Table 39: Global Armored Vehicle Fire Suppression Industry Revenue Million Forecast, by Vehicle Type 2019 & 2032
- Table 40: Global Armored Vehicle Fire Suppression Industry Revenue Million Forecast, by Country 2019 & 2032
- Table 41: China Armored Vehicle Fire Suppression Industry Revenue (Million) Forecast, by Application 2019 & 2032
- Table 42: India Armored Vehicle Fire Suppression Industry Revenue (Million) Forecast, by Application 2019 & 2032
- Table 43: Japan Armored Vehicle Fire Suppression Industry Revenue (Million) Forecast, by Application 2019 & 2032
- Table 44: South Korea Armored Vehicle Fire Suppression Industry Revenue (Million) Forecast, by Application 2019 & 2032
- Table 45: Rest of Asia Pacific Armored Vehicle Fire Suppression Industry Revenue (Million) Forecast, by Application 2019 & 2032
- Table 46: Global Armored Vehicle Fire Suppression Industry Revenue Million Forecast, by Vehicle Type 2019 & 2032
- Table 47: Global Armored Vehicle Fire Suppression Industry Revenue Million Forecast, by Country 2019 & 2032
- Table 48: Brazil Armored Vehicle Fire Suppression Industry Revenue (Million) Forecast, by Application 2019 & 2032
- Table 49: Rest of Latin America Armored Vehicle Fire Suppression Industry Revenue (Million) Forecast, by Application 2019 & 2032
- Table 50: Global Armored Vehicle Fire Suppression Industry Revenue Million Forecast, by Vehicle Type 2019 & 2032
- Table 51: Global Armored Vehicle Fire Suppression Industry Revenue Million Forecast, by Country 2019 & 2032
- Table 52: United Arab Emirates Armored Vehicle Fire Suppression Industry Revenue (Million) Forecast, by Application 2019 & 2032
- Table 53: Saudi Arabia Armored Vehicle Fire Suppression Industry Revenue (Million) Forecast, by Application 2019 & 2032
- Table 54: Turkey Armored Vehicle Fire Suppression Industry Revenue (Million) Forecast, by Application 2019 & 2032
- Table 55: Egypt Armored Vehicle Fire Suppression Industry Revenue (Million) Forecast, by Application 2019 & 2032
- Table 56: Rest of Middle East and Africa Armored Vehicle Fire Suppression Industry Revenue (Million) Forecast, by Application 2019 & 2032
Frequently Asked Questions
1. What is the projected Compound Annual Growth Rate (CAGR) of the Armored Vehicle Fire Suppression Industry?
The projected CAGR is approximately 2.31%.
2. Which companies are prominent players in the Armored Vehicle Fire Suppression Industry?
Key companies in the market include Halma PLC, Spectrex (Emerson Electric Co ), Nero Industries, Mikro-Pulssi O, Kidde-Deugra Brandschutzsysteme GmbH (RTX Corporation), N2 Towers Inc, Bulldog Direct Protective Systems Inc, ExploSpot Systems (Pty) Ltd, Fire Protection Technologies Pty Ltd, Marotta Controls Inc.
3. What are the main segments of the Armored Vehicle Fire Suppression Industry?
The market segments include Vehicle Type.
4. Can you provide details about the market size?
The market size is estimated to be USD 24.42 Million as of 2022.
5. What are some drivers contributing to market growth?
N/A
6. What are the notable trends driving market growth?
Combat Vehicles to Witness Highest Growth During the Forecast Period.
7. Are there any restraints impacting market growth?
N/A
8. Can you provide examples of recent developments in the market?
N/A
9. What pricing options are available for accessing the report?
Pricing options include single-user, multi-user, and enterprise licenses priced at USD 4750, USD 5250, and USD 8750 respectively.
10. Is the market size provided in terms of value or volume?
The market size is provided in terms of value, measured in Million.
11. Are there any specific market keywords associated with the report?
Yes, the market keyword associated with the report is "Armored Vehicle Fire Suppression Industry," which aids in identifying and referencing the specific market segment covered.
12. How do I determine which pricing option suits my needs best?
The pricing options vary based on user requirements and access needs. Individual users may opt for single-user licenses, while businesses requiring broader access may choose multi-user or enterprise licenses for cost-effective access to the report.
13. Are there any additional resources or data provided in the Armored Vehicle Fire Suppression Industry report?
While the report offers comprehensive insights, it's advisable to review the specific contents or supplementary materials provided to ascertain if additional resources or data are available.
14. How can I stay updated on further developments or reports in the Armored Vehicle Fire Suppression Industry?
To stay informed about further developments, trends, and reports in the Armored Vehicle Fire Suppression Industry, consider subscribing to industry newsletters, following relevant companies and organizations, or regularly checking reputable industry news sources and publications.
Methodology
Step 1 - Identification of Relevant Samples Size from Population Database


Step 2 - Approaches for Defining Global Market Size (Value, Volume* & Price*)

Note*: In applicable scenarios
Step 3 - Data Sources
Primary Research
- Web Analytics
- Survey Reports
- Research Institute
- Latest Research Reports
- Opinion Leaders
Secondary Research
- Annual Reports
- White Paper
- Latest Press Release
- Industry Association
- Paid Database
- Investor Presentations

Step 4 - Data Triangulation
Involves using different sources of information in order to increase the validity of a study
These sources are likely to be stakeholders in a program - participants, other researchers, program staff, other community members, and so on.
Then we put all data in single framework & apply various statistical tools to find out the dynamic on the market.
During the analysis stage, feedback from the stakeholder groups would be compared to determine areas of agreement as well as areas of divergence


