

Key Insights
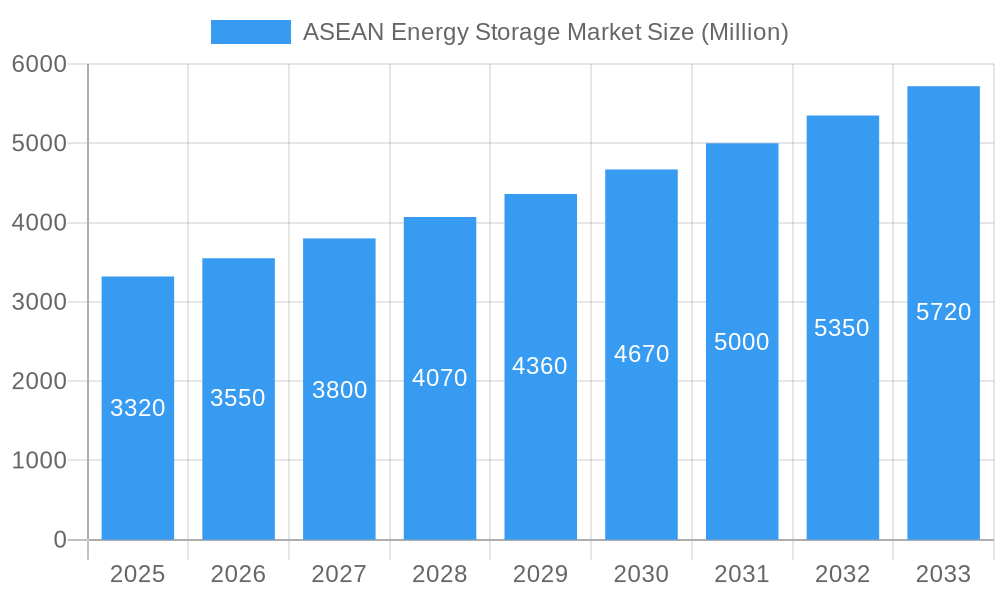
The ASEAN energy storage market, projected at \$3.32 billion in 2025, is poised for significant growth, driven by increasing renewable energy integration, rising electricity demand, and grid modernization initiatives across the region. The compound annual growth rate (CAGR) of 6.78% from 2025 to 2033 signifies substantial market expansion. Key growth drivers include the increasing adoption of renewable energy sources like solar and wind power, necessitating energy storage solutions for grid stability and reliability. Furthermore, government policies promoting energy storage deployment, coupled with decreasing battery costs and technological advancements, are accelerating market penetration. The market is segmented by technology (Pumped-Hydro Storage, Battery Energy Storage Systems, Other Types) and application (Residential, Commercial & Industrial), with Battery Energy Storage Systems dominating due to their scalability and flexibility. Major players like BYD, CATL, and LG Chem are actively investing in the region, expanding manufacturing capacity and forging partnerships to cater to the growing demand. Challenges include the high upfront capital costs associated with energy storage systems and the need for robust grid infrastructure to support widespread adoption. However, the long-term benefits of enhanced grid resilience and reduced reliance on fossil fuels are likely to overcome these challenges, fueling continued market growth. Within ASEAN, countries like Singapore, Indonesia, and Thailand are expected to lead the market expansion due to their robust economic growth, progressive energy policies, and increasing renewable energy adoption rates.
ASEAN Energy Storage Market Market Size (In Billion)
The ASEAN energy storage market's success hinges on addressing existing infrastructural limitations and fostering a supportive regulatory environment. Continued technological advancements, particularly in battery chemistry and energy density, will further reduce costs and improve performance, thereby attracting wider investment and consumer adoption. The growing awareness of environmental sustainability and the need for energy security are also key factors driving market growth. While pumped hydro storage remains a significant player, particularly in countries with suitable geography, battery energy storage systems are expected to witness faster growth due to their versatile applications and decreasing costs. The market presents lucrative opportunities for both established players and emerging companies, particularly those focusing on innovative solutions tailored to the specific needs of individual ASEAN countries. Competitive pricing strategies, coupled with robust after-sales service and support, will be crucial for success in this rapidly evolving market.
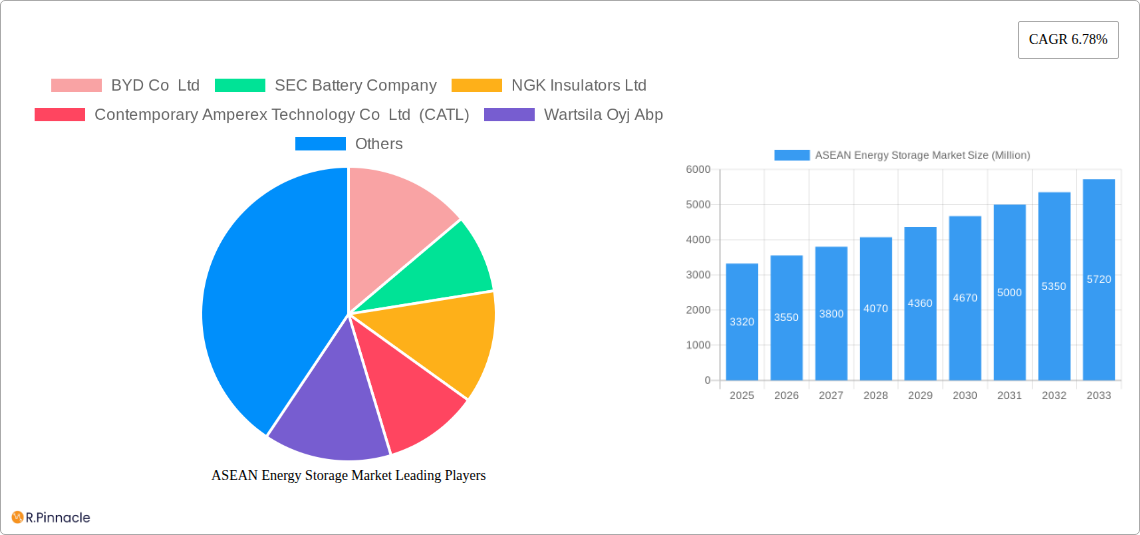
ASEAN Energy Storage Market Company Market Share
This in-depth report provides a comprehensive analysis of the ASEAN energy storage market, covering the period from 2019 to 2033. It offers invaluable insights for industry professionals, investors, and policymakers seeking to understand the market's dynamics, trends, and future potential. The report leverages extensive data analysis to provide actionable intelligence on market size, growth projections, key players, and emerging opportunities. Keywords: ASEAN Energy Storage Market, Battery Energy Storage Systems (BESS), Pumped Hydro Storage, Energy Storage, Renewable Energy, Southeast Asia, Market Analysis, Market Forecast, CAGR.
ASEAN Energy Storage Market Market Structure & Innovation Trends
This section analyzes the ASEAN energy storage market structure, highlighting concentration levels, innovation drivers, and regulatory frameworks. We examine the competitive landscape, including market share analysis of key players like BYD Co Ltd, SEC Battery Company, NGK Insulators Ltd, Contemporary Amperex Technology Co Ltd (CATL), Wartsila Oyj Abp, LG Chem Ltd, GS Yuasa Corporation (list not exhaustive), and assess the impact of mergers and acquisitions (M&A) activities. The analysis considers factors influencing market concentration, such as the entry of new players, technological advancements, and government policies. The report further explores the role of product substitutes, end-user demographics, and the overall innovation landscape within the market. Market share data for 2024 is estimated at xx%, with BYD Co Ltd holding an estimated xx% market share. Total M&A deal value in the period 2019-2024 is estimated at USD xx Million.
ASEAN Energy Storage Market Market Dynamics & Trends
This section delves into the key market dynamics and trends shaping the ASEAN energy storage market. We analyze market growth drivers, technological disruptions, evolving consumer preferences, and competitive dynamics. The report projects a Compound Annual Growth Rate (CAGR) of xx% during the forecast period (2025-2033), driven by increasing renewable energy integration, government support for energy transition initiatives, and the growing demand for grid stabilization solutions. Market penetration for battery energy storage systems (BESS) is projected to reach xx% by 2033. We also explore the impact of technological advancements, such as improved battery chemistries and reduced costs, on market growth.
Dominant Regions & Segments in ASEAN Energy Storage Market
This section identifies the leading regions, countries, and segments within the ASEAN energy storage market. We analyze the dominance of specific regions, focusing on key growth drivers within each.
Dominant Segments:
- Battery Energy Storage Systems (BESS): This segment is projected to dominate due to advancements in battery technology and declining costs.
- Pumped-Hydro Storage: While possessing large-scale capabilities, this technology's geographic limitations contribute to a smaller market share compared to BESS.
- Other Types: This segment includes various emerging technologies with comparatively smaller market shares.
Dominant Applications:
- Commercial and Industrial: This segment is experiencing significant growth driven by the increasing adoption of renewable energy sources and the need for grid stability.
- Residential: While smaller than commercial and industrial, the residential sector is showing increasing demand for energy storage solutions, driven by rising electricity costs and sustainability concerns.
Key Drivers (Examples):
- Indonesia's 'de-dieselization' program: Aims to replace diesel-generated power with renewable energy, creating substantial demand for energy storage.
- Vietnam's ambitious power generation plans: The nation's target to double power capacity by 2030 necessitates significant investments in energy storage infrastructure.
- Favorable government policies and incentives: Various ASEAN nations are implementing supportive policies to accelerate energy storage adoption.
ASEAN Energy Storage Market Product Innovations
This section summarizes recent product developments, applications, and competitive advantages within the ASEAN energy storage market. Technological trends, such as the development of more efficient and cost-effective battery chemistries, are driving innovation. New applications, such as microgrids and off-grid power solutions, are emerging and expanding the market. The focus is on products that offer improved performance, longer lifespans, and enhanced safety features.
Report Scope & Segmentation Analysis
This report segments the ASEAN energy storage market by type (Pumped-Hydro Storage, Battery Energy Storage Systems, Other Types) and application (Residential, Commercial and Industrial). Each segment's growth projections, market size (in Million USD), and competitive dynamics are analyzed. The base year is 2025, the estimated year is 2025, and the forecast period is 2025-2033. The historical period covered is 2019-2024. Detailed market size estimations are provided for each segment within the full report.
Key Drivers of ASEAN Energy Storage Market Growth
The growth of the ASEAN energy storage market is driven by several key factors: the increasing adoption of renewable energy sources (solar and wind), government initiatives promoting energy security and sustainability, and the need for grid stabilization and improved power quality. Technological advancements, including improvements in battery technology and reduced costs, also contribute to market expansion. Furthermore, rising electricity prices and concerns about climate change are motivating consumers and businesses to adopt energy storage solutions.
Challenges in the ASEAN Energy Storage Market Sector
Challenges include high initial investment costs for energy storage systems, limited awareness of energy storage benefits among consumers, and potential regulatory hurdles related to grid integration and safety standards. Supply chain disruptions and the availability of raw materials needed for battery production pose further challenges. Competitive pressures from established players also impact the market.
Emerging Opportunities in ASEAN Energy Storage Market
Emerging opportunities exist in the development of innovative energy storage technologies (e.g., flow batteries), the expansion into new market segments (e.g., transportation, data centers), and the growth of energy storage-as-a-service business models. The increasing demand for off-grid and microgrid solutions presents further opportunities. The development of more robust and reliable energy storage systems will be key to capturing these opportunities.
Leading Players in the ASEAN Energy Storage Market Market
- BYD Co Ltd
- SEC Battery Company
- NGK Insulators Ltd
- Contemporary Amperex Technology Co Ltd (CATL)
- Wartsila Oyj Abp
- LG Chem Ltd
- GS Yuasa Corporation
Key Developments in ASEAN Energy Storage Market Industry
- March 2022: Indonesian government launches a 5MW BESS pilot project as part of its 'de-dieselization' program.
- May 2022: Vietnam's government announces plans to double its power generation capacity by 2030, necessitating significant investment in energy storage.
Future Outlook for ASEAN Energy Storage Market Market
The future outlook for the ASEAN energy storage market is positive, driven by increasing renewable energy deployment, supportive government policies, and technological advancements. Strategic opportunities exist for companies to capitalize on the growing demand for energy storage solutions by investing in research and development, expanding production capacity, and developing innovative business models. The market is poised for significant growth in the coming years.
ASEAN Energy Storage Market Segmentation
-
1. Type
- 1.1. Pumped-Hydro Storage
- 1.2. Battery Energy Storage Systems
- 1.3. Other Types
-
2. Application
- 2.1. Residential
- 2.2. Commercial and Industrial
-
3. Geography
- 3.1. Indonesia
- 3.2. Vietnam
- 3.3. Phillipines
- 3.4. Malaysia
- 3.5. Rest of ASEAN
ASEAN Energy Storage Market Segmentation By Geography
- 1. Indonesia
- 2. Vietnam
- 3. Phillipines
- 4. Malaysia
- 5. Rest of ASEAN
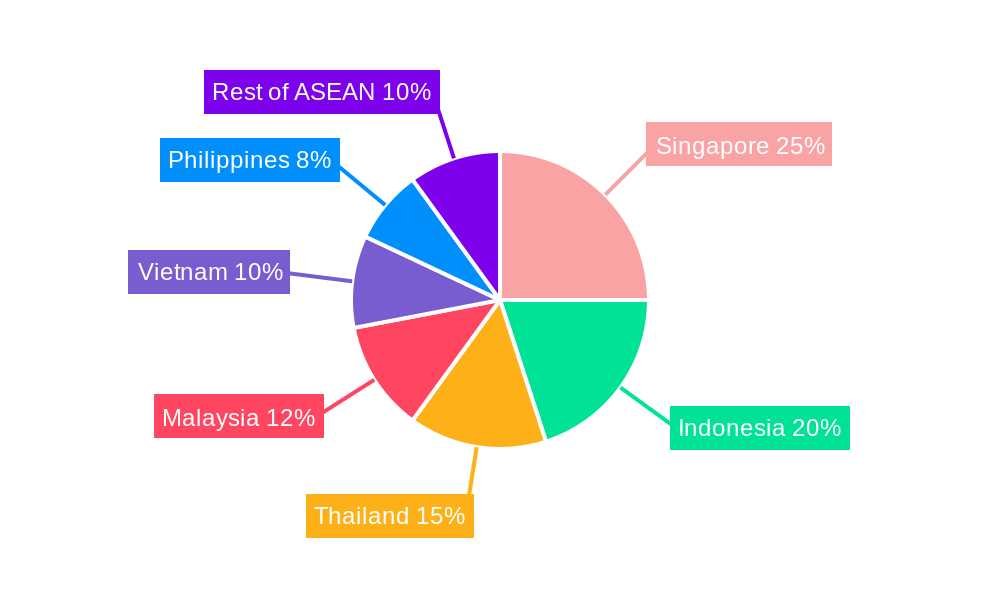
ASEAN Energy Storage Market Regional Market Share
Geographic Coverage of ASEAN Energy Storage Market
ASEAN Energy Storage Market REPORT HIGHLIGHTS
| Aspects | Details |
|---|---|
| Study Period | 2020-2034 |
| Base Year | 2025 |
| Estimated Year | 2026 |
| Forecast Period | 2026-2034 |
| Historical Period | 2020-2025 |
| Growth Rate | CAGR of 6.78% from 2020-2034 |
| Segmentation |
|
Table of Contents
- 1. Introduction
- 1.1. Research Scope
- 1.2. Market Segmentation
- 1.3. Research Objective
- 1.4. Definitions and Assumptions
- 2. Executive Summary
- 2.1. Market Snapshot
- 3. Market Dynamics
- 3.1. Market Drivers
- 3.2. Market Restrains
- 3.3. Market Trends
- 3.4. Market Opportunities
- 4. Market Factor Analysis
- 4.1. Porters Five Forces
- 4.1.1. Bargaining Power of Suppliers
- 4.1.2. Bargaining Power of Buyers
- 4.1.3. Threat of New Entrants
- 4.1.4. Threat of Substitutes
- 4.1.5. Competitive Rivalry
- 4.2. PESTEL analysis
- 4.3. BCG Analysis
- 4.3.1. Stars (High Growth, High Market Share)
- 4.3.2. Cash Cows (Low Growth, High Market Share)
- 4.3.3. Question Mark (High Growth, Low Market Share)
- 4.3.4. Dogs (Low Growth, Low Market Share)
- 4.4. Ansoff Matrix Analysis
- 4.5. Supply Chain Analysis
- 4.6. Regulatory Landscape
- 4.7. Current Market Potential and Opportunity Assessment (TAM–SAM–SOM Framework)
- 4.8. PRI Analyst Note
- 4.1. Porters Five Forces
- 5. Market Analysis, Insights and Forecast 2021-2033
- 5.1. Market Analysis, Insights and Forecast - by Type
- 5.1.1. Pumped-Hydro Storage
- 5.1.2. Battery Energy Storage Systems
- 5.1.3. Other Types
- 5.2. Market Analysis, Insights and Forecast - by Application
- 5.2.1. Residential
- 5.2.2. Commercial and Industrial
- 5.3. Market Analysis, Insights and Forecast - by Geography
- 5.3.1. Indonesia
- 5.3.2. Vietnam
- 5.3.3. Phillipines
- 5.3.4. Malaysia
- 5.3.5. Rest of ASEAN
- 5.4. Market Analysis, Insights and Forecast - by Region
- 5.4.1. Indonesia
- 5.4.2. Vietnam
- 5.4.3. Phillipines
- 5.4.4. Malaysia
- 5.4.5. Rest of ASEAN
- 5.1. Market Analysis, Insights and Forecast - by Type
- 6. Global ASEAN Energy Storage Market Analysis, Insights and Forecast, 2021-2033
- 6.1. Market Analysis, Insights and Forecast - by Type
- 6.1.1. Pumped-Hydro Storage
- 6.1.2. Battery Energy Storage Systems
- 6.1.3. Other Types
- 6.2. Market Analysis, Insights and Forecast - by Application
- 6.2.1. Residential
- 6.2.2. Commercial and Industrial
- 6.3. Market Analysis, Insights and Forecast - by Geography
- 6.3.1. Indonesia
- 6.3.2. Vietnam
- 6.3.3. Phillipines
- 6.3.4. Malaysia
- 6.3.5. Rest of ASEAN
- 6.1. Market Analysis, Insights and Forecast - by Type
- 7. Indonesia ASEAN Energy Storage Market Analysis, Insights and Forecast, 2020-2032
- 7.1. Market Analysis, Insights and Forecast - by Type
- 7.1.1. Pumped-Hydro Storage
- 7.1.2. Battery Energy Storage Systems
- 7.1.3. Other Types
- 7.2. Market Analysis, Insights and Forecast - by Application
- 7.2.1. Residential
- 7.2.2. Commercial and Industrial
- 7.3. Market Analysis, Insights and Forecast - by Geography
- 7.3.1. Indonesia
- 7.3.2. Vietnam
- 7.3.3. Phillipines
- 7.3.4. Malaysia
- 7.3.5. Rest of ASEAN
- 7.1. Market Analysis, Insights and Forecast - by Type
- 8. Vietnam ASEAN Energy Storage Market Analysis, Insights and Forecast, 2020-2032
- 8.1. Market Analysis, Insights and Forecast - by Type
- 8.1.1. Pumped-Hydro Storage
- 8.1.2. Battery Energy Storage Systems
- 8.1.3. Other Types
- 8.2. Market Analysis, Insights and Forecast - by Application
- 8.2.1. Residential
- 8.2.2. Commercial and Industrial
- 8.3. Market Analysis, Insights and Forecast - by Geography
- 8.3.1. Indonesia
- 8.3.2. Vietnam
- 8.3.3. Phillipines
- 8.3.4. Malaysia
- 8.3.5. Rest of ASEAN
- 8.1. Market Analysis, Insights and Forecast - by Type
- 9. Phillipines ASEAN Energy Storage Market Analysis, Insights and Forecast, 2020-2032
- 9.1. Market Analysis, Insights and Forecast - by Type
- 9.1.1. Pumped-Hydro Storage
- 9.1.2. Battery Energy Storage Systems
- 9.1.3. Other Types
- 9.2. Market Analysis, Insights and Forecast - by Application
- 9.2.1. Residential
- 9.2.2. Commercial and Industrial
- 9.3. Market Analysis, Insights and Forecast - by Geography
- 9.3.1. Indonesia
- 9.3.2. Vietnam
- 9.3.3. Phillipines
- 9.3.4. Malaysia
- 9.3.5. Rest of ASEAN
- 9.1. Market Analysis, Insights and Forecast - by Type
- 10. Malaysia ASEAN Energy Storage Market Analysis, Insights and Forecast, 2020-2032
- 10.1. Market Analysis, Insights and Forecast - by Type
- 10.1.1. Pumped-Hydro Storage
- 10.1.2. Battery Energy Storage Systems
- 10.1.3. Other Types
- 10.2. Market Analysis, Insights and Forecast - by Application
- 10.2.1. Residential
- 10.2.2. Commercial and Industrial
- 10.3. Market Analysis, Insights and Forecast - by Geography
- 10.3.1. Indonesia
- 10.3.2. Vietnam
- 10.3.3. Phillipines
- 10.3.4. Malaysia
- 10.3.5. Rest of ASEAN
- 10.1. Market Analysis, Insights and Forecast - by Type
- 11. Rest of ASEAN ASEAN Energy Storage Market Analysis, Insights and Forecast, 2020-2032
- 11.1. Market Analysis, Insights and Forecast - by Type
- 11.1.1. Pumped-Hydro Storage
- 11.1.2. Battery Energy Storage Systems
- 11.1.3. Other Types
- 11.2. Market Analysis, Insights and Forecast - by Application
- 11.2.1. Residential
- 11.2.2. Commercial and Industrial
- 11.3. Market Analysis, Insights and Forecast - by Geography
- 11.3.1. Indonesia
- 11.3.2. Vietnam
- 11.3.3. Phillipines
- 11.3.4. Malaysia
- 11.3.5. Rest of ASEAN
- 11.1. Market Analysis, Insights and Forecast - by Type
- 12. Competitive Analysis
- 12.1. Company Profiles
- 12.1.1 BYD Co Ltd
- 12.1.1.1. Company Overview
- 12.1.1.2. Products
- 12.1.1.3. Company Financials
- 12.1.1.4. SWOT Analysis
- 12.1.2 SEC Battery Company
- 12.1.2.1. Company Overview
- 12.1.2.2. Products
- 12.1.2.3. Company Financials
- 12.1.2.4. SWOT Analysis
- 12.1.3 NGK Insulators Ltd
- 12.1.3.1. Company Overview
- 12.1.3.2. Products
- 12.1.3.3. Company Financials
- 12.1.3.4. SWOT Analysis
- 12.1.4 Contemporary Amperex Technology Co Ltd (CATL)
- 12.1.4.1. Company Overview
- 12.1.4.2. Products
- 12.1.4.3. Company Financials
- 12.1.4.4. SWOT Analysis
- 12.1.5 Wartsila Oyj Abp
- 12.1.5.1. Company Overview
- 12.1.5.2. Products
- 12.1.5.3. Company Financials
- 12.1.5.4. SWOT Analysis
- 12.1.6 LG Chem Ltd *List Not Exhaustive
- 12.1.6.1. Company Overview
- 12.1.6.2. Products
- 12.1.6.3. Company Financials
- 12.1.6.4. SWOT Analysis
- 12.1.7 GS Yuasa Corporation
- 12.1.7.1. Company Overview
- 12.1.7.2. Products
- 12.1.7.3. Company Financials
- 12.1.7.4. SWOT Analysis
- 12.1.1 BYD Co Ltd
- 12.2. Market Entropy
- 12.2.1 Company's Key Areas Served
- 12.2.2 Recent Developments
- 12.3. Company Market Share Analysis 2025
- 12.3.1 Top 5 Companies Market Share Analysis
- 12.3.2 Top 3 Companies Market Share Analysis
- 12.4. List of Potential Customers
- 13. Research Methodology
List of Figures
- Figure 1: Global ASEAN Energy Storage Market Revenue Breakdown (Million, %) by Region 2025 & 2033
- Figure 2: Global ASEAN Energy Storage Market Volume Breakdown (K Unit, %) by Region 2025 & 2033
- Figure 3: Indonesia ASEAN Energy Storage Market Revenue (Million), by Type 2025 & 2033
- Figure 4: Indonesia ASEAN Energy Storage Market Volume (K Unit), by Type 2025 & 2033
- Figure 5: Indonesia ASEAN Energy Storage Market Revenue Share (%), by Type 2025 & 2033
- Figure 6: Indonesia ASEAN Energy Storage Market Volume Share (%), by Type 2025 & 2033
- Figure 7: Indonesia ASEAN Energy Storage Market Revenue (Million), by Application 2025 & 2033
- Figure 8: Indonesia ASEAN Energy Storage Market Volume (K Unit), by Application 2025 & 2033
- Figure 9: Indonesia ASEAN Energy Storage Market Revenue Share (%), by Application 2025 & 2033
- Figure 10: Indonesia ASEAN Energy Storage Market Volume Share (%), by Application 2025 & 2033
- Figure 11: Indonesia ASEAN Energy Storage Market Revenue (Million), by Geography 2025 & 2033
- Figure 12: Indonesia ASEAN Energy Storage Market Volume (K Unit), by Geography 2025 & 2033
- Figure 13: Indonesia ASEAN Energy Storage Market Revenue Share (%), by Geography 2025 & 2033
- Figure 14: Indonesia ASEAN Energy Storage Market Volume Share (%), by Geography 2025 & 2033
- Figure 15: Indonesia ASEAN Energy Storage Market Revenue (Million), by Country 2025 & 2033
- Figure 16: Indonesia ASEAN Energy Storage Market Volume (K Unit), by Country 2025 & 2033
- Figure 17: Indonesia ASEAN Energy Storage Market Revenue Share (%), by Country 2025 & 2033
- Figure 18: Indonesia ASEAN Energy Storage Market Volume Share (%), by Country 2025 & 2033
- Figure 19: Vietnam ASEAN Energy Storage Market Revenue (Million), by Type 2025 & 2033
- Figure 20: Vietnam ASEAN Energy Storage Market Volume (K Unit), by Type 2025 & 2033
- Figure 21: Vietnam ASEAN Energy Storage Market Revenue Share (%), by Type 2025 & 2033
- Figure 22: Vietnam ASEAN Energy Storage Market Volume Share (%), by Type 2025 & 2033
- Figure 23: Vietnam ASEAN Energy Storage Market Revenue (Million), by Application 2025 & 2033
- Figure 24: Vietnam ASEAN Energy Storage Market Volume (K Unit), by Application 2025 & 2033
- Figure 25: Vietnam ASEAN Energy Storage Market Revenue Share (%), by Application 2025 & 2033
- Figure 26: Vietnam ASEAN Energy Storage Market Volume Share (%), by Application 2025 & 2033
- Figure 27: Vietnam ASEAN Energy Storage Market Revenue (Million), by Geography 2025 & 2033
- Figure 28: Vietnam ASEAN Energy Storage Market Volume (K Unit), by Geography 2025 & 2033
- Figure 29: Vietnam ASEAN Energy Storage Market Revenue Share (%), by Geography 2025 & 2033
- Figure 30: Vietnam ASEAN Energy Storage Market Volume Share (%), by Geography 2025 & 2033
- Figure 31: Vietnam ASEAN Energy Storage Market Revenue (Million), by Country 2025 & 2033
- Figure 32: Vietnam ASEAN Energy Storage Market Volume (K Unit), by Country 2025 & 2033
- Figure 33: Vietnam ASEAN Energy Storage Market Revenue Share (%), by Country 2025 & 2033
- Figure 34: Vietnam ASEAN Energy Storage Market Volume Share (%), by Country 2025 & 2033
- Figure 35: Phillipines ASEAN Energy Storage Market Revenue (Million), by Type 2025 & 2033
- Figure 36: Phillipines ASEAN Energy Storage Market Volume (K Unit), by Type 2025 & 2033
- Figure 37: Phillipines ASEAN Energy Storage Market Revenue Share (%), by Type 2025 & 2033
- Figure 38: Phillipines ASEAN Energy Storage Market Volume Share (%), by Type 2025 & 2033
- Figure 39: Phillipines ASEAN Energy Storage Market Revenue (Million), by Application 2025 & 2033
- Figure 40: Phillipines ASEAN Energy Storage Market Volume (K Unit), by Application 2025 & 2033
- Figure 41: Phillipines ASEAN Energy Storage Market Revenue Share (%), by Application 2025 & 2033
- Figure 42: Phillipines ASEAN Energy Storage Market Volume Share (%), by Application 2025 & 2033
- Figure 43: Phillipines ASEAN Energy Storage Market Revenue (Million), by Geography 2025 & 2033
- Figure 44: Phillipines ASEAN Energy Storage Market Volume (K Unit), by Geography 2025 & 2033
- Figure 45: Phillipines ASEAN Energy Storage Market Revenue Share (%), by Geography 2025 & 2033
- Figure 46: Phillipines ASEAN Energy Storage Market Volume Share (%), by Geography 2025 & 2033
- Figure 47: Phillipines ASEAN Energy Storage Market Revenue (Million), by Country 2025 & 2033
- Figure 48: Phillipines ASEAN Energy Storage Market Volume (K Unit), by Country 2025 & 2033
- Figure 49: Phillipines ASEAN Energy Storage Market Revenue Share (%), by Country 2025 & 2033
- Figure 50: Phillipines ASEAN Energy Storage Market Volume Share (%), by Country 2025 & 2033
- Figure 51: Malaysia ASEAN Energy Storage Market Revenue (Million), by Type 2025 & 2033
- Figure 52: Malaysia ASEAN Energy Storage Market Volume (K Unit), by Type 2025 & 2033
- Figure 53: Malaysia ASEAN Energy Storage Market Revenue Share (%), by Type 2025 & 2033
- Figure 54: Malaysia ASEAN Energy Storage Market Volume Share (%), by Type 2025 & 2033
- Figure 55: Malaysia ASEAN Energy Storage Market Revenue (Million), by Application 2025 & 2033
- Figure 56: Malaysia ASEAN Energy Storage Market Volume (K Unit), by Application 2025 & 2033
- Figure 57: Malaysia ASEAN Energy Storage Market Revenue Share (%), by Application 2025 & 2033
- Figure 58: Malaysia ASEAN Energy Storage Market Volume Share (%), by Application 2025 & 2033
- Figure 59: Malaysia ASEAN Energy Storage Market Revenue (Million), by Geography 2025 & 2033
- Figure 60: Malaysia ASEAN Energy Storage Market Volume (K Unit), by Geography 2025 & 2033
- Figure 61: Malaysia ASEAN Energy Storage Market Revenue Share (%), by Geography 2025 & 2033
- Figure 62: Malaysia ASEAN Energy Storage Market Volume Share (%), by Geography 2025 & 2033
- Figure 63: Malaysia ASEAN Energy Storage Market Revenue (Million), by Country 2025 & 2033
- Figure 64: Malaysia ASEAN Energy Storage Market Volume (K Unit), by Country 2025 & 2033
- Figure 65: Malaysia ASEAN Energy Storage Market Revenue Share (%), by Country 2025 & 2033
- Figure 66: Malaysia ASEAN Energy Storage Market Volume Share (%), by Country 2025 & 2033
- Figure 67: Rest of ASEAN ASEAN Energy Storage Market Revenue (Million), by Type 2025 & 2033
- Figure 68: Rest of ASEAN ASEAN Energy Storage Market Volume (K Unit), by Type 2025 & 2033
- Figure 69: Rest of ASEAN ASEAN Energy Storage Market Revenue Share (%), by Type 2025 & 2033
- Figure 70: Rest of ASEAN ASEAN Energy Storage Market Volume Share (%), by Type 2025 & 2033
- Figure 71: Rest of ASEAN ASEAN Energy Storage Market Revenue (Million), by Application 2025 & 2033
- Figure 72: Rest of ASEAN ASEAN Energy Storage Market Volume (K Unit), by Application 2025 & 2033
- Figure 73: Rest of ASEAN ASEAN Energy Storage Market Revenue Share (%), by Application 2025 & 2033
- Figure 74: Rest of ASEAN ASEAN Energy Storage Market Volume Share (%), by Application 2025 & 2033
- Figure 75: Rest of ASEAN ASEAN Energy Storage Market Revenue (Million), by Geography 2025 & 2033
- Figure 76: Rest of ASEAN ASEAN Energy Storage Market Volume (K Unit), by Geography 2025 & 2033
- Figure 77: Rest of ASEAN ASEAN Energy Storage Market Revenue Share (%), by Geography 2025 & 2033
- Figure 78: Rest of ASEAN ASEAN Energy Storage Market Volume Share (%), by Geography 2025 & 2033
- Figure 79: Rest of ASEAN ASEAN Energy Storage Market Revenue (Million), by Country 2025 & 2033
- Figure 80: Rest of ASEAN ASEAN Energy Storage Market Volume (K Unit), by Country 2025 & 2033
- Figure 81: Rest of ASEAN ASEAN Energy Storage Market Revenue Share (%), by Country 2025 & 2033
- Figure 82: Rest of ASEAN ASEAN Energy Storage Market Volume Share (%), by Country 2025 & 2033
List of Tables
- Table 1: Global ASEAN Energy Storage Market Revenue Million Forecast, by Type 2020 & 2033
- Table 2: Global ASEAN Energy Storage Market Volume K Unit Forecast, by Type 2020 & 2033
- Table 3: Global ASEAN Energy Storage Market Revenue Million Forecast, by Application 2020 & 2033
- Table 4: Global ASEAN Energy Storage Market Volume K Unit Forecast, by Application 2020 & 2033
- Table 5: Global ASEAN Energy Storage Market Revenue Million Forecast, by Geography 2020 & 2033
- Table 6: Global ASEAN Energy Storage Market Volume K Unit Forecast, by Geography 2020 & 2033
- Table 7: Global ASEAN Energy Storage Market Revenue Million Forecast, by Region 2020 & 2033
- Table 8: Global ASEAN Energy Storage Market Volume K Unit Forecast, by Region 2020 & 2033
- Table 9: Global ASEAN Energy Storage Market Revenue Million Forecast, by Type 2020 & 2033
- Table 10: Global ASEAN Energy Storage Market Volume K Unit Forecast, by Type 2020 & 2033
- Table 11: Global ASEAN Energy Storage Market Revenue Million Forecast, by Application 2020 & 2033
- Table 12: Global ASEAN Energy Storage Market Volume K Unit Forecast, by Application 2020 & 2033
- Table 13: Global ASEAN Energy Storage Market Revenue Million Forecast, by Geography 2020 & 2033
- Table 14: Global ASEAN Energy Storage Market Volume K Unit Forecast, by Geography 2020 & 2033
- Table 15: Global ASEAN Energy Storage Market Revenue Million Forecast, by Country 2020 & 2033
- Table 16: Global ASEAN Energy Storage Market Volume K Unit Forecast, by Country 2020 & 2033
- Table 17: Global ASEAN Energy Storage Market Revenue Million Forecast, by Type 2020 & 2033
- Table 18: Global ASEAN Energy Storage Market Volume K Unit Forecast, by Type 2020 & 2033
- Table 19: Global ASEAN Energy Storage Market Revenue Million Forecast, by Application 2020 & 2033
- Table 20: Global ASEAN Energy Storage Market Volume K Unit Forecast, by Application 2020 & 2033
- Table 21: Global ASEAN Energy Storage Market Revenue Million Forecast, by Geography 2020 & 2033
- Table 22: Global ASEAN Energy Storage Market Volume K Unit Forecast, by Geography 2020 & 2033
- Table 23: Global ASEAN Energy Storage Market Revenue Million Forecast, by Country 2020 & 2033
- Table 24: Global ASEAN Energy Storage Market Volume K Unit Forecast, by Country 2020 & 2033
- Table 25: Global ASEAN Energy Storage Market Revenue Million Forecast, by Type 2020 & 2033
- Table 26: Global ASEAN Energy Storage Market Volume K Unit Forecast, by Type 2020 & 2033
- Table 27: Global ASEAN Energy Storage Market Revenue Million Forecast, by Application 2020 & 2033
- Table 28: Global ASEAN Energy Storage Market Volume K Unit Forecast, by Application 2020 & 2033
- Table 29: Global ASEAN Energy Storage Market Revenue Million Forecast, by Geography 2020 & 2033
- Table 30: Global ASEAN Energy Storage Market Volume K Unit Forecast, by Geography 2020 & 2033
- Table 31: Global ASEAN Energy Storage Market Revenue Million Forecast, by Country 2020 & 2033
- Table 32: Global ASEAN Energy Storage Market Volume K Unit Forecast, by Country 2020 & 2033
- Table 33: Global ASEAN Energy Storage Market Revenue Million Forecast, by Type 2020 & 2033
- Table 34: Global ASEAN Energy Storage Market Volume K Unit Forecast, by Type 2020 & 2033
- Table 35: Global ASEAN Energy Storage Market Revenue Million Forecast, by Application 2020 & 2033
- Table 36: Global ASEAN Energy Storage Market Volume K Unit Forecast, by Application 2020 & 2033
- Table 37: Global ASEAN Energy Storage Market Revenue Million Forecast, by Geography 2020 & 2033
- Table 38: Global ASEAN Energy Storage Market Volume K Unit Forecast, by Geography 2020 & 2033
- Table 39: Global ASEAN Energy Storage Market Revenue Million Forecast, by Country 2020 & 2033
- Table 40: Global ASEAN Energy Storage Market Volume K Unit Forecast, by Country 2020 & 2033
- Table 41: Global ASEAN Energy Storage Market Revenue Million Forecast, by Type 2020 & 2033
- Table 42: Global ASEAN Energy Storage Market Volume K Unit Forecast, by Type 2020 & 2033
- Table 43: Global ASEAN Energy Storage Market Revenue Million Forecast, by Application 2020 & 2033
- Table 44: Global ASEAN Energy Storage Market Volume K Unit Forecast, by Application 2020 & 2033
- Table 45: Global ASEAN Energy Storage Market Revenue Million Forecast, by Geography 2020 & 2033
- Table 46: Global ASEAN Energy Storage Market Volume K Unit Forecast, by Geography 2020 & 2033
- Table 47: Global ASEAN Energy Storage Market Revenue Million Forecast, by Country 2020 & 2033
- Table 48: Global ASEAN Energy Storage Market Volume K Unit Forecast, by Country 2020 & 2033
Frequently Asked Questions
1. What is the projected Compound Annual Growth Rate (CAGR) of the ASEAN Energy Storage Market?
The projected CAGR is approximately 6.78%.
2. Which companies are prominent players in the ASEAN Energy Storage Market?
Key companies in the market include BYD Co Ltd, SEC Battery Company, NGK Insulators Ltd, Contemporary Amperex Technology Co Ltd (CATL), Wartsila Oyj Abp, LG Chem Ltd *List Not Exhaustive, GS Yuasa Corporation.
3. What are the main segments of the ASEAN Energy Storage Market?
The market segments include Type, Application, Geography.
4. Can you provide details about the market size?
The market size is estimated to be USD 3.32 Million as of 2022.
5. What are some drivers contributing to market growth?
Growth in Power Demand from Residential. Commercial and Industrial Consumers4.; Unscheduled Power Outages and Grid Instability would Demand Energy Storage Solutions.
6. What are the notable trends driving market growth?
Battery Energy Storage Segment Expected to Witness Significant Growth.
7. Are there any restraints impacting market growth?
Lack of Investments could Hamper the Growth of Energy Storage Market.
8. Can you provide examples of recent developments in the market?
In March 2022, the Indonesian government launched a 5MW battery energy storage system (BESS) pilot project as it aims to move away from diesel-generated power. Perusahaan Listrik Negara (PLN) 'de-dieselization' program will involve 5,200 units of new renewable energy generation with a total power of 2GW by 2024 and is a potential application for battery storage.
9. What pricing options are available for accessing the report?
Pricing options include single-user, multi-user, and enterprise licenses priced at USD 4750, USD 5250, and USD 8750 respectively.
10. Is the market size provided in terms of value or volume?
The market size is provided in terms of value, measured in Million and volume, measured in K Unit.
11. Are there any specific market keywords associated with the report?
Yes, the market keyword associated with the report is "ASEAN Energy Storage Market," which aids in identifying and referencing the specific market segment covered.
12. How do I determine which pricing option suits my needs best?
The pricing options vary based on user requirements and access needs. Individual users may opt for single-user licenses, while businesses requiring broader access may choose multi-user or enterprise licenses for cost-effective access to the report.
13. Are there any additional resources or data provided in the ASEAN Energy Storage Market report?
While the report offers comprehensive insights, it's advisable to review the specific contents or supplementary materials provided to ascertain if additional resources or data are available.
14. How can I stay updated on further developments or reports in the ASEAN Energy Storage Market?
To stay informed about further developments, trends, and reports in the ASEAN Energy Storage Market, consider subscribing to industry newsletters, following relevant companies and organizations, or regularly checking reputable industry news sources and publications.
Methodology
Step 1 - Identification of Relevant Samples Size from Population Database


Step 2 - Approaches for Defining Global Market Size (Value, Volume* & Price*)

Note*: In applicable scenarios
Step 3 - Data Sources
Primary Research
- Web Analytics
- Survey Reports
- Research Institute
- Latest Research Reports
- Opinion Leaders
Secondary Research
- Annual Reports
- White Paper
- Latest Press Release
- Industry Association
- Paid Database
- Investor Presentations

Step 4 - Data Triangulation
Involves using different sources of information in order to increase the validity of a study
These sources are likely to be stakeholders in a program - participants, other researchers, program staff, other community members, and so on.
Then we put all data in single framework & apply various statistical tools to find out the dynamic on the market.
During the analysis stage, feedback from the stakeholder groups would be compared to determine areas of agreement as well as areas of divergence