
Key Insights
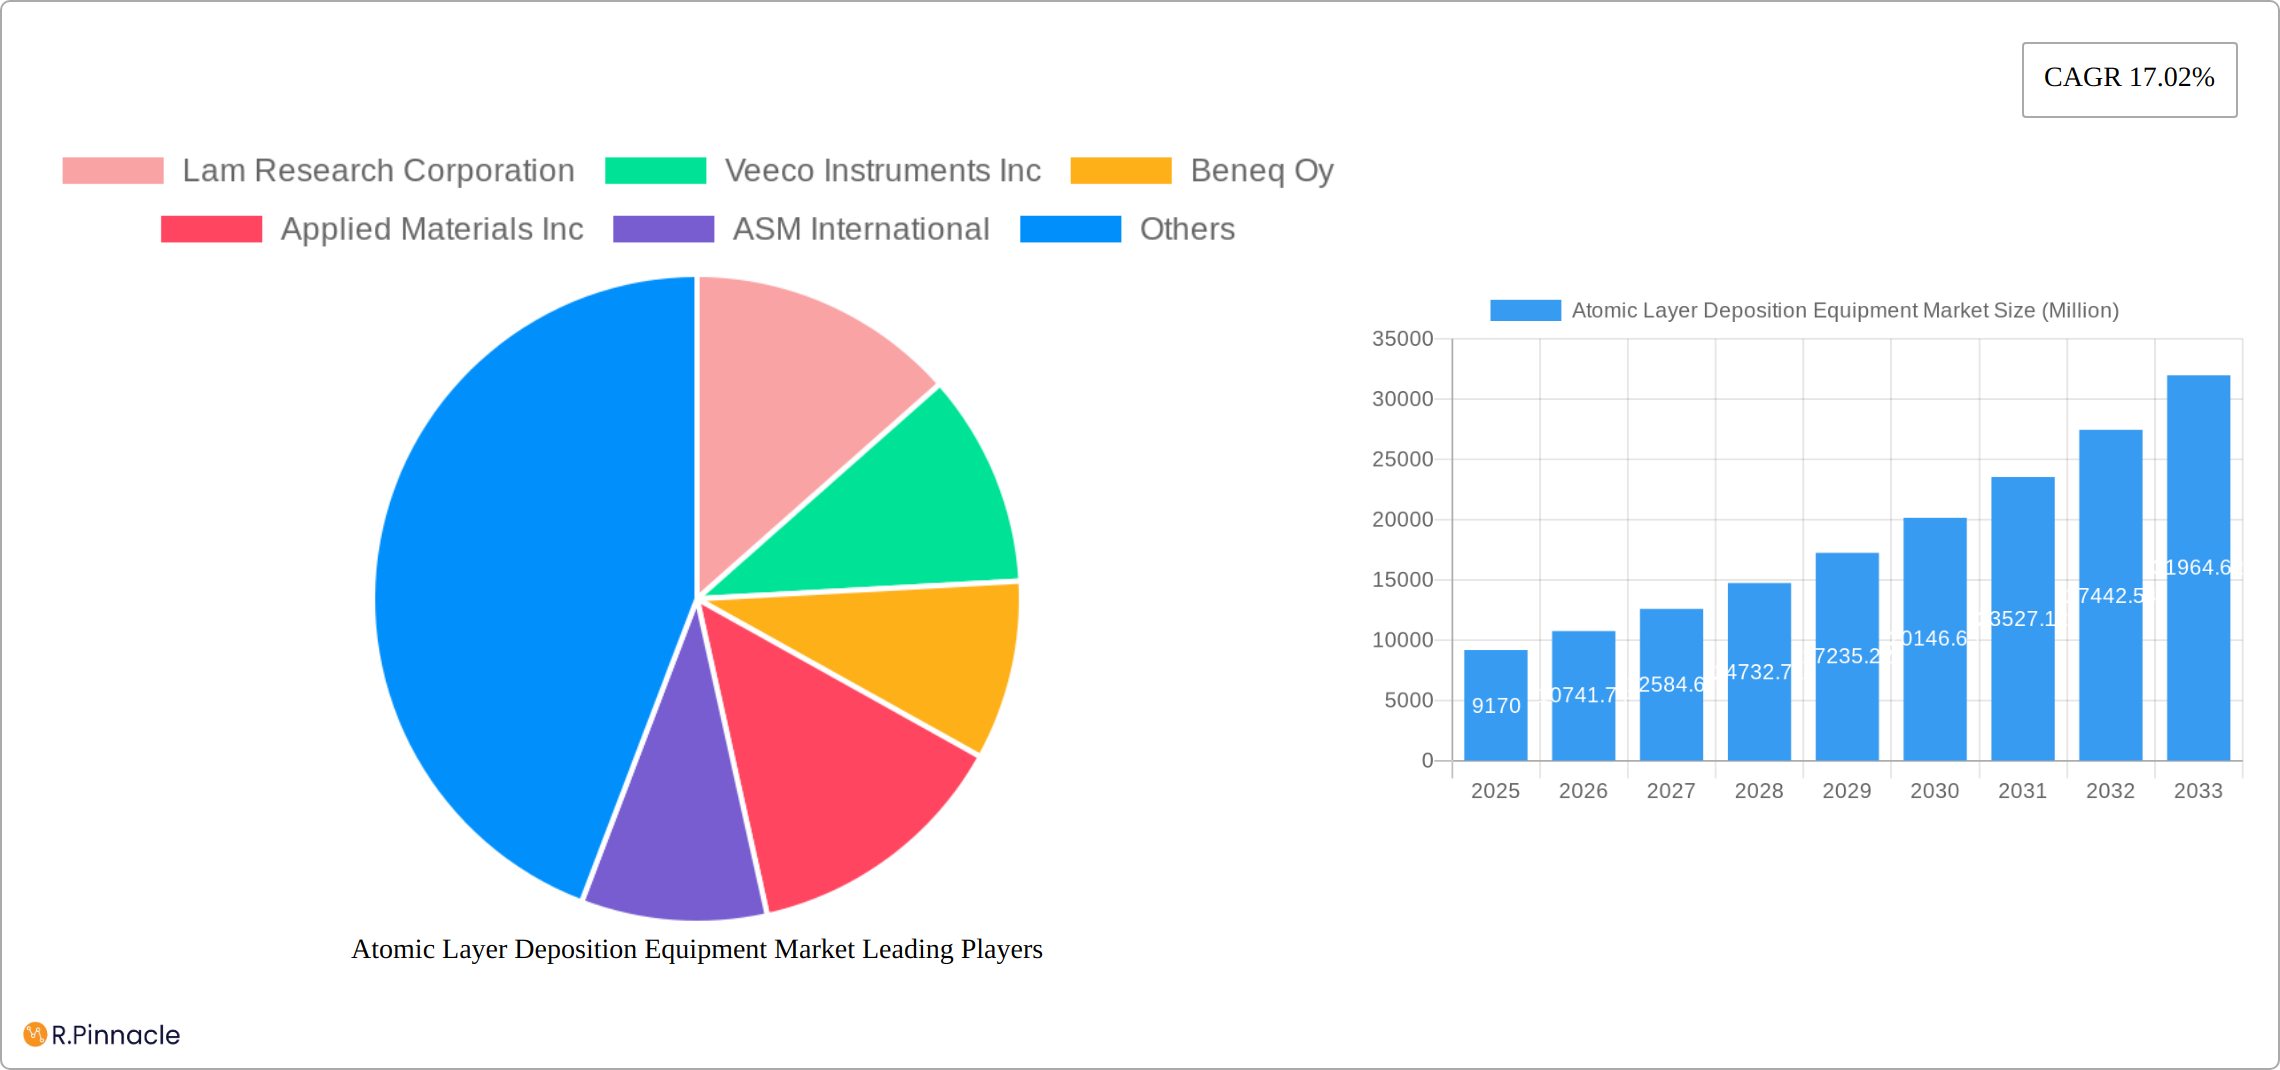
The Atomic Layer Deposition (ALD) equipment market is experiencing robust growth, projected to reach a market size of $9.17 billion in 2025 and exhibiting a Compound Annual Growth Rate (CAGR) of 17.02% from 2025 to 2033. This expansion is driven by the increasing demand for advanced semiconductor devices, particularly in the computing sector, data centers, and consumer electronics. The healthcare and biomedical industries are also significant contributors, leveraging ALD's precision for creating biocompatible coatings and advanced medical devices. The automotive sector's adoption of ALD for enhancing component durability and efficiency further fuels market growth. While the "Other Applications" segment remains less defined, its growth trajectory is likely tied to emerging applications in fields like energy storage and flexible electronics. Key players like Lam Research, Applied Materials, and Tokyo Electron are strategically investing in R&D and expanding their product portfolios to capitalize on this burgeoning market. The geographical distribution shows strong growth across North America, Europe, and Asia-Pacific, with China and other Asian economies representing significant growth opportunities.
The market's sustained growth is predicated on several key factors. Ongoing miniaturization trends in electronics necessitate ALD's ability to deposit ultra-thin, highly conformal films. Furthermore, the increasing demand for higher performance and reliability in semiconductor devices and medical implants directly translates to higher ALD equipment adoption. However, the market may face challenges related to high capital expenditure associated with ALD systems and the need for skilled technicians to operate and maintain them. This could potentially restrain market penetration, particularly in smaller companies or developing regions. Nevertheless, the overall outlook for the ALD equipment market remains extremely positive, driven by technological advancements, expanding applications, and increasing investments in research and development. The continued integration of ALD in various high-growth sectors ensures its strong position within the broader materials processing equipment market for the foreseeable future.
Atomic Layer Deposition (ALD) Equipment Market Report: 2019-2033
This comprehensive report provides a detailed analysis of the Atomic Layer Deposition (ALD) Equipment market, offering actionable insights for industry professionals and investors. The study period spans 2019-2033, with 2025 serving as the base and estimated year. The forecast period covers 2025-2033, and the historical period encompasses 2019-2024. The report analyzes market dynamics, segmentation, key players, and future growth potential, leveraging data-driven analysis and expert insights to offer a holistic view of this rapidly evolving market. The total market value in 2025 is estimated at xx Million.
Atomic Layer Deposition Equipment Market Structure & Innovation Trends
The ALD equipment market exhibits a moderately concentrated structure, with key players such as Lam Research Corporation, Applied Materials Inc, Tokyo Electron Limited, and Veeco Instruments Inc holding significant market share. Precise market share data for 2025 is currently unavailable (xx%), but historical data indicates a trend of consolidation through mergers and acquisitions (M&A). Recent M&A activity values are estimated at xx Million. Innovation is driven by the need for advanced materials in high-growth sectors like semiconductors and electronics. Stringent regulatory frameworks, particularly concerning environmental impact and safety, influence equipment design and manufacturing. Key substitutes include Chemical Vapor Deposition (CVD) techniques, but ALD's precision and versatility maintain its competitive advantage. End-user demographics are largely concentrated in technologically advanced regions with significant semiconductor manufacturing capabilities.
- Market Concentration: Moderately concentrated, with a few dominant players.
- Innovation Drivers: Advancements in semiconductor technology, need for precision coatings.
- Regulatory Framework: Stringent environmental and safety regulations.
- Product Substitutes: CVD technologies, but with limited comparable precision.
- M&A Activity: Significant consolidation through M&A, with estimated values at xx Million.

Atomic Layer Deposition Equipment Market Dynamics & Trends
The ALD equipment market is experiencing robust growth, fueled by the increasing demand for advanced semiconductor devices, particularly in the computing sector, data centers, and consumer electronics. The market is expected to exhibit a CAGR of xx% during the forecast period. Technological advancements, such as the development of more efficient and precise ALD systems, are further driving market growth. Consumer preferences for smaller, faster, and more energy-efficient electronic devices are pushing the demand for advanced semiconductor manufacturing techniques. Intense competition among major players is fostering innovation and driving down prices. Market penetration for ALD in various applications is steadily increasing as its benefits become more widely recognized. This growth is further boosted by the expanding applications of ALD in healthcare, automotive, and other emerging sectors.
Dominant Regions & Segments in Atomic Layer Deposition Equipment Market
The Semiconductor and Electronics segment dominates the ALD equipment market, driven by the high demand for advanced chips and memory devices. This is further segmented into Computing Sector, Data Centres, and Consumer Electronics. Asia-Pacific, particularly countries like South Korea, Taiwan, and China, leads in market share due to high concentrations of semiconductor manufacturing facilities and supportive government policies.
Key Drivers in Asia-Pacific:
- High concentration of semiconductor fabs
- Government support for technological advancements
- Robust growth in consumer electronics market
Dominance Analysis: The Asia-Pacific region's dominance stems from its established semiconductor manufacturing infrastructure and significant investments in R&D. This is further enhanced by favorable government policies promoting technological innovation. The semiconductor and electronics sector will remain the leading application segment, driven by the continuous demand for advanced semiconductor devices and related technologies.
Atomic Layer Deposition Equipment Market Product Innovations
Recent innovations focus on enhancing deposition rates, improving film uniformity, and expanding the range of materials that can be deposited using ALD. New systems offer improved process control and automation, reducing production costs and improving yield. These advancements address market needs for higher throughput, lower defect rates, and broader material compatibility. The integration of AI and machine learning into ALD systems is also emerging, enabling predictive maintenance and process optimization.
Report Scope & Segmentation Analysis
The report segments the ALD equipment market by application:
Semiconductor and Electronics: This segment is projected to witness significant growth, driven by the increasing demand for advanced semiconductors and electronics. Market size for 2025 is estimated at xx Million. Competition is intense among major equipment manufacturers.
Healthcare and Biomedical Applications: This is a fast-growing segment, benefiting from the use of ALD for creating advanced medical implants and devices. Market size in 2025 is projected at xx Million. Growth is being driven by increasing healthcare spending.
Automotive: This segment is characterized by moderate growth due to the use of ALD in automotive electronics and sensors. Market size for 2025 is estimated at xx Million. Growth is being driven by the increasing adoption of advanced driver-assistance systems (ADAS).
Other Applications: This category includes diverse applications like solar energy and aerospace, with market size in 2025 estimated at xx Million. Growth opportunities exist in niche applications.
Key Drivers of Atomic Layer Deposition Equipment Market Growth
The ALD equipment market growth is propelled by several factors: the increasing demand for advanced semiconductor devices in electronics, the burgeoning healthcare sector's need for sophisticated medical implants, and the automotive industry's adoption of advanced sensors. Technological advancements in ALD systems, leading to enhanced deposition rates, improved process control, and wider material compatibility, also play a significant role. Finally, supportive government policies and increased R&D investments are fostering further market expansion.
Challenges in the Atomic Layer Deposition Equipment Market Sector
The ALD equipment market faces challenges including the high cost of equipment, complexities involved in ALD process optimization, and the potential for supply chain disruptions. Stringent regulatory compliance requirements for environmental and safety standards add to the complexity. Competitive pressures from established players and emerging new entrants further intensify the challenges faced by market participants. These factors potentially impact market growth by limiting adoption rate and driving down profit margins.
Emerging Opportunities in Atomic Layer Deposition Equipment Market
Emerging opportunities reside in expanding into new application areas, particularly in the renewable energy, aerospace, and biomedical sectors. The development of novel ALD materials and processes presents significant growth potential. Integrating advanced technologies like AI and machine learning into ALD systems can optimize process control, improve efficiency, and boost production yield. Finally, exploring new market segments and global expansion offer further opportunities.
Leading Players in the Atomic Layer Deposition Equipment Market Market
- Lam Research Corporation https://www.lamresearch.com/
- Veeco Instruments Inc https://www.veeco.com/
- Beneq Oy
- Applied Materials Inc https://www.appliedmaterials.com/
- ASM International https://www.asm.com/
- Kurt J Lesker Company
- Tokyo Electron Limited https://www.tel.co.jp/en/
- Oxford Instruments PLC https://www.oxford-instruments.com/
- Entegris Inc https://www.entegris.com/
- Picosun Oy
Key Developments in Atomic Layer Deposition Equipment Market Industry
February 2024: ASML highlights ALD's crucial role in sub-3nm node chip manufacturing, driven by generative AI's growth. This positions ALD as essential for high-end chip production, accounting for half of ASML's equipment revenue. The company also expanded into Silicon Epitaxy and Silicon Carbide markets.
February 2024: Applied Materials announced a collaboration to build a sustainable semiconductor ecosystem in India. This involves establishing an engineering center to accelerate the development of semiconductor equipment subsystems and components.
Future Outlook for Atomic Layer Deposition Equipment Market Market
The ALD equipment market is poised for continued robust growth, fueled by sustained demand from the semiconductor and electronics sectors. Expansion into new applications, technological advancements, and strategic collaborations will further drive market expansion. The increasing adoption of ALD in emerging technologies and industries presents substantial opportunities for market participants. The integration of AI and machine learning will improve efficiency and open new possibilities.
Atomic Layer Deposition Equipment Market Segmentation
-
1. Application
- 1.1. Semiconductor
- 1.2. Healthcare and Biomedical Applications
- 1.3. Automotive
- 1.4. Other Applications
Atomic Layer Deposition Equipment Market Segmentation By Geography
- 1. North America: United States Canada Mexico
- 2. Europe: Germany: France: Italy: United Kingdom Netherlands Rest of Europe
- 3. Asia Pacific: China, Japan, India, South Korea, Taiwan, Australia, Rest of Asia-Pacific
- 4. South America : Brazil, Argentina, Rest of South America
- 5. MEA: Middle East, Africa

Atomic Layer Deposition Equipment Market REPORT HIGHLIGHTS
| Aspects | Details |
|---|---|
| Study Period | 2019-2033 |
| Base Year | 2024 |
| Estimated Year | 2025 |
| Forecast Period | 2025-2033 |
| Historical Period | 2019-2024 |
| Growth Rate | CAGR of 17.02% from 2019-2033 |
| Segmentation |
|
Table of Contents
- 1. Introduction
- 1.1. Research Scope
- 1.2. Market Segmentation
- 1.3. Research Methodology
- 1.4. Definitions and Assumptions
- 2. Executive Summary
- 2.1. Introduction
- 3. Market Dynamics
- 3.1. Introduction
- 3.2. Market Drivers
- 3.2.1. Increase in demand of Microelectronics and Consumer Electronics; Advancement in Computing and Storage Technologies
- 3.3. Market Restrains
- 3.3.1. Dynamic Nature of Technologies Requires Several Changes in Manufacturing Equipment
- 3.4. Market Trends
- 3.4.1. Semiconductors and Electronics Industry to Drive the Market Growth
- 4. Market Factor Analysis
- 4.1. Porters Five Forces
- 4.2. Supply/Value Chain
- 4.3. PESTEL analysis
- 4.4. Market Entropy
- 4.5. Patent/Trademark Analysis
- 5. Global Atomic Layer Deposition Equipment Market Analysis, Insights and Forecast, 2019-2031
- 5.1. Market Analysis, Insights and Forecast - by Application
- 5.1.1. Semiconductor
- 5.1.2. Healthcare and Biomedical Applications
- 5.1.3. Automotive
- 5.1.4. Other Applications
- 5.2. Market Analysis, Insights and Forecast - by Region
- 5.2.1. North America: United States Canada Mexico
- 5.2.2. Europe: Germany: France: Italy: United Kingdom Netherlands Rest of Europe
- 5.2.3. Asia Pacific: China, Japan, India, South Korea, Taiwan, Australia, Rest of Asia-Pacific
- 5.2.4. South America : Brazil, Argentina, Rest of South America
- 5.2.5. MEA: Middle East, Africa
- 5.1. Market Analysis, Insights and Forecast - by Application
- 6. North America: United States Canada Mexico Atomic Layer Deposition Equipment Market Analysis, Insights and Forecast, 2019-2031
- 6.1. Market Analysis, Insights and Forecast - by Application
- 6.1.1. Semiconductor
- 6.1.2. Healthcare and Biomedical Applications
- 6.1.3. Automotive
- 6.1.4. Other Applications
- 6.1. Market Analysis, Insights and Forecast - by Application
- 7. Europe: Germany: France: Italy: United Kingdom Netherlands Rest of Europe Atomic Layer Deposition Equipment Market Analysis, Insights and Forecast, 2019-2031
- 7.1. Market Analysis, Insights and Forecast - by Application
- 7.1.1. Semiconductor
- 7.1.2. Healthcare and Biomedical Applications
- 7.1.3. Automotive
- 7.1.4. Other Applications
- 7.1. Market Analysis, Insights and Forecast - by Application
- 8. Asia Pacific: China, Japan, India, South Korea, Taiwan, Australia, Rest of Asia-Pacific Atomic Layer Deposition Equipment Market Analysis, Insights and Forecast, 2019-2031
- 8.1. Market Analysis, Insights and Forecast - by Application
- 8.1.1. Semiconductor
- 8.1.2. Healthcare and Biomedical Applications
- 8.1.3. Automotive
- 8.1.4. Other Applications
- 8.1. Market Analysis, Insights and Forecast - by Application
- 9. South America : Brazil, Argentina, Rest of South America Atomic Layer Deposition Equipment Market Analysis, Insights and Forecast, 2019-2031
- 9.1. Market Analysis, Insights and Forecast - by Application
- 9.1.1. Semiconductor
- 9.1.2. Healthcare and Biomedical Applications
- 9.1.3. Automotive
- 9.1.4. Other Applications
- 9.1. Market Analysis, Insights and Forecast - by Application
- 10. MEA: Middle East, Africa Atomic Layer Deposition Equipment Market Analysis, Insights and Forecast, 2019-2031
- 10.1. Market Analysis, Insights and Forecast - by Application
- 10.1.1. Semiconductor
- 10.1.2. Healthcare and Biomedical Applications
- 10.1.3. Automotive
- 10.1.4. Other Applications
- 10.1. Market Analysis, Insights and Forecast - by Application
- 11. North America Atomic Layer Deposition Equipment Market Analysis, Insights and Forecast, 2019-2031
- 11.1. Market Analysis, Insights and Forecast - By Country/Sub-region
- 11.1.1 United States
- 11.1.2 Canada
- 11.1.3 Mexico
- 12. Europe Atomic Layer Deposition Equipment Market Analysis, Insights and Forecast, 2019-2031
- 12.1. Market Analysis, Insights and Forecast - By Country/Sub-region
- 12.1.1 Germany
- 12.1.2 United Kingdom
- 12.1.3 France
- 12.1.4 Spain
- 12.1.5 Italy
- 12.1.6 Spain
- 12.1.7 Belgium
- 12.1.8 Netherland
- 12.1.9 Nordics
- 12.1.10 Rest of Europe
- 13. Asia Pacific Atomic Layer Deposition Equipment Market Analysis, Insights and Forecast, 2019-2031
- 13.1. Market Analysis, Insights and Forecast - By Country/Sub-region
- 13.1.1 China
- 13.1.2 Japan
- 13.1.3 India
- 13.1.4 South Korea
- 13.1.5 Southeast Asia
- 13.1.6 Australia
- 13.1.7 Indonesia
- 13.1.8 Phillipes
- 13.1.9 Singapore
- 13.1.10 Thailandc
- 13.1.11 Rest of Asia Pacific
- 14. South America Atomic Layer Deposition Equipment Market Analysis, Insights and Forecast, 2019-2031
- 14.1. Market Analysis, Insights and Forecast - By Country/Sub-region
- 14.1.1 Brazil
- 14.1.2 Argentina
- 14.1.3 Peru
- 14.1.4 Chile
- 14.1.5 Colombia
- 14.1.6 Ecuador
- 14.1.7 Venezuela
- 14.1.8 Rest of South America
- 15. North America Atomic Layer Deposition Equipment Market Analysis, Insights and Forecast, 2019-2031
- 15.1. Market Analysis, Insights and Forecast - By Country/Sub-region
- 15.1.1 United States
- 15.1.2 Canada
- 15.1.3 Mexico
- 16. MEA Atomic Layer Deposition Equipment Market Analysis, Insights and Forecast, 2019-2031
- 16.1. Market Analysis, Insights and Forecast - By Country/Sub-region
- 16.1.1 United Arab Emirates
- 16.1.2 Saudi Arabia
- 16.1.3 South Africa
- 16.1.4 Rest of Middle East and Africa
- 17. Competitive Analysis
- 17.1. Global Market Share Analysis 2024
- 17.2. Company Profiles
- 17.2.1 Lam Research Corporation
- 17.2.1.1. Overview
- 17.2.1.2. Products
- 17.2.1.3. SWOT Analysis
- 17.2.1.4. Recent Developments
- 17.2.1.5. Financials (Based on Availability)
- 17.2.2 Veeco Instruments Inc
- 17.2.2.1. Overview
- 17.2.2.2. Products
- 17.2.2.3. SWOT Analysis
- 17.2.2.4. Recent Developments
- 17.2.2.5. Financials (Based on Availability)
- 17.2.3 Beneq Oy
- 17.2.3.1. Overview
- 17.2.3.2. Products
- 17.2.3.3. SWOT Analysis
- 17.2.3.4. Recent Developments
- 17.2.3.5. Financials (Based on Availability)
- 17.2.4 Applied Materials Inc
- 17.2.4.1. Overview
- 17.2.4.2. Products
- 17.2.4.3. SWOT Analysis
- 17.2.4.4. Recent Developments
- 17.2.4.5. Financials (Based on Availability)
- 17.2.5 ASM International
- 17.2.5.1. Overview
- 17.2.5.2. Products
- 17.2.5.3. SWOT Analysis
- 17.2.5.4. Recent Developments
- 17.2.5.5. Financials (Based on Availability)
- 17.2.6 Kurt J Lesker Company
- 17.2.6.1. Overview
- 17.2.6.2. Products
- 17.2.6.3. SWOT Analysis
- 17.2.6.4. Recent Developments
- 17.2.6.5. Financials (Based on Availability)
- 17.2.7 Tokyo Electron Limited
- 17.2.7.1. Overview
- 17.2.7.2. Products
- 17.2.7.3. SWOT Analysis
- 17.2.7.4. Recent Developments
- 17.2.7.5. Financials (Based on Availability)
- 17.2.8 Oxford Instruments PLC
- 17.2.8.1. Overview
- 17.2.8.2. Products
- 17.2.8.3. SWOT Analysis
- 17.2.8.4. Recent Developments
- 17.2.8.5. Financials (Based on Availability)
- 17.2.9 Entegris Inc
- 17.2.9.1. Overview
- 17.2.9.2. Products
- 17.2.9.3. SWOT Analysis
- 17.2.9.4. Recent Developments
- 17.2.9.5. Financials (Based on Availability)
- 17.2.10 Picosun Oy
- 17.2.10.1. Overview
- 17.2.10.2. Products
- 17.2.10.3. SWOT Analysis
- 17.2.10.4. Recent Developments
- 17.2.10.5. Financials (Based on Availability)
- 17.2.1 Lam Research Corporation
List of Figures
- Figure 1: Global Atomic Layer Deposition Equipment Market Revenue Breakdown (Million, %) by Region 2024 & 2032
- Figure 2: Global Atomic Layer Deposition Equipment Market Volume Breakdown (K Unit, %) by Region 2024 & 2032
- Figure 3: North America Atomic Layer Deposition Equipment Market Revenue (Million), by Country 2024 & 2032
- Figure 4: North America Atomic Layer Deposition Equipment Market Volume (K Unit), by Country 2024 & 2032
- Figure 5: North America Atomic Layer Deposition Equipment Market Revenue Share (%), by Country 2024 & 2032
- Figure 6: North America Atomic Layer Deposition Equipment Market Volume Share (%), by Country 2024 & 2032
- Figure 7: Europe Atomic Layer Deposition Equipment Market Revenue (Million), by Country 2024 & 2032
- Figure 8: Europe Atomic Layer Deposition Equipment Market Volume (K Unit), by Country 2024 & 2032
- Figure 9: Europe Atomic Layer Deposition Equipment Market Revenue Share (%), by Country 2024 & 2032
- Figure 10: Europe Atomic Layer Deposition Equipment Market Volume Share (%), by Country 2024 & 2032
- Figure 11: Asia Pacific Atomic Layer Deposition Equipment Market Revenue (Million), by Country 2024 & 2032
- Figure 12: Asia Pacific Atomic Layer Deposition Equipment Market Volume (K Unit), by Country 2024 & 2032
- Figure 13: Asia Pacific Atomic Layer Deposition Equipment Market Revenue Share (%), by Country 2024 & 2032
- Figure 14: Asia Pacific Atomic Layer Deposition Equipment Market Volume Share (%), by Country 2024 & 2032
- Figure 15: South America Atomic Layer Deposition Equipment Market Revenue (Million), by Country 2024 & 2032
- Figure 16: South America Atomic Layer Deposition Equipment Market Volume (K Unit), by Country 2024 & 2032
- Figure 17: South America Atomic Layer Deposition Equipment Market Revenue Share (%), by Country 2024 & 2032
- Figure 18: South America Atomic Layer Deposition Equipment Market Volume Share (%), by Country 2024 & 2032
- Figure 19: North America Atomic Layer Deposition Equipment Market Revenue (Million), by Country 2024 & 2032
- Figure 20: North America Atomic Layer Deposition Equipment Market Volume (K Unit), by Country 2024 & 2032
- Figure 21: North America Atomic Layer Deposition Equipment Market Revenue Share (%), by Country 2024 & 2032
- Figure 22: North America Atomic Layer Deposition Equipment Market Volume Share (%), by Country 2024 & 2032
- Figure 23: MEA Atomic Layer Deposition Equipment Market Revenue (Million), by Country 2024 & 2032
- Figure 24: MEA Atomic Layer Deposition Equipment Market Volume (K Unit), by Country 2024 & 2032
- Figure 25: MEA Atomic Layer Deposition Equipment Market Revenue Share (%), by Country 2024 & 2032
- Figure 26: MEA Atomic Layer Deposition Equipment Market Volume Share (%), by Country 2024 & 2032
- Figure 27: North America: United States Canada Mexico Atomic Layer Deposition Equipment Market Revenue (Million), by Application 2024 & 2032
- Figure 28: North America: United States Canada Mexico Atomic Layer Deposition Equipment Market Volume (K Unit), by Application 2024 & 2032
- Figure 29: North America: United States Canada Mexico Atomic Layer Deposition Equipment Market Revenue Share (%), by Application 2024 & 2032
- Figure 30: North America: United States Canada Mexico Atomic Layer Deposition Equipment Market Volume Share (%), by Application 2024 & 2032
- Figure 31: North America: United States Canada Mexico Atomic Layer Deposition Equipment Market Revenue (Million), by Country 2024 & 2032
- Figure 32: North America: United States Canada Mexico Atomic Layer Deposition Equipment Market Volume (K Unit), by Country 2024 & 2032
- Figure 33: North America: United States Canada Mexico Atomic Layer Deposition Equipment Market Revenue Share (%), by Country 2024 & 2032
- Figure 34: North America: United States Canada Mexico Atomic Layer Deposition Equipment Market Volume Share (%), by Country 2024 & 2032
- Figure 35: Europe: Germany: France: Italy: United Kingdom Netherlands Rest of Europe Atomic Layer Deposition Equipment Market Revenue (Million), by Application 2024 & 2032
- Figure 36: Europe: Germany: France: Italy: United Kingdom Netherlands Rest of Europe Atomic Layer Deposition Equipment Market Volume (K Unit), by Application 2024 & 2032
- Figure 37: Europe: Germany: France: Italy: United Kingdom Netherlands Rest of Europe Atomic Layer Deposition Equipment Market Revenue Share (%), by Application 2024 & 2032
- Figure 38: Europe: Germany: France: Italy: United Kingdom Netherlands Rest of Europe Atomic Layer Deposition Equipment Market Volume Share (%), by Application 2024 & 2032
- Figure 39: Europe: Germany: France: Italy: United Kingdom Netherlands Rest of Europe Atomic Layer Deposition Equipment Market Revenue (Million), by Country 2024 & 2032
- Figure 40: Europe: Germany: France: Italy: United Kingdom Netherlands Rest of Europe Atomic Layer Deposition Equipment Market Volume (K Unit), by Country 2024 & 2032
- Figure 41: Europe: Germany: France: Italy: United Kingdom Netherlands Rest of Europe Atomic Layer Deposition Equipment Market Revenue Share (%), by Country 2024 & 2032
- Figure 42: Europe: Germany: France: Italy: United Kingdom Netherlands Rest of Europe Atomic Layer Deposition Equipment Market Volume Share (%), by Country 2024 & 2032
- Figure 43: Asia Pacific: China, Japan, India, South Korea, Taiwan, Australia, Rest of Asia-Pacific Atomic Layer Deposition Equipment Market Revenue (Million), by Application 2024 & 2032
- Figure 44: Asia Pacific: China, Japan, India, South Korea, Taiwan, Australia, Rest of Asia-Pacific Atomic Layer Deposition Equipment Market Volume (K Unit), by Application 2024 & 2032
- Figure 45: Asia Pacific: China, Japan, India, South Korea, Taiwan, Australia, Rest of Asia-Pacific Atomic Layer Deposition Equipment Market Revenue Share (%), by Application 2024 & 2032
- Figure 46: Asia Pacific: China, Japan, India, South Korea, Taiwan, Australia, Rest of Asia-Pacific Atomic Layer Deposition Equipment Market Volume Share (%), by Application 2024 & 2032
- Figure 47: Asia Pacific: China, Japan, India, South Korea, Taiwan, Australia, Rest of Asia-Pacific Atomic Layer Deposition Equipment Market Revenue (Million), by Country 2024 & 2032
- Figure 48: Asia Pacific: China, Japan, India, South Korea, Taiwan, Australia, Rest of Asia-Pacific Atomic Layer Deposition Equipment Market Volume (K Unit), by Country 2024 & 2032
- Figure 49: Asia Pacific: China, Japan, India, South Korea, Taiwan, Australia, Rest of Asia-Pacific Atomic Layer Deposition Equipment Market Revenue Share (%), by Country 2024 & 2032
- Figure 50: Asia Pacific: China, Japan, India, South Korea, Taiwan, Australia, Rest of Asia-Pacific Atomic Layer Deposition Equipment Market Volume Share (%), by Country 2024 & 2032
- Figure 51: South America : Brazil, Argentina, Rest of South America Atomic Layer Deposition Equipment Market Revenue (Million), by Application 2024 & 2032
- Figure 52: South America : Brazil, Argentina, Rest of South America Atomic Layer Deposition Equipment Market Volume (K Unit), by Application 2024 & 2032
- Figure 53: South America : Brazil, Argentina, Rest of South America Atomic Layer Deposition Equipment Market Revenue Share (%), by Application 2024 & 2032
- Figure 54: South America : Brazil, Argentina, Rest of South America Atomic Layer Deposition Equipment Market Volume Share (%), by Application 2024 & 2032
- Figure 55: South America : Brazil, Argentina, Rest of South America Atomic Layer Deposition Equipment Market Revenue (Million), by Country 2024 & 2032
- Figure 56: South America : Brazil, Argentina, Rest of South America Atomic Layer Deposition Equipment Market Volume (K Unit), by Country 2024 & 2032
- Figure 57: South America : Brazil, Argentina, Rest of South America Atomic Layer Deposition Equipment Market Revenue Share (%), by Country 2024 & 2032
- Figure 58: South America : Brazil, Argentina, Rest of South America Atomic Layer Deposition Equipment Market Volume Share (%), by Country 2024 & 2032
- Figure 59: MEA: Middle East, Africa Atomic Layer Deposition Equipment Market Revenue (Million), by Application 2024 & 2032
- Figure 60: MEA: Middle East, Africa Atomic Layer Deposition Equipment Market Volume (K Unit), by Application 2024 & 2032
- Figure 61: MEA: Middle East, Africa Atomic Layer Deposition Equipment Market Revenue Share (%), by Application 2024 & 2032
- Figure 62: MEA: Middle East, Africa Atomic Layer Deposition Equipment Market Volume Share (%), by Application 2024 & 2032
- Figure 63: MEA: Middle East, Africa Atomic Layer Deposition Equipment Market Revenue (Million), by Country 2024 & 2032
- Figure 64: MEA: Middle East, Africa Atomic Layer Deposition Equipment Market Volume (K Unit), by Country 2024 & 2032
- Figure 65: MEA: Middle East, Africa Atomic Layer Deposition Equipment Market Revenue Share (%), by Country 2024 & 2032
- Figure 66: MEA: Middle East, Africa Atomic Layer Deposition Equipment Market Volume Share (%), by Country 2024 & 2032
List of Tables
- Table 1: Global Atomic Layer Deposition Equipment Market Revenue Million Forecast, by Region 2019 & 2032
- Table 2: Global Atomic Layer Deposition Equipment Market Volume K Unit Forecast, by Region 2019 & 2032
- Table 3: Global Atomic Layer Deposition Equipment Market Revenue Million Forecast, by Application 2019 & 2032
- Table 4: Global Atomic Layer Deposition Equipment Market Volume K Unit Forecast, by Application 2019 & 2032
- Table 5: Global Atomic Layer Deposition Equipment Market Revenue Million Forecast, by Region 2019 & 2032
- Table 6: Global Atomic Layer Deposition Equipment Market Volume K Unit Forecast, by Region 2019 & 2032
- Table 7: Global Atomic Layer Deposition Equipment Market Revenue Million Forecast, by Country 2019 & 2032
- Table 8: Global Atomic Layer Deposition Equipment Market Volume K Unit Forecast, by Country 2019 & 2032
- Table 9: United States Atomic Layer Deposition Equipment Market Revenue (Million) Forecast, by Application 2019 & 2032
- Table 10: United States Atomic Layer Deposition Equipment Market Volume (K Unit) Forecast, by Application 2019 & 2032
- Table 11: Canada Atomic Layer Deposition Equipment Market Revenue (Million) Forecast, by Application 2019 & 2032
- Table 12: Canada Atomic Layer Deposition Equipment Market Volume (K Unit) Forecast, by Application 2019 & 2032
- Table 13: Mexico Atomic Layer Deposition Equipment Market Revenue (Million) Forecast, by Application 2019 & 2032
- Table 14: Mexico Atomic Layer Deposition Equipment Market Volume (K Unit) Forecast, by Application 2019 & 2032
- Table 15: Global Atomic Layer Deposition Equipment Market Revenue Million Forecast, by Country 2019 & 2032
- Table 16: Global Atomic Layer Deposition Equipment Market Volume K Unit Forecast, by Country 2019 & 2032
- Table 17: Germany Atomic Layer Deposition Equipment Market Revenue (Million) Forecast, by Application 2019 & 2032
- Table 18: Germany Atomic Layer Deposition Equipment Market Volume (K Unit) Forecast, by Application 2019 & 2032
- Table 19: United Kingdom Atomic Layer Deposition Equipment Market Revenue (Million) Forecast, by Application 2019 & 2032
- Table 20: United Kingdom Atomic Layer Deposition Equipment Market Volume (K Unit) Forecast, by Application 2019 & 2032
- Table 21: France Atomic Layer Deposition Equipment Market Revenue (Million) Forecast, by Application 2019 & 2032
- Table 22: France Atomic Layer Deposition Equipment Market Volume (K Unit) Forecast, by Application 2019 & 2032
- Table 23: Spain Atomic Layer Deposition Equipment Market Revenue (Million) Forecast, by Application 2019 & 2032
- Table 24: Spain Atomic Layer Deposition Equipment Market Volume (K Unit) Forecast, by Application 2019 & 2032
- Table 25: Italy Atomic Layer Deposition Equipment Market Revenue (Million) Forecast, by Application 2019 & 2032
- Table 26: Italy Atomic Layer Deposition Equipment Market Volume (K Unit) Forecast, by Application 2019 & 2032
- Table 27: Spain Atomic Layer Deposition Equipment Market Revenue (Million) Forecast, by Application 2019 & 2032
- Table 28: Spain Atomic Layer Deposition Equipment Market Volume (K Unit) Forecast, by Application 2019 & 2032
- Table 29: Belgium Atomic Layer Deposition Equipment Market Revenue (Million) Forecast, by Application 2019 & 2032
- Table 30: Belgium Atomic Layer Deposition Equipment Market Volume (K Unit) Forecast, by Application 2019 & 2032
- Table 31: Netherland Atomic Layer Deposition Equipment Market Revenue (Million) Forecast, by Application 2019 & 2032
- Table 32: Netherland Atomic Layer Deposition Equipment Market Volume (K Unit) Forecast, by Application 2019 & 2032
- Table 33: Nordics Atomic Layer Deposition Equipment Market Revenue (Million) Forecast, by Application 2019 & 2032
- Table 34: Nordics Atomic Layer Deposition Equipment Market Volume (K Unit) Forecast, by Application 2019 & 2032
- Table 35: Rest of Europe Atomic Layer Deposition Equipment Market Revenue (Million) Forecast, by Application 2019 & 2032
- Table 36: Rest of Europe Atomic Layer Deposition Equipment Market Volume (K Unit) Forecast, by Application 2019 & 2032
- Table 37: Global Atomic Layer Deposition Equipment Market Revenue Million Forecast, by Country 2019 & 2032
- Table 38: Global Atomic Layer Deposition Equipment Market Volume K Unit Forecast, by Country 2019 & 2032
- Table 39: China Atomic Layer Deposition Equipment Market Revenue (Million) Forecast, by Application 2019 & 2032
- Table 40: China Atomic Layer Deposition Equipment Market Volume (K Unit) Forecast, by Application 2019 & 2032
- Table 41: Japan Atomic Layer Deposition Equipment Market Revenue (Million) Forecast, by Application 2019 & 2032
- Table 42: Japan Atomic Layer Deposition Equipment Market Volume (K Unit) Forecast, by Application 2019 & 2032
- Table 43: India Atomic Layer Deposition Equipment Market Revenue (Million) Forecast, by Application 2019 & 2032
- Table 44: India Atomic Layer Deposition Equipment Market Volume (K Unit) Forecast, by Application 2019 & 2032
- Table 45: South Korea Atomic Layer Deposition Equipment Market Revenue (Million) Forecast, by Application 2019 & 2032
- Table 46: South Korea Atomic Layer Deposition Equipment Market Volume (K Unit) Forecast, by Application 2019 & 2032
- Table 47: Southeast Asia Atomic Layer Deposition Equipment Market Revenue (Million) Forecast, by Application 2019 & 2032
- Table 48: Southeast Asia Atomic Layer Deposition Equipment Market Volume (K Unit) Forecast, by Application 2019 & 2032
- Table 49: Australia Atomic Layer Deposition Equipment Market Revenue (Million) Forecast, by Application 2019 & 2032
- Table 50: Australia Atomic Layer Deposition Equipment Market Volume (K Unit) Forecast, by Application 2019 & 2032
- Table 51: Indonesia Atomic Layer Deposition Equipment Market Revenue (Million) Forecast, by Application 2019 & 2032
- Table 52: Indonesia Atomic Layer Deposition Equipment Market Volume (K Unit) Forecast, by Application 2019 & 2032
- Table 53: Phillipes Atomic Layer Deposition Equipment Market Revenue (Million) Forecast, by Application 2019 & 2032
- Table 54: Phillipes Atomic Layer Deposition Equipment Market Volume (K Unit) Forecast, by Application 2019 & 2032
- Table 55: Singapore Atomic Layer Deposition Equipment Market Revenue (Million) Forecast, by Application 2019 & 2032
- Table 56: Singapore Atomic Layer Deposition Equipment Market Volume (K Unit) Forecast, by Application 2019 & 2032
- Table 57: Thailandc Atomic Layer Deposition Equipment Market Revenue (Million) Forecast, by Application 2019 & 2032
- Table 58: Thailandc Atomic Layer Deposition Equipment Market Volume (K Unit) Forecast, by Application 2019 & 2032
- Table 59: Rest of Asia Pacific Atomic Layer Deposition Equipment Market Revenue (Million) Forecast, by Application 2019 & 2032
- Table 60: Rest of Asia Pacific Atomic Layer Deposition Equipment Market Volume (K Unit) Forecast, by Application 2019 & 2032
- Table 61: Global Atomic Layer Deposition Equipment Market Revenue Million Forecast, by Country 2019 & 2032
- Table 62: Global Atomic Layer Deposition Equipment Market Volume K Unit Forecast, by Country 2019 & 2032
- Table 63: Brazil Atomic Layer Deposition Equipment Market Revenue (Million) Forecast, by Application 2019 & 2032
- Table 64: Brazil Atomic Layer Deposition Equipment Market Volume (K Unit) Forecast, by Application 2019 & 2032
- Table 65: Argentina Atomic Layer Deposition Equipment Market Revenue (Million) Forecast, by Application 2019 & 2032
- Table 66: Argentina Atomic Layer Deposition Equipment Market Volume (K Unit) Forecast, by Application 2019 & 2032
- Table 67: Peru Atomic Layer Deposition Equipment Market Revenue (Million) Forecast, by Application 2019 & 2032
- Table 68: Peru Atomic Layer Deposition Equipment Market Volume (K Unit) Forecast, by Application 2019 & 2032
- Table 69: Chile Atomic Layer Deposition Equipment Market Revenue (Million) Forecast, by Application 2019 & 2032
- Table 70: Chile Atomic Layer Deposition Equipment Market Volume (K Unit) Forecast, by Application 2019 & 2032
- Table 71: Colombia Atomic Layer Deposition Equipment Market Revenue (Million) Forecast, by Application 2019 & 2032
- Table 72: Colombia Atomic Layer Deposition Equipment Market Volume (K Unit) Forecast, by Application 2019 & 2032
- Table 73: Ecuador Atomic Layer Deposition Equipment Market Revenue (Million) Forecast, by Application 2019 & 2032
- Table 74: Ecuador Atomic Layer Deposition Equipment Market Volume (K Unit) Forecast, by Application 2019 & 2032
- Table 75: Venezuela Atomic Layer Deposition Equipment Market Revenue (Million) Forecast, by Application 2019 & 2032
- Table 76: Venezuela Atomic Layer Deposition Equipment Market Volume (K Unit) Forecast, by Application 2019 & 2032
- Table 77: Rest of South America Atomic Layer Deposition Equipment Market Revenue (Million) Forecast, by Application 2019 & 2032
- Table 78: Rest of South America Atomic Layer Deposition Equipment Market Volume (K Unit) Forecast, by Application 2019 & 2032
- Table 79: Global Atomic Layer Deposition Equipment Market Revenue Million Forecast, by Country 2019 & 2032
- Table 80: Global Atomic Layer Deposition Equipment Market Volume K Unit Forecast, by Country 2019 & 2032
- Table 81: United States Atomic Layer Deposition Equipment Market Revenue (Million) Forecast, by Application 2019 & 2032
- Table 82: United States Atomic Layer Deposition Equipment Market Volume (K Unit) Forecast, by Application 2019 & 2032
- Table 83: Canada Atomic Layer Deposition Equipment Market Revenue (Million) Forecast, by Application 2019 & 2032
- Table 84: Canada Atomic Layer Deposition Equipment Market Volume (K Unit) Forecast, by Application 2019 & 2032
- Table 85: Mexico Atomic Layer Deposition Equipment Market Revenue (Million) Forecast, by Application 2019 & 2032
- Table 86: Mexico Atomic Layer Deposition Equipment Market Volume (K Unit) Forecast, by Application 2019 & 2032
- Table 87: Global Atomic Layer Deposition Equipment Market Revenue Million Forecast, by Country 2019 & 2032
- Table 88: Global Atomic Layer Deposition Equipment Market Volume K Unit Forecast, by Country 2019 & 2032
- Table 89: United Arab Emirates Atomic Layer Deposition Equipment Market Revenue (Million) Forecast, by Application 2019 & 2032
- Table 90: United Arab Emirates Atomic Layer Deposition Equipment Market Volume (K Unit) Forecast, by Application 2019 & 2032
- Table 91: Saudi Arabia Atomic Layer Deposition Equipment Market Revenue (Million) Forecast, by Application 2019 & 2032
- Table 92: Saudi Arabia Atomic Layer Deposition Equipment Market Volume (K Unit) Forecast, by Application 2019 & 2032
- Table 93: South Africa Atomic Layer Deposition Equipment Market Revenue (Million) Forecast, by Application 2019 & 2032
- Table 94: South Africa Atomic Layer Deposition Equipment Market Volume (K Unit) Forecast, by Application 2019 & 2032
- Table 95: Rest of Middle East and Africa Atomic Layer Deposition Equipment Market Revenue (Million) Forecast, by Application 2019 & 2032
- Table 96: Rest of Middle East and Africa Atomic Layer Deposition Equipment Market Volume (K Unit) Forecast, by Application 2019 & 2032
- Table 97: Global Atomic Layer Deposition Equipment Market Revenue Million Forecast, by Application 2019 & 2032
- Table 98: Global Atomic Layer Deposition Equipment Market Volume K Unit Forecast, by Application 2019 & 2032
- Table 99: Global Atomic Layer Deposition Equipment Market Revenue Million Forecast, by Country 2019 & 2032
- Table 100: Global Atomic Layer Deposition Equipment Market Volume K Unit Forecast, by Country 2019 & 2032
- Table 101: Global Atomic Layer Deposition Equipment Market Revenue Million Forecast, by Application 2019 & 2032
- Table 102: Global Atomic Layer Deposition Equipment Market Volume K Unit Forecast, by Application 2019 & 2032
- Table 103: Global Atomic Layer Deposition Equipment Market Revenue Million Forecast, by Country 2019 & 2032
- Table 104: Global Atomic Layer Deposition Equipment Market Volume K Unit Forecast, by Country 2019 & 2032
- Table 105: Global Atomic Layer Deposition Equipment Market Revenue Million Forecast, by Application 2019 & 2032
- Table 106: Global Atomic Layer Deposition Equipment Market Volume K Unit Forecast, by Application 2019 & 2032
- Table 107: Global Atomic Layer Deposition Equipment Market Revenue Million Forecast, by Country 2019 & 2032
- Table 108: Global Atomic Layer Deposition Equipment Market Volume K Unit Forecast, by Country 2019 & 2032
- Table 109: Global Atomic Layer Deposition Equipment Market Revenue Million Forecast, by Application 2019 & 2032
- Table 110: Global Atomic Layer Deposition Equipment Market Volume K Unit Forecast, by Application 2019 & 2032
- Table 111: Global Atomic Layer Deposition Equipment Market Revenue Million Forecast, by Country 2019 & 2032
- Table 112: Global Atomic Layer Deposition Equipment Market Volume K Unit Forecast, by Country 2019 & 2032
- Table 113: Global Atomic Layer Deposition Equipment Market Revenue Million Forecast, by Application 2019 & 2032
- Table 114: Global Atomic Layer Deposition Equipment Market Volume K Unit Forecast, by Application 2019 & 2032
- Table 115: Global Atomic Layer Deposition Equipment Market Revenue Million Forecast, by Country 2019 & 2032
- Table 116: Global Atomic Layer Deposition Equipment Market Volume K Unit Forecast, by Country 2019 & 2032
Frequently Asked Questions
1. What is the projected Compound Annual Growth Rate (CAGR) of the Atomic Layer Deposition Equipment Market?
The projected CAGR is approximately 17.02%.
2. Which companies are prominent players in the Atomic Layer Deposition Equipment Market?
Key companies in the market include Lam Research Corporation, Veeco Instruments Inc, Beneq Oy, Applied Materials Inc, ASM International, Kurt J Lesker Company, Tokyo Electron Limited, Oxford Instruments PLC, Entegris Inc, Picosun Oy.
3. What are the main segments of the Atomic Layer Deposition Equipment Market?
The market segments include Application.
4. Can you provide details about the market size?
The market size is estimated to be USD 9.17 Million as of 2022.
5. What are some drivers contributing to market growth?
Increase in demand of Microelectronics and Consumer Electronics; Advancement in Computing and Storage Technologies.
6. What are the notable trends driving market growth?
Semiconductors and Electronics Industry to Drive the Market Growth.
7. Are there any restraints impacting market growth?
Dynamic Nature of Technologies Requires Several Changes in Manufacturing Equipment.
8. Can you provide examples of recent developments in the market?
Februray 2024 - ASMS the finest technique available in the market where, the growth of generative AI is fueling the need of advanced chips and memory, structured on sub-3 nm nodes where ALD excels, This technology is essential for manufacturing high-end chips and accounts for half of its equipment revenues. The company has recently gained momentum in Silicon Epitaxy and entered the fast-growing Silicon Carbide.
9. What pricing options are available for accessing the report?
Pricing options include single-user, multi-user, and enterprise licenses priced at USD 4750, USD 5250, and USD 8750 respectively.
10. Is the market size provided in terms of value or volume?
The market size is provided in terms of value, measured in Million and volume, measured in K Unit.
11. Are there any specific market keywords associated with the report?
Yes, the market keyword associated with the report is "Atomic Layer Deposition Equipment Market," which aids in identifying and referencing the specific market segment covered.
12. How do I determine which pricing option suits my needs best?
The pricing options vary based on user requirements and access needs. Individual users may opt for single-user licenses, while businesses requiring broader access may choose multi-user or enterprise licenses for cost-effective access to the report.
13. Are there any additional resources or data provided in the Atomic Layer Deposition Equipment Market report?
While the report offers comprehensive insights, it's advisable to review the specific contents or supplementary materials provided to ascertain if additional resources or data are available.
14. How can I stay updated on further developments or reports in the Atomic Layer Deposition Equipment Market?
To stay informed about further developments, trends, and reports in the Atomic Layer Deposition Equipment Market, consider subscribing to industry newsletters, following relevant companies and organizations, or regularly checking reputable industry news sources and publications.
Methodology
Step 1 - Identification of Relevant Samples Size from Population Database


Step 2 - Approaches for Defining Global Market Size (Value, Volume* & Price*)

Note*: In applicable scenarios
Step 3 - Data Sources
Primary Research
- Web Analytics
- Survey Reports
- Research Institute
- Latest Research Reports
- Opinion Leaders
Secondary Research
- Annual Reports
- White Paper
- Latest Press Release
- Industry Association
- Paid Database
- Investor Presentations

Step 4 - Data Triangulation
Involves using different sources of information in order to increase the validity of a study
These sources are likely to be stakeholders in a program - participants, other researchers, program staff, other community members, and so on.
Then we put all data in single framework & apply various statistical tools to find out the dynamic on the market.
During the analysis stage, feedback from the stakeholder groups would be compared to determine areas of agreement as well as areas of divergence


