

Key Insights
The global atopic dermatitis (AD) drugs market, valued at approximately $12.1 billion in 2024, is projected for significant expansion, forecasting a compound annual growth rate (CAGR) of 9.9% from 2024 to 2033. This growth is propelled by an increasing prevalence of AD, especially among pediatric and young adult populations, driving demand for advanced treatments. Enhanced AD awareness and improved diagnostic capabilities facilitate earlier intervention. The market is also shaped by the continuous introduction of novel therapies, including biologics and targeted treatments, offering superior efficacy and safety profiles over conventional options such as glucocorticoids and immunosuppressants. Topical treatments currently hold a substantial market share due to their ease of use and minimized systemic adverse effects. However, injectable therapies are experiencing rapid adoption for their enhanced efficacy in severe AD cases. North America and Europe lead market presence, supported by robust healthcare spending and high awareness levels. Emerging economies in Asia-Pacific present considerable growth potential, driven by rising prevalence and evolving healthcare infrastructures.
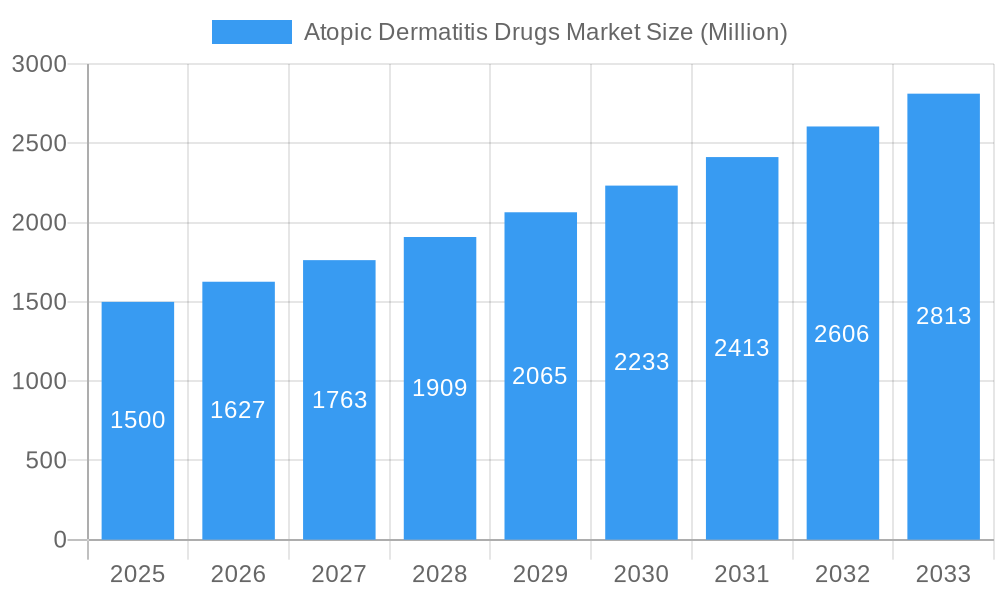
Atopic Dermatitis Drugs Market Market Size (In Billion)
Intense market competition is characterized by key players focusing on R&D for innovative AD therapies and expanding global reach through strategic partnerships and acquisitions. Market restraints include the high cost of novel treatments, impacting accessibility, particularly in lower-income regions, and the ongoing evaluation of long-term safety and efficacy data for newer drugs. Despite these challenges, the market outlook remains optimistic, fueled by ongoing therapeutic innovations, a deeper understanding of AD pathogenesis, and a global increase in disease prevalence. Personalized medicine, tailoring treatments to individual patient needs and disease severity, represents a key future trend. This approach, coupled with advancements in drug delivery systems and novel therapeutic modalities, is expected to significantly contribute to market growth.
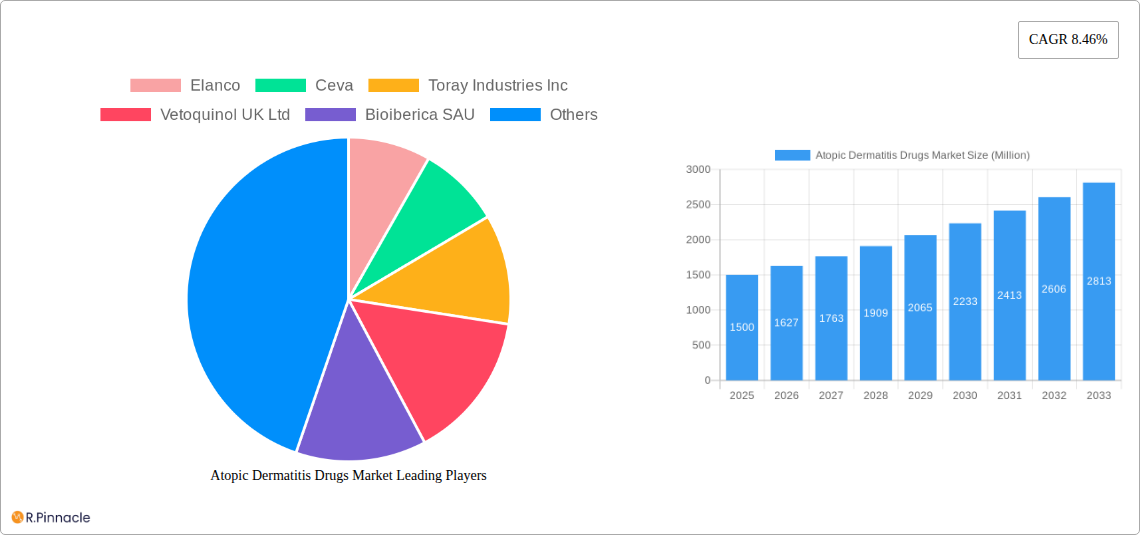
Atopic Dermatitis Drugs Market Company Market Share
Atopic Dermatitis Drugs Market: A Comprehensive Report (2019-2033)
This comprehensive report provides a detailed analysis of the Atopic Dermatitis Drugs Market, offering invaluable insights for industry professionals, investors, and researchers. Covering the period 2019-2033, with a base year of 2025 and a forecast period of 2025-2033, this report offers a granular view of market dynamics, segmentation, and future growth potential. The market is valued at xx Million in 2025 and is projected to reach xx Million by 2033, exhibiting a robust CAGR of xx%.
Atopic Dermatitis Drugs Market Market Structure & Innovation Trends
This section analyzes the competitive landscape, innovation drivers, and regulatory influences shaping the Atopic Dermatitis Drugs Market. The market exhibits a moderately consolidated structure, with key players such as Zoetis Inc, Elanco, Ceva, and Virbac holding significant market share. However, the presence of several smaller, specialized companies indicates a dynamic competitive environment.
- Market Concentration: The Herfindahl-Hirschman Index (HHI) for the market is estimated at xx, suggesting a moderately consolidated market.
- Innovation Drivers: The primary drivers of innovation include the increasing prevalence of atopic dermatitis in companion animals, the demand for more effective and safer treatments, and the ongoing research into novel therapeutic targets.
- Regulatory Frameworks: Stringent regulatory approvals for new drugs and veterinary products influence market entry and growth. Variations in regulatory pathways across different geographies create complexities for market expansion.
- Product Substitutes: Alternative treatments, such as dietary changes and lifestyle modifications, compete with pharmaceutical interventions, impacting market penetration.
- End-User Demographics: The primary end-users are veterinarians and pet owners, with the market predominantly driven by the increasing pet ownership rates globally.
- M&A Activities: The market has witnessed several M&A activities in recent years. For instance, the value of M&A deals in the past 5 years is estimated to be around xx Million. These transactions reflect strategic efforts to expand product portfolios and market reach.
Atopic Dermatitis Drugs Market Market Dynamics & Trends
The Atopic Dermatitis Drugs Market is experiencing substantial growth fueled by several factors. The increasing prevalence of atopic dermatitis in dogs and cats is a major driver, alongside rising pet ownership and expenditure on pet healthcare. Technological advancements in drug discovery and development, leading to the introduction of more effective and targeted therapies, are also contributing to market expansion. Changing consumer preferences toward premium pet care products and services further bolster market growth. The competitive landscape is marked by both established pharmaceutical companies and emerging biotech firms vying for market share, resulting in increased innovation and improved treatment options.
Dominant Regions & Segments in Atopic Dermatitis Drugs Market
Leading Regions: North America and Europe currently dominate the Atopic Dermatitis Drugs Market, driven by high pet ownership rates, strong veterinary infrastructure, and high per-capita healthcare expenditure. Asia-Pacific is projected to experience significant growth in the coming years.
Dominant Segments:
- By Treatment Type: Glucocorticoids currently hold the largest market share due to their widespread use and established efficacy, although concerns surrounding their side effects are prompting a shift towards newer treatment modalities. Immunosuppressants and monoclonal antibodies are showing strong growth potential, representing innovative therapeutic options. The "Other Treatment Types" segment shows gradual growth, influenced by the introduction of novel treatment approaches.
- By Route of Administration: Topical treatments dominate the market due to ease of application and reduced systemic side effects. Oral and Injectable treatments are also gaining traction due to their efficacy in treating severe cases.
Key Drivers (by region):
- North America: High pet ownership, well-established veterinary infrastructure, and high disposable incomes.
- Europe: Similar to North America, with the addition of robust regulatory frameworks and supportive healthcare policies.
- Asia-Pacific: Rapidly growing pet ownership, increasing awareness of pet health, and rising healthcare expenditure.
Atopic Dermatitis Drugs Market Product Innovations
Recent years have witnessed significant advancements in atopic dermatitis drug development. This includes the introduction of novel immunomodulatory agents, such as monoclonal antibodies, offering improved efficacy and reduced side effects compared to traditional glucocorticoids. The focus is on developing targeted therapies with enhanced safety profiles and improved patient compliance. This trend is aligned with growing consumer demand for safer and more effective treatment options for their pets.
Report Scope & Segmentation Analysis
This report comprehensively segments the Atopic Dermatitis Drugs Market across two key parameters:
By Treatment Type: Glucocorticoids, Immunosuppressants, Monoclonal Antibody, Other Treatment Types. Each segment’s growth trajectory is analyzed, considering market size, competitive dynamics, and projected growth rates. The Glucocorticoids segment currently holds the largest market share.
By Route of Administration: Topical, Oral, Injectable. This segmentation focuses on the different delivery methods and their respective market penetration, growth projections, and competitive landscape. Topical administration is the dominant route, followed by oral and injectable options.
Key Drivers of Atopic Dermatitis Drugs Market Growth
The Atopic Dermatitis Drugs Market is propelled by several key factors: the increasing prevalence of atopic dermatitis in companion animals, rising pet ownership rates globally, growing awareness of pet health and wellness, rising disposable incomes in developing economies, increasing investments in R&D, and the introduction of innovative drug therapies.
Challenges in the Atopic Dermatitis Drugs Market Sector
Challenges facing the market include the high cost of novel therapies, the potential for side effects associated with certain treatments, stringent regulatory approvals, and the competition from alternative treatment modalities. Supply chain disruptions due to geopolitical events could also impact market stability.
Emerging Opportunities in Atopic Dermatitis Drugs Market
Emerging opportunities lie in the development of personalized medicine approaches, the exploration of novel therapeutic targets, and expansion into untapped markets in developing economies. Furthermore, the growing demand for convenient and user-friendly drug delivery systems presents significant opportunities for innovation.
Leading Players in the Atopic Dermatitis Drugs Market Market
Key Developments in Atopic Dermatitis Drugs Market Industry
January 2023: Royal Canin North America launched SKINTOPIC, a diet for managing canine atopic dermatitis. This launch signifies the growing importance of complementary therapies in managing the condition.
January 2022: Zoetis received European Commission marketing authorization for Apoquel chewable tablets (oclacitinib) for treating atopic dermatitis in dogs (≥12 months old). This approval expanded the treatment options available for canine atopic dermatitis.
Future Outlook for Atopic Dermatitis Drugs Market Market
The Atopic Dermatitis Drugs Market is poised for continued growth, driven by ongoing research and development, the introduction of novel therapies, and the increasing demand for effective and safe treatment options. Strategic partnerships, expansion into new markets, and focus on personalized medicine are key strategies for future success in this dynamic market.
Atopic Dermatitis Drugs Market Segmentation
-
1. Treatment Type
- 1.1. Glucocorticoids
- 1.2. Immunosuppressants
- 1.3. Monoclonal Antibody
- 1.4. Other Treatment Types
-
2. Route of Administration
- 2.1. Topical
- 2.2. Oral
- 2.3. Injectable
Atopic Dermatitis Drugs Market Segmentation By Geography
-
1. North America
- 1.1. United States
- 1.2. Canada
- 1.3. Mexico
-
2. Europe
- 2.1. Germany
- 2.2. United Kingdom
- 2.3. France
- 2.4. Italy
- 2.5. Spain
- 2.6. Rest of Europe
-
3. Asia Pacific
- 3.1. China
- 3.2. Japan
- 3.3. India
- 3.4. Australia
- 3.5. South Korea
- 3.6. Rest of Asia Pacific
-
4. Middle East and Africa
- 4.1. GCC
- 4.2. South Africa
- 4.3. Rest of Middle East and Africa
-
5. South America
- 5.1. Brazil
- 5.2. Argentina
- 5.3. Rest of South America
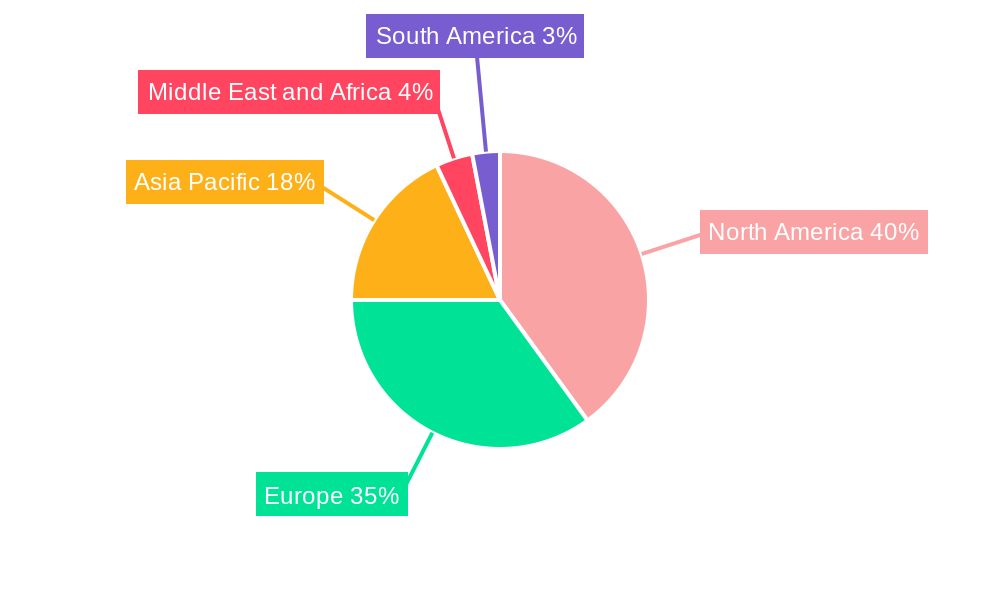
Atopic Dermatitis Drugs Market Regional Market Share
Geographic Coverage of Atopic Dermatitis Drugs Market
Atopic Dermatitis Drugs Market REPORT HIGHLIGHTS
| Aspects | Details |
|---|---|
| Study Period | 2020-2034 |
| Base Year | 2025 |
| Estimated Year | 2026 |
| Forecast Period | 2026-2034 |
| Historical Period | 2020-2025 |
| Growth Rate | CAGR of 9.9% from 2020-2034 |
| Segmentation |
|
Table of Contents
- 1. Introduction
- 1.1. Research Scope
- 1.2. Market Segmentation
- 1.3. Research Objective
- 1.4. Definitions and Assumptions
- 2. Executive Summary
- 2.1. Market Snapshot
- 3. Market Dynamics
- 3.1. Market Drivers
- 3.2. Market Restrains
- 3.3. Market Trends
- 3.4. Market Opportunities
- 4. Market Factor Analysis
- 4.1. Porters Five Forces
- 4.1.1. Bargaining Power of Suppliers
- 4.1.2. Bargaining Power of Buyers
- 4.1.3. Threat of New Entrants
- 4.1.4. Threat of Substitutes
- 4.1.5. Competitive Rivalry
- 4.2. PESTEL analysis
- 4.3. BCG Analysis
- 4.3.1. Stars (High Growth, High Market Share)
- 4.3.2. Cash Cows (Low Growth, High Market Share)
- 4.3.3. Question Mark (High Growth, Low Market Share)
- 4.3.4. Dogs (Low Growth, Low Market Share)
- 4.4. Ansoff Matrix Analysis
- 4.5. Supply Chain Analysis
- 4.6. Regulatory Landscape
- 4.7. Current Market Potential and Opportunity Assessment (TAM–SAM–SOM Framework)
- 4.8. PRI Analyst Note
- 4.1. Porters Five Forces
- 5. Market Analysis, Insights and Forecast 2021-2033
- 5.1. Market Analysis, Insights and Forecast - by Treatment Type
- 5.1.1. Glucocorticoids
- 5.1.2. Immunosuppressants
- 5.1.3. Monoclonal Antibody
- 5.1.4. Other Treatment Types
- 5.2. Market Analysis, Insights and Forecast - by Route of Administration
- 5.2.1. Topical
- 5.2.2. Oral
- 5.2.3. Injectable
- 5.3. Market Analysis, Insights and Forecast - by Region
- 5.3.1. North America
- 5.3.2. Europe
- 5.3.3. Asia Pacific
- 5.3.4. Middle East and Africa
- 5.3.5. South America
- 5.1. Market Analysis, Insights and Forecast - by Treatment Type
- 6. Global Atopic Dermatitis Drugs Market Analysis, Insights and Forecast, 2021-2033
- 6.1. Market Analysis, Insights and Forecast - by Treatment Type
- 6.1.1. Glucocorticoids
- 6.1.2. Immunosuppressants
- 6.1.3. Monoclonal Antibody
- 6.1.4. Other Treatment Types
- 6.2. Market Analysis, Insights and Forecast - by Route of Administration
- 6.2.1. Topical
- 6.2.2. Oral
- 6.2.3. Injectable
- 6.1. Market Analysis, Insights and Forecast - by Treatment Type
- 7. North America Atopic Dermatitis Drugs Market Analysis, Insights and Forecast, 2020-2032
- 7.1. Market Analysis, Insights and Forecast - by Treatment Type
- 7.1.1. Glucocorticoids
- 7.1.2. Immunosuppressants
- 7.1.3. Monoclonal Antibody
- 7.1.4. Other Treatment Types
- 7.2. Market Analysis, Insights and Forecast - by Route of Administration
- 7.2.1. Topical
- 7.2.2. Oral
- 7.2.3. Injectable
- 7.1. Market Analysis, Insights and Forecast - by Treatment Type
- 8. Europe Atopic Dermatitis Drugs Market Analysis, Insights and Forecast, 2020-2032
- 8.1. Market Analysis, Insights and Forecast - by Treatment Type
- 8.1.1. Glucocorticoids
- 8.1.2. Immunosuppressants
- 8.1.3. Monoclonal Antibody
- 8.1.4. Other Treatment Types
- 8.2. Market Analysis, Insights and Forecast - by Route of Administration
- 8.2.1. Topical
- 8.2.2. Oral
- 8.2.3. Injectable
- 8.1. Market Analysis, Insights and Forecast - by Treatment Type
- 9. Asia Pacific Atopic Dermatitis Drugs Market Analysis, Insights and Forecast, 2020-2032
- 9.1. Market Analysis, Insights and Forecast - by Treatment Type
- 9.1.1. Glucocorticoids
- 9.1.2. Immunosuppressants
- 9.1.3. Monoclonal Antibody
- 9.1.4. Other Treatment Types
- 9.2. Market Analysis, Insights and Forecast - by Route of Administration
- 9.2.1. Topical
- 9.2.2. Oral
- 9.2.3. Injectable
- 9.1. Market Analysis, Insights and Forecast - by Treatment Type
- 10. Middle East and Africa Atopic Dermatitis Drugs Market Analysis, Insights and Forecast, 2020-2032
- 10.1. Market Analysis, Insights and Forecast - by Treatment Type
- 10.1.1. Glucocorticoids
- 10.1.2. Immunosuppressants
- 10.1.3. Monoclonal Antibody
- 10.1.4. Other Treatment Types
- 10.2. Market Analysis, Insights and Forecast - by Route of Administration
- 10.2.1. Topical
- 10.2.2. Oral
- 10.2.3. Injectable
- 10.1. Market Analysis, Insights and Forecast - by Treatment Type
- 11. South America Atopic Dermatitis Drugs Market Analysis, Insights and Forecast, 2020-2032
- 11.1. Market Analysis, Insights and Forecast - by Treatment Type
- 11.1.1. Glucocorticoids
- 11.1.2. Immunosuppressants
- 11.1.3. Monoclonal Antibody
- 11.1.4. Other Treatment Types
- 11.2. Market Analysis, Insights and Forecast - by Route of Administration
- 11.2.1. Topical
- 11.2.2. Oral
- 11.2.3. Injectable
- 11.1. Market Analysis, Insights and Forecast - by Treatment Type
- 12. Competitive Analysis
- 12.1. Company Profiles
- 12.1.1 Elanco
- 12.1.1.1. Company Overview
- 12.1.1.2. Products
- 12.1.1.3. Company Financials
- 12.1.1.4. SWOT Analysis
- 12.1.2 Ceva
- 12.1.2.1. Company Overview
- 12.1.2.2. Products
- 12.1.2.3. Company Financials
- 12.1.2.4. SWOT Analysis
- 12.1.3 Toray Industries Inc
- 12.1.3.1. Company Overview
- 12.1.3.2. Products
- 12.1.3.3. Company Financials
- 12.1.3.4. SWOT Analysis
- 12.1.4 Vetoquinol UK Ltd
- 12.1.4.1. Company Overview
- 12.1.4.2. Products
- 12.1.4.3. Company Financials
- 12.1.4.4. SWOT Analysis
- 12.1.5 Bioiberica SAU
- 12.1.5.1. Company Overview
- 12.1.5.2. Products
- 12.1.5.3. Company Financials
- 12.1.5.4. SWOT Analysis
- 12.1.6 Nextmune (Vimian)
- 12.1.6.1. Company Overview
- 12.1.6.2. Products
- 12.1.6.3. Company Financials
- 12.1.6.4. SWOT Analysis
- 12.1.7 Phibro Animal Health Corporation
- 12.1.7.1. Company Overview
- 12.1.7.2. Products
- 12.1.7.3. Company Financials
- 12.1.7.4. SWOT Analysis
- 12.1.8 Virbac
- 12.1.8.1. Company Overview
- 12.1.8.2. Products
- 12.1.8.3. Company Financials
- 12.1.8.4. SWOT Analysis
- 12.1.9 Dechra Veterinary Products
- 12.1.9.1. Company Overview
- 12.1.9.2. Products
- 12.1.9.3. Company Financials
- 12.1.9.4. SWOT Analysis
- 12.1.10 Zoetis Inc
- 12.1.10.1. Company Overview
- 12.1.10.2. Products
- 12.1.10.3. Company Financials
- 12.1.10.4. SWOT Analysis
- 12.1.1 Elanco
- 12.2. Market Entropy
- 12.2.1 Company's Key Areas Served
- 12.2.2 Recent Developments
- 12.3. Company Market Share Analysis 2025
- 12.3.1 Top 5 Companies Market Share Analysis
- 12.3.2 Top 3 Companies Market Share Analysis
- 12.4. List of Potential Customers
- 13. Research Methodology
List of Figures
- Figure 1: Global Atopic Dermatitis Drugs Market Revenue Breakdown (billion, %) by Region 2025 & 2033
- Figure 2: Global Atopic Dermatitis Drugs Market Volume Breakdown (K Unit, %) by Region 2025 & 2033
- Figure 3: North America Atopic Dermatitis Drugs Market Revenue (billion), by Treatment Type 2025 & 2033
- Figure 4: North America Atopic Dermatitis Drugs Market Volume (K Unit), by Treatment Type 2025 & 2033
- Figure 5: North America Atopic Dermatitis Drugs Market Revenue Share (%), by Treatment Type 2025 & 2033
- Figure 6: North America Atopic Dermatitis Drugs Market Volume Share (%), by Treatment Type 2025 & 2033
- Figure 7: North America Atopic Dermatitis Drugs Market Revenue (billion), by Route of Administration 2025 & 2033
- Figure 8: North America Atopic Dermatitis Drugs Market Volume (K Unit), by Route of Administration 2025 & 2033
- Figure 9: North America Atopic Dermatitis Drugs Market Revenue Share (%), by Route of Administration 2025 & 2033
- Figure 10: North America Atopic Dermatitis Drugs Market Volume Share (%), by Route of Administration 2025 & 2033
- Figure 11: North America Atopic Dermatitis Drugs Market Revenue (billion), by Country 2025 & 2033
- Figure 12: North America Atopic Dermatitis Drugs Market Volume (K Unit), by Country 2025 & 2033
- Figure 13: North America Atopic Dermatitis Drugs Market Revenue Share (%), by Country 2025 & 2033
- Figure 14: North America Atopic Dermatitis Drugs Market Volume Share (%), by Country 2025 & 2033
- Figure 15: Europe Atopic Dermatitis Drugs Market Revenue (billion), by Treatment Type 2025 & 2033
- Figure 16: Europe Atopic Dermatitis Drugs Market Volume (K Unit), by Treatment Type 2025 & 2033
- Figure 17: Europe Atopic Dermatitis Drugs Market Revenue Share (%), by Treatment Type 2025 & 2033
- Figure 18: Europe Atopic Dermatitis Drugs Market Volume Share (%), by Treatment Type 2025 & 2033
- Figure 19: Europe Atopic Dermatitis Drugs Market Revenue (billion), by Route of Administration 2025 & 2033
- Figure 20: Europe Atopic Dermatitis Drugs Market Volume (K Unit), by Route of Administration 2025 & 2033
- Figure 21: Europe Atopic Dermatitis Drugs Market Revenue Share (%), by Route of Administration 2025 & 2033
- Figure 22: Europe Atopic Dermatitis Drugs Market Volume Share (%), by Route of Administration 2025 & 2033
- Figure 23: Europe Atopic Dermatitis Drugs Market Revenue (billion), by Country 2025 & 2033
- Figure 24: Europe Atopic Dermatitis Drugs Market Volume (K Unit), by Country 2025 & 2033
- Figure 25: Europe Atopic Dermatitis Drugs Market Revenue Share (%), by Country 2025 & 2033
- Figure 26: Europe Atopic Dermatitis Drugs Market Volume Share (%), by Country 2025 & 2033
- Figure 27: Asia Pacific Atopic Dermatitis Drugs Market Revenue (billion), by Treatment Type 2025 & 2033
- Figure 28: Asia Pacific Atopic Dermatitis Drugs Market Volume (K Unit), by Treatment Type 2025 & 2033
- Figure 29: Asia Pacific Atopic Dermatitis Drugs Market Revenue Share (%), by Treatment Type 2025 & 2033
- Figure 30: Asia Pacific Atopic Dermatitis Drugs Market Volume Share (%), by Treatment Type 2025 & 2033
- Figure 31: Asia Pacific Atopic Dermatitis Drugs Market Revenue (billion), by Route of Administration 2025 & 2033
- Figure 32: Asia Pacific Atopic Dermatitis Drugs Market Volume (K Unit), by Route of Administration 2025 & 2033
- Figure 33: Asia Pacific Atopic Dermatitis Drugs Market Revenue Share (%), by Route of Administration 2025 & 2033
- Figure 34: Asia Pacific Atopic Dermatitis Drugs Market Volume Share (%), by Route of Administration 2025 & 2033
- Figure 35: Asia Pacific Atopic Dermatitis Drugs Market Revenue (billion), by Country 2025 & 2033
- Figure 36: Asia Pacific Atopic Dermatitis Drugs Market Volume (K Unit), by Country 2025 & 2033
- Figure 37: Asia Pacific Atopic Dermatitis Drugs Market Revenue Share (%), by Country 2025 & 2033
- Figure 38: Asia Pacific Atopic Dermatitis Drugs Market Volume Share (%), by Country 2025 & 2033
- Figure 39: Middle East and Africa Atopic Dermatitis Drugs Market Revenue (billion), by Treatment Type 2025 & 2033
- Figure 40: Middle East and Africa Atopic Dermatitis Drugs Market Volume (K Unit), by Treatment Type 2025 & 2033
- Figure 41: Middle East and Africa Atopic Dermatitis Drugs Market Revenue Share (%), by Treatment Type 2025 & 2033
- Figure 42: Middle East and Africa Atopic Dermatitis Drugs Market Volume Share (%), by Treatment Type 2025 & 2033
- Figure 43: Middle East and Africa Atopic Dermatitis Drugs Market Revenue (billion), by Route of Administration 2025 & 2033
- Figure 44: Middle East and Africa Atopic Dermatitis Drugs Market Volume (K Unit), by Route of Administration 2025 & 2033
- Figure 45: Middle East and Africa Atopic Dermatitis Drugs Market Revenue Share (%), by Route of Administration 2025 & 2033
- Figure 46: Middle East and Africa Atopic Dermatitis Drugs Market Volume Share (%), by Route of Administration 2025 & 2033
- Figure 47: Middle East and Africa Atopic Dermatitis Drugs Market Revenue (billion), by Country 2025 & 2033
- Figure 48: Middle East and Africa Atopic Dermatitis Drugs Market Volume (K Unit), by Country 2025 & 2033
- Figure 49: Middle East and Africa Atopic Dermatitis Drugs Market Revenue Share (%), by Country 2025 & 2033
- Figure 50: Middle East and Africa Atopic Dermatitis Drugs Market Volume Share (%), by Country 2025 & 2033
- Figure 51: South America Atopic Dermatitis Drugs Market Revenue (billion), by Treatment Type 2025 & 2033
- Figure 52: South America Atopic Dermatitis Drugs Market Volume (K Unit), by Treatment Type 2025 & 2033
- Figure 53: South America Atopic Dermatitis Drugs Market Revenue Share (%), by Treatment Type 2025 & 2033
- Figure 54: South America Atopic Dermatitis Drugs Market Volume Share (%), by Treatment Type 2025 & 2033
- Figure 55: South America Atopic Dermatitis Drugs Market Revenue (billion), by Route of Administration 2025 & 2033
- Figure 56: South America Atopic Dermatitis Drugs Market Volume (K Unit), by Route of Administration 2025 & 2033
- Figure 57: South America Atopic Dermatitis Drugs Market Revenue Share (%), by Route of Administration 2025 & 2033
- Figure 58: South America Atopic Dermatitis Drugs Market Volume Share (%), by Route of Administration 2025 & 2033
- Figure 59: South America Atopic Dermatitis Drugs Market Revenue (billion), by Country 2025 & 2033
- Figure 60: South America Atopic Dermatitis Drugs Market Volume (K Unit), by Country 2025 & 2033
- Figure 61: South America Atopic Dermatitis Drugs Market Revenue Share (%), by Country 2025 & 2033
- Figure 62: South America Atopic Dermatitis Drugs Market Volume Share (%), by Country 2025 & 2033
List of Tables
- Table 1: Global Atopic Dermatitis Drugs Market Revenue billion Forecast, by Treatment Type 2020 & 2033
- Table 2: Global Atopic Dermatitis Drugs Market Volume K Unit Forecast, by Treatment Type 2020 & 2033
- Table 3: Global Atopic Dermatitis Drugs Market Revenue billion Forecast, by Route of Administration 2020 & 2033
- Table 4: Global Atopic Dermatitis Drugs Market Volume K Unit Forecast, by Route of Administration 2020 & 2033
- Table 5: Global Atopic Dermatitis Drugs Market Revenue billion Forecast, by Region 2020 & 2033
- Table 6: Global Atopic Dermatitis Drugs Market Volume K Unit Forecast, by Region 2020 & 2033
- Table 7: Global Atopic Dermatitis Drugs Market Revenue billion Forecast, by Treatment Type 2020 & 2033
- Table 8: Global Atopic Dermatitis Drugs Market Volume K Unit Forecast, by Treatment Type 2020 & 2033
- Table 9: Global Atopic Dermatitis Drugs Market Revenue billion Forecast, by Route of Administration 2020 & 2033
- Table 10: Global Atopic Dermatitis Drugs Market Volume K Unit Forecast, by Route of Administration 2020 & 2033
- Table 11: Global Atopic Dermatitis Drugs Market Revenue billion Forecast, by Country 2020 & 2033
- Table 12: Global Atopic Dermatitis Drugs Market Volume K Unit Forecast, by Country 2020 & 2033
- Table 13: United States Atopic Dermatitis Drugs Market Revenue (billion) Forecast, by Application 2020 & 2033
- Table 14: United States Atopic Dermatitis Drugs Market Volume (K Unit) Forecast, by Application 2020 & 2033
- Table 15: Canada Atopic Dermatitis Drugs Market Revenue (billion) Forecast, by Application 2020 & 2033
- Table 16: Canada Atopic Dermatitis Drugs Market Volume (K Unit) Forecast, by Application 2020 & 2033
- Table 17: Mexico Atopic Dermatitis Drugs Market Revenue (billion) Forecast, by Application 2020 & 2033
- Table 18: Mexico Atopic Dermatitis Drugs Market Volume (K Unit) Forecast, by Application 2020 & 2033
- Table 19: Global Atopic Dermatitis Drugs Market Revenue billion Forecast, by Treatment Type 2020 & 2033
- Table 20: Global Atopic Dermatitis Drugs Market Volume K Unit Forecast, by Treatment Type 2020 & 2033
- Table 21: Global Atopic Dermatitis Drugs Market Revenue billion Forecast, by Route of Administration 2020 & 2033
- Table 22: Global Atopic Dermatitis Drugs Market Volume K Unit Forecast, by Route of Administration 2020 & 2033
- Table 23: Global Atopic Dermatitis Drugs Market Revenue billion Forecast, by Country 2020 & 2033
- Table 24: Global Atopic Dermatitis Drugs Market Volume K Unit Forecast, by Country 2020 & 2033
- Table 25: Germany Atopic Dermatitis Drugs Market Revenue (billion) Forecast, by Application 2020 & 2033
- Table 26: Germany Atopic Dermatitis Drugs Market Volume (K Unit) Forecast, by Application 2020 & 2033
- Table 27: United Kingdom Atopic Dermatitis Drugs Market Revenue (billion) Forecast, by Application 2020 & 2033
- Table 28: United Kingdom Atopic Dermatitis Drugs Market Volume (K Unit) Forecast, by Application 2020 & 2033
- Table 29: France Atopic Dermatitis Drugs Market Revenue (billion) Forecast, by Application 2020 & 2033
- Table 30: France Atopic Dermatitis Drugs Market Volume (K Unit) Forecast, by Application 2020 & 2033
- Table 31: Italy Atopic Dermatitis Drugs Market Revenue (billion) Forecast, by Application 2020 & 2033
- Table 32: Italy Atopic Dermatitis Drugs Market Volume (K Unit) Forecast, by Application 2020 & 2033
- Table 33: Spain Atopic Dermatitis Drugs Market Revenue (billion) Forecast, by Application 2020 & 2033
- Table 34: Spain Atopic Dermatitis Drugs Market Volume (K Unit) Forecast, by Application 2020 & 2033
- Table 35: Rest of Europe Atopic Dermatitis Drugs Market Revenue (billion) Forecast, by Application 2020 & 2033
- Table 36: Rest of Europe Atopic Dermatitis Drugs Market Volume (K Unit) Forecast, by Application 2020 & 2033
- Table 37: Global Atopic Dermatitis Drugs Market Revenue billion Forecast, by Treatment Type 2020 & 2033
- Table 38: Global Atopic Dermatitis Drugs Market Volume K Unit Forecast, by Treatment Type 2020 & 2033
- Table 39: Global Atopic Dermatitis Drugs Market Revenue billion Forecast, by Route of Administration 2020 & 2033
- Table 40: Global Atopic Dermatitis Drugs Market Volume K Unit Forecast, by Route of Administration 2020 & 2033
- Table 41: Global Atopic Dermatitis Drugs Market Revenue billion Forecast, by Country 2020 & 2033
- Table 42: Global Atopic Dermatitis Drugs Market Volume K Unit Forecast, by Country 2020 & 2033
- Table 43: China Atopic Dermatitis Drugs Market Revenue (billion) Forecast, by Application 2020 & 2033
- Table 44: China Atopic Dermatitis Drugs Market Volume (K Unit) Forecast, by Application 2020 & 2033
- Table 45: Japan Atopic Dermatitis Drugs Market Revenue (billion) Forecast, by Application 2020 & 2033
- Table 46: Japan Atopic Dermatitis Drugs Market Volume (K Unit) Forecast, by Application 2020 & 2033
- Table 47: India Atopic Dermatitis Drugs Market Revenue (billion) Forecast, by Application 2020 & 2033
- Table 48: India Atopic Dermatitis Drugs Market Volume (K Unit) Forecast, by Application 2020 & 2033
- Table 49: Australia Atopic Dermatitis Drugs Market Revenue (billion) Forecast, by Application 2020 & 2033
- Table 50: Australia Atopic Dermatitis Drugs Market Volume (K Unit) Forecast, by Application 2020 & 2033
- Table 51: South Korea Atopic Dermatitis Drugs Market Revenue (billion) Forecast, by Application 2020 & 2033
- Table 52: South Korea Atopic Dermatitis Drugs Market Volume (K Unit) Forecast, by Application 2020 & 2033
- Table 53: Rest of Asia Pacific Atopic Dermatitis Drugs Market Revenue (billion) Forecast, by Application 2020 & 2033
- Table 54: Rest of Asia Pacific Atopic Dermatitis Drugs Market Volume (K Unit) Forecast, by Application 2020 & 2033
- Table 55: Global Atopic Dermatitis Drugs Market Revenue billion Forecast, by Treatment Type 2020 & 2033
- Table 56: Global Atopic Dermatitis Drugs Market Volume K Unit Forecast, by Treatment Type 2020 & 2033
- Table 57: Global Atopic Dermatitis Drugs Market Revenue billion Forecast, by Route of Administration 2020 & 2033
- Table 58: Global Atopic Dermatitis Drugs Market Volume K Unit Forecast, by Route of Administration 2020 & 2033
- Table 59: Global Atopic Dermatitis Drugs Market Revenue billion Forecast, by Country 2020 & 2033
- Table 60: Global Atopic Dermatitis Drugs Market Volume K Unit Forecast, by Country 2020 & 2033
- Table 61: GCC Atopic Dermatitis Drugs Market Revenue (billion) Forecast, by Application 2020 & 2033
- Table 62: GCC Atopic Dermatitis Drugs Market Volume (K Unit) Forecast, by Application 2020 & 2033
- Table 63: South Africa Atopic Dermatitis Drugs Market Revenue (billion) Forecast, by Application 2020 & 2033
- Table 64: South Africa Atopic Dermatitis Drugs Market Volume (K Unit) Forecast, by Application 2020 & 2033
- Table 65: Rest of Middle East and Africa Atopic Dermatitis Drugs Market Revenue (billion) Forecast, by Application 2020 & 2033
- Table 66: Rest of Middle East and Africa Atopic Dermatitis Drugs Market Volume (K Unit) Forecast, by Application 2020 & 2033
- Table 67: Global Atopic Dermatitis Drugs Market Revenue billion Forecast, by Treatment Type 2020 & 2033
- Table 68: Global Atopic Dermatitis Drugs Market Volume K Unit Forecast, by Treatment Type 2020 & 2033
- Table 69: Global Atopic Dermatitis Drugs Market Revenue billion Forecast, by Route of Administration 2020 & 2033
- Table 70: Global Atopic Dermatitis Drugs Market Volume K Unit Forecast, by Route of Administration 2020 & 2033
- Table 71: Global Atopic Dermatitis Drugs Market Revenue billion Forecast, by Country 2020 & 2033
- Table 72: Global Atopic Dermatitis Drugs Market Volume K Unit Forecast, by Country 2020 & 2033
- Table 73: Brazil Atopic Dermatitis Drugs Market Revenue (billion) Forecast, by Application 2020 & 2033
- Table 74: Brazil Atopic Dermatitis Drugs Market Volume (K Unit) Forecast, by Application 2020 & 2033
- Table 75: Argentina Atopic Dermatitis Drugs Market Revenue (billion) Forecast, by Application 2020 & 2033
- Table 76: Argentina Atopic Dermatitis Drugs Market Volume (K Unit) Forecast, by Application 2020 & 2033
- Table 77: Rest of South America Atopic Dermatitis Drugs Market Revenue (billion) Forecast, by Application 2020 & 2033
- Table 78: Rest of South America Atopic Dermatitis Drugs Market Volume (K Unit) Forecast, by Application 2020 & 2033
Frequently Asked Questions
1. What is the projected Compound Annual Growth Rate (CAGR) of the Atopic Dermatitis Drugs Market?
The projected CAGR is approximately 9.9%.
2. Which companies are prominent players in the Atopic Dermatitis Drugs Market?
Key companies in the market include Elanco, Ceva, Toray Industries Inc, Vetoquinol UK Ltd, Bioiberica SAU, Nextmune (Vimian), Phibro Animal Health Corporation, Virbac, Dechra Veterinary Products, Zoetis Inc.
3. What are the main segments of the Atopic Dermatitis Drugs Market?
The market segments include Treatment Type, Route of Administration.
4. Can you provide details about the market size?
The market size is estimated to be USD 12.1 billion as of 2022.
5. What are some drivers contributing to market growth?
Rising Pollution Related to Allergens; Increasing Dog Ownership.
6. What are the notable trends driving market growth?
Monoclonal Antibody Segment Expected to Exhibit Significant Market Growth Over the Forecast Period.
7. Are there any restraints impacting market growth?
Usage of Off-label Drugs.
8. Can you provide examples of recent developments in the market?
In January 2023, Royal Canin North America launched the SKINTOPIC, a diet for the management of canine atopic dermatitis.
9. What pricing options are available for accessing the report?
Pricing options include single-user, multi-user, and enterprise licenses priced at USD 4750, USD 5250, and USD 8750 respectively.
10. Is the market size provided in terms of value or volume?
The market size is provided in terms of value, measured in billion and volume, measured in K Unit.
11. Are there any specific market keywords associated with the report?
Yes, the market keyword associated with the report is "Atopic Dermatitis Drugs Market," which aids in identifying and referencing the specific market segment covered.
12. How do I determine which pricing option suits my needs best?
The pricing options vary based on user requirements and access needs. Individual users may opt for single-user licenses, while businesses requiring broader access may choose multi-user or enterprise licenses for cost-effective access to the report.
13. Are there any additional resources or data provided in the Atopic Dermatitis Drugs Market report?
While the report offers comprehensive insights, it's advisable to review the specific contents or supplementary materials provided to ascertain if additional resources or data are available.
14. How can I stay updated on further developments or reports in the Atopic Dermatitis Drugs Market?
To stay informed about further developments, trends, and reports in the Atopic Dermatitis Drugs Market, consider subscribing to industry newsletters, following relevant companies and organizations, or regularly checking reputable industry news sources and publications.
Methodology
Step 1 - Identification of Relevant Samples Size from Population Database


Step 2 - Approaches for Defining Global Market Size (Value, Volume* & Price*)

Note*: In applicable scenarios
Step 3 - Data Sources
Primary Research
- Web Analytics
- Survey Reports
- Research Institute
- Latest Research Reports
- Opinion Leaders
Secondary Research
- Annual Reports
- White Paper
- Latest Press Release
- Industry Association
- Paid Database
- Investor Presentations

Step 4 - Data Triangulation
Involves using different sources of information in order to increase the validity of a study
These sources are likely to be stakeholders in a program - participants, other researchers, program staff, other community members, and so on.
Then we put all data in single framework & apply various statistical tools to find out the dynamic on the market.
During the analysis stage, feedback from the stakeholder groups would be compared to determine areas of agreement as well as areas of divergence