
Key Insights
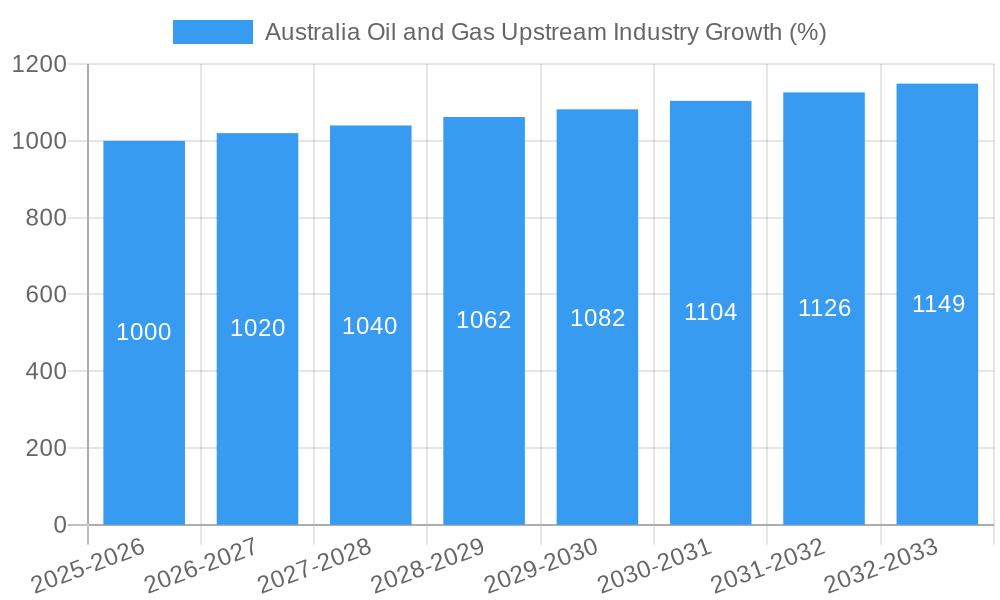
The Australian oil and gas upstream industry, encompassing onshore and offshore operations, presents a dynamic market landscape characterized by a compound annual growth rate (CAGR) exceeding 2% from 2019 to 2033. The market size in 2025 is estimated to be significant, driven by consistent domestic demand and strategic export opportunities to Asian markets. Key drivers include sustained energy needs, government support for energy security, and ongoing exploration and development activities targeting new reserves, particularly offshore. However, the industry faces certain constraints including environmental regulations aimed at reducing carbon emissions, fluctuating global energy prices, and the increasing focus on renewable energy sources. Segment-wise, offshore oil and gas production contributes a larger share of the overall market value compared to onshore operations due to the presence of substantial reserves and advanced infrastructure. Major players like Santos Limited, Woodside Petroleum Limited, Shell PLC, and ExxonMobil Corporation are pivotal in shaping the industry's trajectory through strategic investments, technological advancements, and operational efficiency initiatives. The industry's future growth will hinge on balancing energy security needs with environmental sustainability goals.
The forecast period (2025-2033) anticipates continued growth, though at a potentially moderated pace compared to the historical period (2019-2024), reflective of evolving global energy priorities. Technological innovation, particularly in areas such as enhanced oil recovery and carbon capture, utilization, and storage (CCUS), will play a critical role in sustaining profitability and competitiveness. The Australian government's policies related to energy transition and emissions reduction will strongly influence investment decisions and long-term sector outlook. The industry's resilience will depend on adaptability to changing regulatory frameworks and the ability to attract and retain investment in a competitive global landscape. Competitive dynamics are expected to remain intense, with industry giants vying for market share while facing increased pressure from smaller, more agile players that focus on niche segments.

Australia Oil and Gas Upstream Industry: A Comprehensive Market Report (2019-2033)
This in-depth report provides a comprehensive analysis of the Australian oil and gas upstream industry, covering market structure, dynamics, key players, and future outlook. The study period spans from 2019 to 2033, with 2025 as the base and estimated year. This report is invaluable for industry professionals, investors, and anyone seeking to understand this dynamic sector.
Australia Oil and Gas Upstream Industry Market Structure & Innovation Trends
This section analyzes the competitive landscape of the Australian oil and gas upstream market, examining market concentration, innovation drivers, regulatory frameworks, and M&A activities. The report covers the historical period (2019-2024) and forecasts the market through 2033.
Market Concentration: The Australian upstream oil and gas sector is characterized by a relatively concentrated market, with several major players holding significant market share. Santos Limited, Woodside Petroleum Limited, and BHP Group PLC are among the key players, collectively controlling an estimated xx% of the market in 2025. Smaller companies compete for remaining market share.
Innovation Drivers: Technological advancements, particularly in subsea technologies and data analytics, are driving innovation. The push for increased efficiency, reduced environmental impact, and improved safety are key drivers of R&D investment.
Regulatory Framework: The Australian government’s regulatory framework significantly influences industry operations. Regulations concerning environmental protection, safety, and resource management shape investment decisions and operational practices.
Product Substitutes: The market faces competition from renewable energy sources, particularly solar and wind power. The growth of renewable energy presents challenges to oil and gas companies.
End-User Demographics: Demand for oil and gas is driven primarily by the industrial sector, transportation, and residential consumption. Changing consumer preferences and government policies promoting energy efficiency and renewable energy could significantly impact future demand.
M&A Activity: The sector has witnessed considerable M&A activity in recent years, with deal values totaling approximately xx Million AUD in the period 2019-2024. These mergers and acquisitions reflect consolidation trends and the pursuit of synergies within the industry.
Australia Oil and Gas Upstream Industry Market Dynamics & Trends
This section details the market dynamics and trends influencing the Australian upstream oil and gas sector, encompassing market growth, technological disruptions, consumer preferences, and competitive dynamics. The report projects a CAGR of xx% for the forecast period (2025-2033). Market penetration of various technologies is also analyzed, including subsea production systems and advanced drilling techniques.
Dominant Regions & Segments in Australia Oil and Gas Upstream Industry
The Australian oil and gas upstream sector is a dynamic and complex industry, characterized by a strong presence of both onshore and offshore operations, with a significant focus on oil and gas production. This analysis delves into the leading regions and segments, highlighting key trends and growth drivers.
Offshore Dominance: Offshore operations continue to be the cornerstone of Australia's oil and gas production, accounting for a substantial majority (Specific percentage data for 2025 should be inserted here, if available. Otherwise, a phrase like "a significant majority" or "over 80%" based on reliable data source should be used) of total output. This dominance stems from the vast offshore reserves discovered in various basins across the Australian continental shelf, coupled with the substantial existing infrastructure in place for extraction, processing, and transportation.
Key Drivers of Offshore Dominance:
- Extensive and prolific offshore reserves, particularly in regions like the North West Shelf and Bass Strait.
- Well-established infrastructure including pipelines, processing facilities, and export terminals, minimizing capital expenditure for new projects.
- Supportive government policies and regulatory frameworks that encourage exploration and production activities in offshore areas.
- Technological advancements in deepwater exploration and extraction techniques, enabling access to previously inaccessible resources.
Gas Segment Growth: The gas segment is experiencing robust growth, projected to outpace the oil segment over the coming years. This growth is predominantly fueled by the surging global demand for liquefied natural gas (LNG) and steady domestic consumption.
Key Drivers of Gas Segment Growth:
- Strong export demand for LNG, especially from Asian markets experiencing rapid economic growth and increasing energy needs.
- Rising domestic gas demand driven by industrial and residential sectors.
- Significant investments in new LNG projects and infrastructure upgrades to increase production and export capacity.
- Government initiatives promoting gas development to ensure energy security and economic growth.
Onshore Activity: While offshore operations dominate, onshore activities contribute significantly, particularly in areas with established conventional fields and emerging unconventional resources like shale gas (providing details on specific areas here would enrich the content).
Australia Oil and Gas Upstream Industry Product Innovations
Technological advancements are transforming the Australian oil and gas upstream industry. The adoption of advanced technologies such as Artificial Intelligence (AI) and advanced subsea compression systems is enhancing efficiency, safety, and production. The Augmented Machine Vision Solution (AMVS), developed by Wood and NERA, exemplifies this trend, improving inspection processes and reducing costs.
Report Scope & Segmentation Analysis
This report segments the Australian oil and gas upstream industry by product (oil and gas) and location of deployment (onshore and offshore). Each segment's growth projections, market size, and competitive dynamics are detailed. Market size projections for 2025 and 2033 for each segment are included in the full report.
Key Drivers of Australia Oil and Gas Upstream Industry Growth
Growth in the Australian oil and gas upstream sector is driven by several factors: increasing global energy demand, technological advancements leading to higher efficiency and lower production costs, and government policies supporting energy security. The ongoing exploration and development of new reserves contribute to future growth.
Challenges in the Australia Oil and Gas Upstream Industry Sector
The Australian oil and gas upstream sector faces a multitude of challenges that impact profitability, investment decisions, and long-term sustainability. These include the inherent volatility of global oil and gas prices, escalating environmental regulations aimed at reducing greenhouse gas emissions, and the potential for supply chain disruptions. Furthermore, increasing competition from renewable energy sources, particularly solar and wind power, exerts considerable pressure on the market share and investment attractiveness of fossil fuels. Geopolitical factors and global economic uncertainty also play significant roles. Managing these challenges requires a strategic approach combining operational efficiency, technological innovation, and proactive engagement with stakeholders.
Emerging Opportunities in Australia Oil and Gas Upstream Industry
Opportunities exist in the development of new technologies, such as carbon capture and storage (CCS), and the exploration of new reserves. Furthermore, the increasing demand for LNG presents significant export opportunities.
Leading Players in the Australia Oil and Gas Upstream Industry Market
- Santos Limited
- Woodside Energy Group
- Shell PLC
- ExxonMobil Corporation
- Caltex Australia Limited (now Ampol)
- BHP Group PLC
- Origin Energy Limited
- Chevron Corporation
- BP PLC
- TotalEnergies SE
Key Developments in Australia Oil and Gas Upstream Industry Industry
- September 2021: Wood and NERA partnered to develop the Augmented Machine Vision Solution (AMVS) for improved subsea infrastructure inspection, showcasing the industry's commitment to technological advancement for enhanced efficiency and safety.
- August 2021: Chevron awarded a USD 6 Billion contract to Worley for the Jansz-lo Compression project in Western Australia, implementing advanced subsea compression technology to boost production capacity and extend the lifespan of existing assets. This highlights significant investments in advanced technology for maximizing production from established fields.
- Add more recent key developments here with dates and brief descriptions, focusing on significant investments, technological advancements, and mergers/acquisitions. Include sources where possible.
Future Outlook for Australia Oil and Gas Upstream Industry Market
The future of Australia's oil and gas upstream market is intertwined with global energy demand, technological innovation, and environmental considerations. While continued growth is anticipated, driven by exploration of new reserves and technological advancements that improve efficiency and reduce environmental impact, the sector faces significant challenges. Navigating increasingly stringent environmental regulations, competing with renewable energy sources, and adapting to evolving global energy markets will be critical for long-term sustainability. Strategic investments in carbon capture, utilization, and storage (CCUS) technologies, as well as exploration of lower-emission energy sources, will play a crucial role in shaping the future of the industry. A focus on innovation and diversification will be essential for maximizing future market potential and ensuring a responsible energy future for Australia.
Australia Oil and Gas Upstream Industry Segmentation
- 1. Onshore
- 2. Offshore
Australia Oil and Gas Upstream Industry Segmentation By Geography
- 1. Australia

Australia Oil and Gas Upstream Industry REPORT HIGHLIGHTS
| Aspects | Details |
|---|---|
| Study Period | 2019-2033 |
| Base Year | 2024 |
| Estimated Year | 2025 |
| Forecast Period | 2025-2033 |
| Historical Period | 2019-2024 |
| Growth Rate | CAGR of > 2.00% from 2019-2033 |
| Segmentation |
|
Table of Contents
- 1. Introduction
- 1.1. Research Scope
- 1.2. Market Segmentation
- 1.3. Research Methodology
- 1.4. Definitions and Assumptions
- 2. Executive Summary
- 2.1. Introduction
- 3. Market Dynamics
- 3.1. Introduction
- 3.2. Market Drivers
- 3.2.1. 4.; Modernization and Upgrades of Existing Military Aircraft Fleets4.; Increasing Defense Budgets
- 3.3. Market Restrains
- 3.3.1. 4.; Shift Toward Unmanned Aircraft
- 3.4. Market Trends
- 3.4.1. Offshore Segment to Dominate the Market
- 4. Market Factor Analysis
- 4.1. Porters Five Forces
- 4.2. Supply/Value Chain
- 4.3. PESTEL analysis
- 4.4. Market Entropy
- 4.5. Patent/Trademark Analysis
- 5. Australia Oil and Gas Upstream Industry Analysis, Insights and Forecast, 2019-2031
- 5.1. Market Analysis, Insights and Forecast - by Onshore
- 5.2. Market Analysis, Insights and Forecast - by Offshore
- 5.3. Market Analysis, Insights and Forecast - by Region
- 5.3.1. Australia
- 5.1. Market Analysis, Insights and Forecast - by Onshore
- 6. Competitive Analysis
- 6.1. Market Share Analysis 2024
- 6.2. Company Profiles
- 6.2.1 Santos Limited
- 6.2.1.1. Overview
- 6.2.1.2. Products
- 6.2.1.3. SWOT Analysis
- 6.2.1.4. Recent Developments
- 6.2.1.5. Financials (Based on Availability)
- 6.2.2 Woodside Petroleum Limited
- 6.2.2.1. Overview
- 6.2.2.2. Products
- 6.2.2.3. SWOT Analysis
- 6.2.2.4. Recent Developments
- 6.2.2.5. Financials (Based on Availability)
- 6.2.3 Shell PLC
- 6.2.3.1. Overview
- 6.2.3.2. Products
- 6.2.3.3. SWOT Analysis
- 6.2.3.4. Recent Developments
- 6.2.3.5. Financials (Based on Availability)
- 6.2.4 ExxonMobil Corporation
- 6.2.4.1. Overview
- 6.2.4.2. Products
- 6.2.4.3. SWOT Analysis
- 6.2.4.4. Recent Developments
- 6.2.4.5. Financials (Based on Availability)
- 6.2.5 Caltex Australia Limited*List Not Exhaustive
- 6.2.5.1. Overview
- 6.2.5.2. Products
- 6.2.5.3. SWOT Analysis
- 6.2.5.4. Recent Developments
- 6.2.5.5. Financials (Based on Availability)
- 6.2.6 BHP Group PLC
- 6.2.6.1. Overview
- 6.2.6.2. Products
- 6.2.6.3. SWOT Analysis
- 6.2.6.4. Recent Developments
- 6.2.6.5. Financials (Based on Availability)
- 6.2.7 Origin Energy Limited
- 6.2.7.1. Overview
- 6.2.7.2. Products
- 6.2.7.3. SWOT Analysis
- 6.2.7.4. Recent Developments
- 6.2.7.5. Financials (Based on Availability)
- 6.2.8 Chevron Corporation
- 6.2.8.1. Overview
- 6.2.8.2. Products
- 6.2.8.3. SWOT Analysis
- 6.2.8.4. Recent Developments
- 6.2.8.5. Financials (Based on Availability)
- 6.2.9 BP PLC
- 6.2.9.1. Overview
- 6.2.9.2. Products
- 6.2.9.3. SWOT Analysis
- 6.2.9.4. Recent Developments
- 6.2.9.5. Financials (Based on Availability)
- 6.2.10 Total Energies SE
- 6.2.10.1. Overview
- 6.2.10.2. Products
- 6.2.10.3. SWOT Analysis
- 6.2.10.4. Recent Developments
- 6.2.10.5. Financials (Based on Availability)
- 6.2.1 Santos Limited
List of Figures
- Figure 1: Australia Oil and Gas Upstream Industry Revenue Breakdown (Million, %) by Product 2024 & 2032
- Figure 2: Australia Oil and Gas Upstream Industry Share (%) by Company 2024
List of Tables
- Table 1: Australia Oil and Gas Upstream Industry Revenue Million Forecast, by Region 2019 & 2032
- Table 2: Australia Oil and Gas Upstream Industry Revenue Million Forecast, by Onshore 2019 & 2032
- Table 3: Australia Oil and Gas Upstream Industry Revenue Million Forecast, by Offshore 2019 & 2032
- Table 4: Australia Oil and Gas Upstream Industry Revenue Million Forecast, by Region 2019 & 2032
- Table 5: Australia Oil and Gas Upstream Industry Revenue Million Forecast, by Country 2019 & 2032
- Table 6: Australia Oil and Gas Upstream Industry Revenue Million Forecast, by Onshore 2019 & 2032
- Table 7: Australia Oil and Gas Upstream Industry Revenue Million Forecast, by Offshore 2019 & 2032
- Table 8: Australia Oil and Gas Upstream Industry Revenue Million Forecast, by Country 2019 & 2032
Frequently Asked Questions
1. What is the projected Compound Annual Growth Rate (CAGR) of the Australia Oil and Gas Upstream Industry?
The projected CAGR is approximately > 2.00%.
2. Which companies are prominent players in the Australia Oil and Gas Upstream Industry?
Key companies in the market include Santos Limited, Woodside Petroleum Limited, Shell PLC, ExxonMobil Corporation, Caltex Australia Limited*List Not Exhaustive, BHP Group PLC, Origin Energy Limited, Chevron Corporation, BP PLC, Total Energies SE.
3. What are the main segments of the Australia Oil and Gas Upstream Industry?
The market segments include Onshore, Offshore.
4. Can you provide details about the market size?
The market size is estimated to be USD XX Million as of 2022.
5. What are some drivers contributing to market growth?
4.; Modernization and Upgrades of Existing Military Aircraft Fleets4.; Increasing Defense Budgets.
6. What are the notable trends driving market growth?
Offshore Segment to Dominate the Market.
7. Are there any restraints impacting market growth?
4.; Shift Toward Unmanned Aircraft.
8. Can you provide examples of recent developments in the market?
In September 2021, a partnership between Wood and National Energy Resources Australia (NERA) developed an advanced AI technology known as Augmented Machine Vision Solution (AMVS). This technology is expected to assist in inspecting industrial equipment, especially subsea oil and gas infrastructure. This new innovative solution improves speed and accuracy and reduces human risk. It also has the potential to be executed in various industries to enhance reliability and reduce inspection costs.
9. What pricing options are available for accessing the report?
Pricing options include single-user, multi-user, and enterprise licenses priced at USD 3800, USD 4500, and USD 5800 respectively.
10. Is the market size provided in terms of value or volume?
The market size is provided in terms of value, measured in Million.
11. Are there any specific market keywords associated with the report?
Yes, the market keyword associated with the report is "Australia Oil and Gas Upstream Industry," which aids in identifying and referencing the specific market segment covered.
12. How do I determine which pricing option suits my needs best?
The pricing options vary based on user requirements and access needs. Individual users may opt for single-user licenses, while businesses requiring broader access may choose multi-user or enterprise licenses for cost-effective access to the report.
13. Are there any additional resources or data provided in the Australia Oil and Gas Upstream Industry report?
While the report offers comprehensive insights, it's advisable to review the specific contents or supplementary materials provided to ascertain if additional resources or data are available.
14. How can I stay updated on further developments or reports in the Australia Oil and Gas Upstream Industry?
To stay informed about further developments, trends, and reports in the Australia Oil and Gas Upstream Industry, consider subscribing to industry newsletters, following relevant companies and organizations, or regularly checking reputable industry news sources and publications.
Methodology
Step 1 - Identification of Relevant Samples Size from Population Database


Step 2 - Approaches for Defining Global Market Size (Value, Volume* & Price*)

Note*: In applicable scenarios
Step 3 - Data Sources
Primary Research
- Web Analytics
- Survey Reports
- Research Institute
- Latest Research Reports
- Opinion Leaders
Secondary Research
- Annual Reports
- White Paper
- Latest Press Release
- Industry Association
- Paid Database
- Investor Presentations

Step 4 - Data Triangulation
Involves using different sources of information in order to increase the validity of a study
These sources are likely to be stakeholders in a program - participants, other researchers, program staff, other community members, and so on.
Then we put all data in single framework & apply various statistical tools to find out the dynamic on the market.
During the analysis stage, feedback from the stakeholder groups would be compared to determine areas of agreement as well as areas of divergence


