
Key Insights
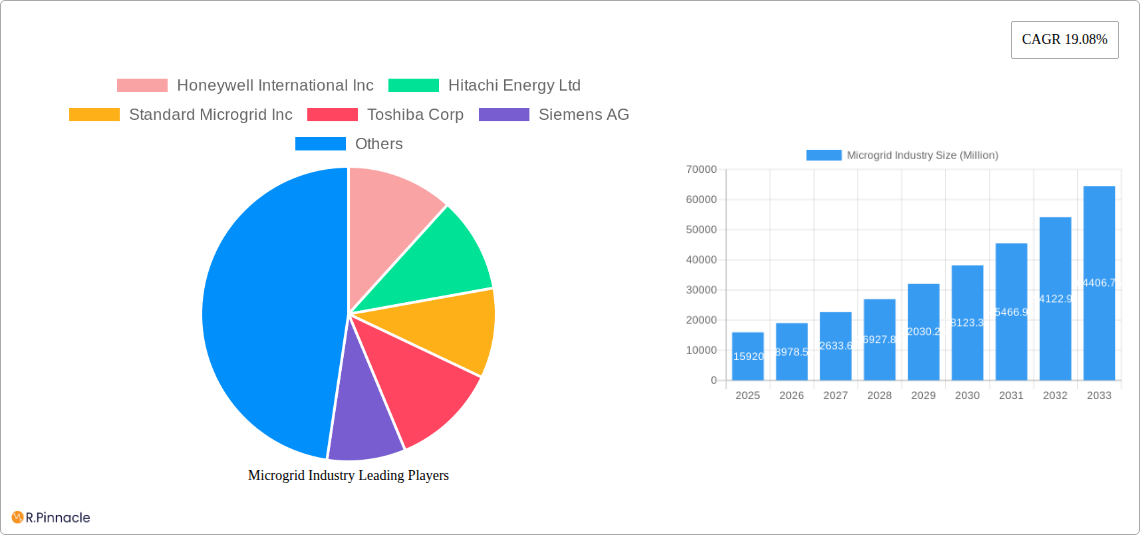
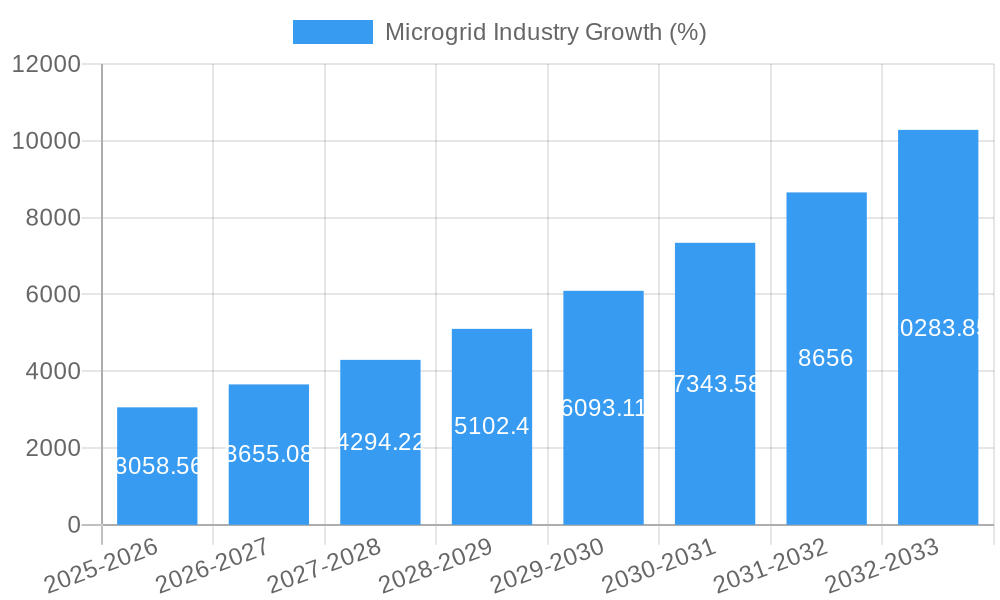
The microgrid industry is experiencing robust growth, projected to reach a market size of $15.92 billion in 2025, exhibiting a Compound Annual Growth Rate (CAGR) of 19.08%. This expansion is driven by several key factors. Increasing demand for reliable and resilient power sources, particularly in remote areas and regions prone to grid instability, is a significant driver. The growing adoption of renewable energy sources, coupled with advancements in energy storage technologies, is further fueling market growth. Government initiatives promoting energy independence and decarbonization efforts are also playing a crucial role. Furthermore, the rising concerns surrounding climate change and the need for sustainable energy solutions are bolstering investment in microgrid infrastructure. The market is segmented by application (institutional sites, commercial facilities, remote off-grid communities, and utility/grid-connected communities, military, etc.) and type (customer microgrid, remote power systems, and other types). North America and Europe currently hold significant market shares, but the Asia-Pacific region is poised for substantial growth due to rapid economic development and increasing urbanization.
The competitive landscape is characterized by a mix of established players and emerging companies. Key players like Honeywell, Hitachi Energy, Siemens, Schneider Electric, and Eaton are leveraging their expertise in power systems and automation to expand their microgrid offerings. The focus is shifting towards providing integrated solutions that incorporate renewable energy generation, energy storage, and intelligent control systems. Furthermore, the increasing adoption of smart grid technologies is enhancing the efficiency and optimization of microgrids, leading to better grid management and reduced energy costs. However, high initial investment costs and regulatory hurdles remain as challenges for market expansion. Future growth will likely be influenced by technological innovations, policy support, and the successful integration of microgrids into existing power grids. The forecast period of 2025-2033 indicates continued substantial growth, driven by the factors mentioned above.
Microgrid Industry Market Report: 2019-2033 Forecast
This comprehensive report provides an in-depth analysis of the global microgrid industry, offering invaluable insights for industry professionals, investors, and strategists. Covering the period from 2019 to 2033, with a focus on 2025, this report projects a robust market expansion driven by technological advancements, increasing energy demands, and supportive government policies. The report meticulously examines market structure, dynamics, key players, and emerging trends to offer actionable strategic recommendations. The total market size is projected to reach xx Million by 2033.
Microgrid Industry Market Structure & Innovation Trends
This section analyzes the competitive landscape of the microgrid industry, encompassing market concentration, innovation drivers, regulatory frameworks, and M&A activities. The market is characterized by a mix of large multinational corporations and specialized smaller players. Key players like Honeywell International Inc, Hitachi Energy Ltd, Siemens AG, and Schneider Electric SE hold significant market share, while smaller companies focus on niche applications or geographic regions.
- Market Concentration: The market exhibits moderate concentration, with the top 5 players accounting for approximately xx% of the global market share in 2025.
- Innovation Drivers: Technological advancements in renewable energy integration, energy storage solutions, and smart grid technologies are major drivers of innovation. The increasing focus on grid resilience and energy independence fuels further innovation.
- Regulatory Frameworks: Government policies promoting renewable energy integration, grid modernization, and energy security significantly influence market growth. Incentives, subsidies, and regulatory frameworks vary across different regions, impacting market dynamics.
- Product Substitutes: Traditional centralized power generation remains a significant competitor, though microgrids offer advantages in reliability, cost-effectiveness, and sustainability in specific applications.
- End-User Demographics: The key end-users include institutional sites, commercial facilities, remote off-grid communities, and utility/grid-connected communities. The demand varies based on region, energy needs, and infrastructure availability.
- M&A Activities: The industry has witnessed considerable M&A activity in recent years, with deal values totaling xx Million in 2024, reflecting consolidation and expansion strategies by major players.
Microgrid Industry Market Dynamics & Trends
The microgrid industry is experiencing rapid growth, driven by several factors. The global market is projected to exhibit a Compound Annual Growth Rate (CAGR) of xx% during the forecast period (2025-2033). This growth is fueled by increasing concerns regarding energy security, the rising adoption of renewable energy sources, and the need for resilient and reliable power supplies, particularly in remote areas. Technological disruptions, such as advancements in battery storage and power electronics, are further accelerating market penetration. Consumer preferences are shifting towards sustainable and decentralized energy solutions, boosting demand for microgrids. Competitive dynamics are intensifying, with companies focusing on innovation, cost optimization, and strategic partnerships to gain a competitive edge.
Dominant Regions & Segments in Microgrid Industry
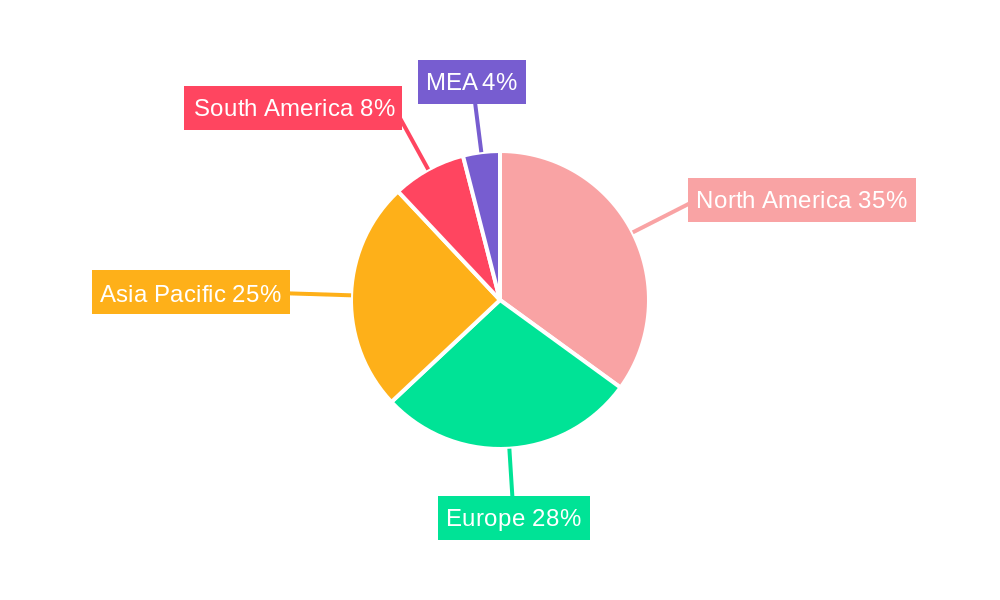
North America currently dominates the microgrid market, driven by supportive government policies, substantial investments in renewable energy, and a strong focus on grid modernization. However, Asia-Pacific is expected to witness significant growth in the coming years, fueled by rapid economic development and increasing urbanization.
- Dominant Application Segment: The Institutional Sites segment currently holds the largest market share due to the high demand for reliable power in hospitals, universities, and government facilities.
- Dominant Type Segment: Customer microgrids represent the largest market segment due to their flexibility and adaptability to specific energy needs.
Key Drivers by Region:
- North America: Strong government support for renewable energy, robust infrastructure, and high technological advancement.
- Europe: Growing awareness of climate change, stringent emission regulations, and initiatives promoting energy efficiency.
- Asia-Pacific: Rapid economic growth, increasing urbanization, and the need for reliable power in remote areas.
Microgrid Industry Product Innovations
Recent innovations focus on enhancing efficiency, reducing costs, and improving integration with renewable energy sources. Advanced control systems, improved energy storage technologies, and hybrid microgrid designs are driving product development. The market is witnessing the emergence of smart microgrids, which utilize advanced analytics and AI for optimized energy management and grid integration. This focus on improved efficiency, reduced costs, and seamless renewable energy integration is creating a significant market opportunity.
Report Scope & Segmentation Analysis
This report segments the microgrid market by application (Institutional Sites, Commercial Facilities, Remote Off-grid Communities, Other Applications) and type (Customer Microgrid, Remote Power Systems, Other Types). Each segment is analyzed in terms of market size, growth projections, and competitive dynamics. For example, the Institutional Sites segment is expected to grow at a CAGR of xx% due to increasing demand for reliable power in critical facilities. Similarly, the Customer Microgrid type is anticipated to dominate due to its flexibility and scalability.
Key Drivers of Microgrid Industry Growth
The microgrid industry’s growth is propelled by several key factors. The increasing unreliability of traditional power grids, coupled with rising energy costs, drives the adoption of microgrids as a reliable and cost-effective alternative. Furthermore, government incentives and regulations promoting renewable energy and grid modernization significantly contribute to market growth. Technological advancements in energy storage, power electronics, and control systems further enhance the attractiveness of microgrid solutions.
Challenges in the Microgrid Industry Sector
Despite significant growth potential, the microgrid industry faces several challenges. High initial investment costs can be a barrier to adoption, particularly for smaller businesses. Regulatory complexities and the need for grid interconnection approvals can create delays and uncertainties. Furthermore, the integration of renewable energy sources into microgrids requires sophisticated control systems and energy storage solutions, posing technological challenges.
Emerging Opportunities in Microgrid Industry
The microgrid industry is witnessing the emergence of several promising opportunities. The growing demand for resilient and reliable power in remote areas, particularly in developing countries, presents significant growth potential. The integration of advanced analytics and AI for optimized energy management is opening new avenues for innovation. The increasing focus on microgrids as a key element of smart cities presents further opportunities for market expansion.
Leading Players in the Microgrid Industry Market
- Honeywell International Inc
- Hitachi Energy Ltd
- Standard Microgrid Inc
- Toshiba Corp
- Siemens AG
- Schneider Electric SE
- Eaton Corporation PLC
- S&C Electric Co
- ENGIE EPS SA
- General Electric Company
Key Developments in Microgrid Industry
- November 2021: Los Angeles Transportation Department plans a new microgrid project for EV charging, receiving a USD 6 million grant. This highlights the growing role of microgrids in supporting electric vehicle infrastructure.
- June 2020: Sri Lanka's first national grid-tied renewable energy microgrid is launched at the University of Moratuwa, showcasing the expansion of microgrid technology into developing nations.
Future Outlook for Microgrid Industry Market
The microgrid market is poised for continued strong growth, driven by increasing energy demands, advancements in renewable energy technologies, and supportive government policies. Strategic partnerships, technological innovations, and expanding applications across diverse sectors will further fuel market expansion. The focus on smart grids and resilience will create significant opportunities for market players.
Microgrid Industry Segmentation
-
1. Application
- 1.1. Institutional Sites
- 1.2. Commercial Facilities
- 1.3. Remote Off-grid Communities
- 1.4. Other Ap
-
2. Type
- 2.1. Customer Microgrid
- 2.2. Remote Power Systems
- 2.3. Other Types
Microgrid Industry Segmentation By Geography
- 1. North America
- 2. Europe
- 3. Asia Pacific
- 4. South America
- 5. Middle East and Africa
Microgrid Industry REPORT HIGHLIGHTS
| Aspects | Details |
|---|---|
| Study Period | 2019-2033 |
| Base Year | 2024 |
| Estimated Year | 2025 |
| Forecast Period | 2025-2033 |
| Historical Period | 2019-2024 |
| Growth Rate | CAGR of 19.08% from 2019-2033 |
| Segmentation |
|
Table of Contents
- 1. Introduction
- 1.1. Research Scope
- 1.2. Market Segmentation
- 1.3. Research Methodology
- 1.4. Definitions and Assumptions
- 2. Executive Summary
- 2.1. Introduction
- 3. Market Dynamics
- 3.1. Introduction
- 3.2. Market Drivers
- 3.2.1. 4.; Growing Infrastructure Projects in the Region
- 3.3. Market Restrains
- 3.3.1. 4.; High Operations and Maintenance Costs
- 3.4. Market Trends
- 3.4.1. Remote Off-grid Communities Systems Expected to Witness Growth
- 4. Market Factor Analysis
- 4.1. Porters Five Forces
- 4.2. Supply/Value Chain
- 4.3. PESTEL analysis
- 4.4. Market Entropy
- 4.5. Patent/Trademark Analysis
- 5. Global Microgrid Industry Analysis, Insights and Forecast, 2019-2031
- 5.1. Market Analysis, Insights and Forecast - by Application
- 5.1.1. Institutional Sites
- 5.1.2. Commercial Facilities
- 5.1.3. Remote Off-grid Communities
- 5.1.4. Other Ap
- 5.2. Market Analysis, Insights and Forecast - by Type
- 5.2.1. Customer Microgrid
- 5.2.2. Remote Power Systems
- 5.2.3. Other Types
- 5.3. Market Analysis, Insights and Forecast - by Region
- 5.3.1. North America
- 5.3.2. Europe
- 5.3.3. Asia Pacific
- 5.3.4. South America
- 5.3.5. Middle East and Africa
- 5.1. Market Analysis, Insights and Forecast - by Application
- 6. North America Microgrid Industry Analysis, Insights and Forecast, 2019-2031
- 6.1. Market Analysis, Insights and Forecast - by Application
- 6.1.1. Institutional Sites
- 6.1.2. Commercial Facilities
- 6.1.3. Remote Off-grid Communities
- 6.1.4. Other Ap
- 6.2. Market Analysis, Insights and Forecast - by Type
- 6.2.1. Customer Microgrid
- 6.2.2. Remote Power Systems
- 6.2.3. Other Types
- 6.1. Market Analysis, Insights and Forecast - by Application
- 7. Europe Microgrid Industry Analysis, Insights and Forecast, 2019-2031
- 7.1. Market Analysis, Insights and Forecast - by Application
- 7.1.1. Institutional Sites
- 7.1.2. Commercial Facilities
- 7.1.3. Remote Off-grid Communities
- 7.1.4. Other Ap
- 7.2. Market Analysis, Insights and Forecast - by Type
- 7.2.1. Customer Microgrid
- 7.2.2. Remote Power Systems
- 7.2.3. Other Types
- 7.1. Market Analysis, Insights and Forecast - by Application
- 8. Asia Pacific Microgrid Industry Analysis, Insights and Forecast, 2019-2031
- 8.1. Market Analysis, Insights and Forecast - by Application
- 8.1.1. Institutional Sites
- 8.1.2. Commercial Facilities
- 8.1.3. Remote Off-grid Communities
- 8.1.4. Other Ap
- 8.2. Market Analysis, Insights and Forecast - by Type
- 8.2.1. Customer Microgrid
- 8.2.2. Remote Power Systems
- 8.2.3. Other Types
- 8.1. Market Analysis, Insights and Forecast - by Application
- 9. South America Microgrid Industry Analysis, Insights and Forecast, 2019-2031
- 9.1. Market Analysis, Insights and Forecast - by Application
- 9.1.1. Institutional Sites
- 9.1.2. Commercial Facilities
- 9.1.3. Remote Off-grid Communities
- 9.1.4. Other Ap
- 9.2. Market Analysis, Insights and Forecast - by Type
- 9.2.1. Customer Microgrid
- 9.2.2. Remote Power Systems
- 9.2.3. Other Types
- 9.1. Market Analysis, Insights and Forecast - by Application
- 10. Middle East and Africa Microgrid Industry Analysis, Insights and Forecast, 2019-2031
- 10.1. Market Analysis, Insights and Forecast - by Application
- 10.1.1. Institutional Sites
- 10.1.2. Commercial Facilities
- 10.1.3. Remote Off-grid Communities
- 10.1.4. Other Ap
- 10.2. Market Analysis, Insights and Forecast - by Type
- 10.2.1. Customer Microgrid
- 10.2.2. Remote Power Systems
- 10.2.3. Other Types
- 10.1. Market Analysis, Insights and Forecast - by Application
- 11. North America Microgrid Industry Analysis, Insights and Forecast, 2019-2031
- 11.1. Market Analysis, Insights and Forecast - By Country/Sub-region
- 11.1.1 United States
- 11.1.2 Canada
- 11.1.3 Mexico
- 12. Europe Microgrid Industry Analysis, Insights and Forecast, 2019-2031
- 12.1. Market Analysis, Insights and Forecast - By Country/Sub-region
- 12.1.1 Germany
- 12.1.2 United Kingdom
- 12.1.3 France
- 12.1.4 Spain
- 12.1.5 Italy
- 12.1.6 Spain
- 12.1.7 Belgium
- 12.1.8 Netherland
- 12.1.9 Nordics
- 12.1.10 Rest of Europe
- 13. Asia Pacific Microgrid Industry Analysis, Insights and Forecast, 2019-2031
- 13.1. Market Analysis, Insights and Forecast - By Country/Sub-region
- 13.1.1 China
- 13.1.2 Japan
- 13.1.3 India
- 13.1.4 South Korea
- 13.1.5 Southeast Asia
- 13.1.6 Australia
- 13.1.7 Indonesia
- 13.1.8 Phillipes
- 13.1.9 Singapore
- 13.1.10 Thailandc
- 13.1.11 Rest of Asia Pacific
- 14. South America Microgrid Industry Analysis, Insights and Forecast, 2019-2031
- 14.1. Market Analysis, Insights and Forecast - By Country/Sub-region
- 14.1.1 Brazil
- 14.1.2 Argentina
- 14.1.3 Peru
- 14.1.4 Chile
- 14.1.5 Colombia
- 14.1.6 Ecuador
- 14.1.7 Venezuela
- 14.1.8 Rest of South America
- 15. MEA Microgrid Industry Analysis, Insights and Forecast, 2019-2031
- 15.1. Market Analysis, Insights and Forecast - By Country/Sub-region
- 15.1.1 United Arab Emirates
- 15.1.2 Saudi Arabia
- 15.1.3 South Africa
- 15.1.4 Rest of Middle East and Africa
- 16. Competitive Analysis
- 16.1. Global Market Share Analysis 2024
- 16.2. Company Profiles
- 16.2.1 Honeywell International Inc
- 16.2.1.1. Overview
- 16.2.1.2. Products
- 16.2.1.3. SWOT Analysis
- 16.2.1.4. Recent Developments
- 16.2.1.5. Financials (Based on Availability)
- 16.2.2 Hitachi Energy Ltd
- 16.2.2.1. Overview
- 16.2.2.2. Products
- 16.2.2.3. SWOT Analysis
- 16.2.2.4. Recent Developments
- 16.2.2.5. Financials (Based on Availability)
- 16.2.3 Standard Microgrid Inc
- 16.2.3.1. Overview
- 16.2.3.2. Products
- 16.2.3.3. SWOT Analysis
- 16.2.3.4. Recent Developments
- 16.2.3.5. Financials (Based on Availability)
- 16.2.4 Toshiba Corp
- 16.2.4.1. Overview
- 16.2.4.2. Products
- 16.2.4.3. SWOT Analysis
- 16.2.4.4. Recent Developments
- 16.2.4.5. Financials (Based on Availability)
- 16.2.5 Siemens AG
- 16.2.5.1. Overview
- 16.2.5.2. Products
- 16.2.5.3. SWOT Analysis
- 16.2.5.4. Recent Developments
- 16.2.5.5. Financials (Based on Availability)
- 16.2.6 Schneider Electric SE
- 16.2.6.1. Overview
- 16.2.6.2. Products
- 16.2.6.3. SWOT Analysis
- 16.2.6.4. Recent Developments
- 16.2.6.5. Financials (Based on Availability)
- 16.2.7 Eaton Corporation PLC
- 16.2.7.1. Overview
- 16.2.7.2. Products
- 16.2.7.3. SWOT Analysis
- 16.2.7.4. Recent Developments
- 16.2.7.5. Financials (Based on Availability)
- 16.2.8 S&C Electric Co
- 16.2.8.1. Overview
- 16.2.8.2. Products
- 16.2.8.3. SWOT Analysis
- 16.2.8.4. Recent Developments
- 16.2.8.5. Financials (Based on Availability)
- 16.2.9 ENGIE EPS SA
- 16.2.9.1. Overview
- 16.2.9.2. Products
- 16.2.9.3. SWOT Analysis
- 16.2.9.4. Recent Developments
- 16.2.9.5. Financials (Based on Availability)
- 16.2.10 General Electric Company
- 16.2.10.1. Overview
- 16.2.10.2. Products
- 16.2.10.3. SWOT Analysis
- 16.2.10.4. Recent Developments
- 16.2.10.5. Financials (Based on Availability)
- 16.2.1 Honeywell International Inc
List of Figures
- Figure 1: Global Microgrid Industry Revenue Breakdown (Million, %) by Region 2024 & 2032
- Figure 2: North America Microgrid Industry Revenue (Million), by Country 2024 & 2032
- Figure 3: North America Microgrid Industry Revenue Share (%), by Country 2024 & 2032
- Figure 4: Europe Microgrid Industry Revenue (Million), by Country 2024 & 2032
- Figure 5: Europe Microgrid Industry Revenue Share (%), by Country 2024 & 2032
- Figure 6: Asia Pacific Microgrid Industry Revenue (Million), by Country 2024 & 2032
- Figure 7: Asia Pacific Microgrid Industry Revenue Share (%), by Country 2024 & 2032
- Figure 8: South America Microgrid Industry Revenue (Million), by Country 2024 & 2032
- Figure 9: South America Microgrid Industry Revenue Share (%), by Country 2024 & 2032
- Figure 10: MEA Microgrid Industry Revenue (Million), by Country 2024 & 2032
- Figure 11: MEA Microgrid Industry Revenue Share (%), by Country 2024 & 2032
- Figure 12: North America Microgrid Industry Revenue (Million), by Application 2024 & 2032
- Figure 13: North America Microgrid Industry Revenue Share (%), by Application 2024 & 2032
- Figure 14: North America Microgrid Industry Revenue (Million), by Type 2024 & 2032
- Figure 15: North America Microgrid Industry Revenue Share (%), by Type 2024 & 2032
- Figure 16: North America Microgrid Industry Revenue (Million), by Country 2024 & 2032
- Figure 17: North America Microgrid Industry Revenue Share (%), by Country 2024 & 2032
- Figure 18: Europe Microgrid Industry Revenue (Million), by Application 2024 & 2032
- Figure 19: Europe Microgrid Industry Revenue Share (%), by Application 2024 & 2032
- Figure 20: Europe Microgrid Industry Revenue (Million), by Type 2024 & 2032
- Figure 21: Europe Microgrid Industry Revenue Share (%), by Type 2024 & 2032
- Figure 22: Europe Microgrid Industry Revenue (Million), by Country 2024 & 2032
- Figure 23: Europe Microgrid Industry Revenue Share (%), by Country 2024 & 2032
- Figure 24: Asia Pacific Microgrid Industry Revenue (Million), by Application 2024 & 2032
- Figure 25: Asia Pacific Microgrid Industry Revenue Share (%), by Application 2024 & 2032
- Figure 26: Asia Pacific Microgrid Industry Revenue (Million), by Type 2024 & 2032
- Figure 27: Asia Pacific Microgrid Industry Revenue Share (%), by Type 2024 & 2032
- Figure 28: Asia Pacific Microgrid Industry Revenue (Million), by Country 2024 & 2032
- Figure 29: Asia Pacific Microgrid Industry Revenue Share (%), by Country 2024 & 2032
- Figure 30: South America Microgrid Industry Revenue (Million), by Application 2024 & 2032
- Figure 31: South America Microgrid Industry Revenue Share (%), by Application 2024 & 2032
- Figure 32: South America Microgrid Industry Revenue (Million), by Type 2024 & 2032
- Figure 33: South America Microgrid Industry Revenue Share (%), by Type 2024 & 2032
- Figure 34: South America Microgrid Industry Revenue (Million), by Country 2024 & 2032
- Figure 35: South America Microgrid Industry Revenue Share (%), by Country 2024 & 2032
- Figure 36: Middle East and Africa Microgrid Industry Revenue (Million), by Application 2024 & 2032
- Figure 37: Middle East and Africa Microgrid Industry Revenue Share (%), by Application 2024 & 2032
- Figure 38: Middle East and Africa Microgrid Industry Revenue (Million), by Type 2024 & 2032
- Figure 39: Middle East and Africa Microgrid Industry Revenue Share (%), by Type 2024 & 2032
- Figure 40: Middle East and Africa Microgrid Industry Revenue (Million), by Country 2024 & 2032
- Figure 41: Middle East and Africa Microgrid Industry Revenue Share (%), by Country 2024 & 2032
List of Tables
- Table 1: Global Microgrid Industry Revenue Million Forecast, by Region 2019 & 2032
- Table 2: Global Microgrid Industry Revenue Million Forecast, by Application 2019 & 2032
- Table 3: Global Microgrid Industry Revenue Million Forecast, by Type 2019 & 2032
- Table 4: Global Microgrid Industry Revenue Million Forecast, by Region 2019 & 2032
- Table 5: Global Microgrid Industry Revenue Million Forecast, by Country 2019 & 2032
- Table 6: United States Microgrid Industry Revenue (Million) Forecast, by Application 2019 & 2032
- Table 7: Canada Microgrid Industry Revenue (Million) Forecast, by Application 2019 & 2032
- Table 8: Mexico Microgrid Industry Revenue (Million) Forecast, by Application 2019 & 2032
- Table 9: Global Microgrid Industry Revenue Million Forecast, by Country 2019 & 2032
- Table 10: Germany Microgrid Industry Revenue (Million) Forecast, by Application 2019 & 2032
- Table 11: United Kingdom Microgrid Industry Revenue (Million) Forecast, by Application 2019 & 2032
- Table 12: France Microgrid Industry Revenue (Million) Forecast, by Application 2019 & 2032
- Table 13: Spain Microgrid Industry Revenue (Million) Forecast, by Application 2019 & 2032
- Table 14: Italy Microgrid Industry Revenue (Million) Forecast, by Application 2019 & 2032
- Table 15: Spain Microgrid Industry Revenue (Million) Forecast, by Application 2019 & 2032
- Table 16: Belgium Microgrid Industry Revenue (Million) Forecast, by Application 2019 & 2032
- Table 17: Netherland Microgrid Industry Revenue (Million) Forecast, by Application 2019 & 2032
- Table 18: Nordics Microgrid Industry Revenue (Million) Forecast, by Application 2019 & 2032
- Table 19: Rest of Europe Microgrid Industry Revenue (Million) Forecast, by Application 2019 & 2032
- Table 20: Global Microgrid Industry Revenue Million Forecast, by Country 2019 & 2032
- Table 21: China Microgrid Industry Revenue (Million) Forecast, by Application 2019 & 2032
- Table 22: Japan Microgrid Industry Revenue (Million) Forecast, by Application 2019 & 2032
- Table 23: India Microgrid Industry Revenue (Million) Forecast, by Application 2019 & 2032
- Table 24: South Korea Microgrid Industry Revenue (Million) Forecast, by Application 2019 & 2032
- Table 25: Southeast Asia Microgrid Industry Revenue (Million) Forecast, by Application 2019 & 2032
- Table 26: Australia Microgrid Industry Revenue (Million) Forecast, by Application 2019 & 2032
- Table 27: Indonesia Microgrid Industry Revenue (Million) Forecast, by Application 2019 & 2032
- Table 28: Phillipes Microgrid Industry Revenue (Million) Forecast, by Application 2019 & 2032
- Table 29: Singapore Microgrid Industry Revenue (Million) Forecast, by Application 2019 & 2032
- Table 30: Thailandc Microgrid Industry Revenue (Million) Forecast, by Application 2019 & 2032
- Table 31: Rest of Asia Pacific Microgrid Industry Revenue (Million) Forecast, by Application 2019 & 2032
- Table 32: Global Microgrid Industry Revenue Million Forecast, by Country 2019 & 2032
- Table 33: Brazil Microgrid Industry Revenue (Million) Forecast, by Application 2019 & 2032
- Table 34: Argentina Microgrid Industry Revenue (Million) Forecast, by Application 2019 & 2032
- Table 35: Peru Microgrid Industry Revenue (Million) Forecast, by Application 2019 & 2032
- Table 36: Chile Microgrid Industry Revenue (Million) Forecast, by Application 2019 & 2032
- Table 37: Colombia Microgrid Industry Revenue (Million) Forecast, by Application 2019 & 2032
- Table 38: Ecuador Microgrid Industry Revenue (Million) Forecast, by Application 2019 & 2032
- Table 39: Venezuela Microgrid Industry Revenue (Million) Forecast, by Application 2019 & 2032
- Table 40: Rest of South America Microgrid Industry Revenue (Million) Forecast, by Application 2019 & 2032
- Table 41: Global Microgrid Industry Revenue Million Forecast, by Country 2019 & 2032
- Table 42: United Arab Emirates Microgrid Industry Revenue (Million) Forecast, by Application 2019 & 2032
- Table 43: Saudi Arabia Microgrid Industry Revenue (Million) Forecast, by Application 2019 & 2032
- Table 44: South Africa Microgrid Industry Revenue (Million) Forecast, by Application 2019 & 2032
- Table 45: Rest of Middle East and Africa Microgrid Industry Revenue (Million) Forecast, by Application 2019 & 2032
- Table 46: Global Microgrid Industry Revenue Million Forecast, by Application 2019 & 2032
- Table 47: Global Microgrid Industry Revenue Million Forecast, by Type 2019 & 2032
- Table 48: Global Microgrid Industry Revenue Million Forecast, by Country 2019 & 2032
- Table 49: Global Microgrid Industry Revenue Million Forecast, by Application 2019 & 2032
- Table 50: Global Microgrid Industry Revenue Million Forecast, by Type 2019 & 2032
- Table 51: Global Microgrid Industry Revenue Million Forecast, by Country 2019 & 2032
- Table 52: Global Microgrid Industry Revenue Million Forecast, by Application 2019 & 2032
- Table 53: Global Microgrid Industry Revenue Million Forecast, by Type 2019 & 2032
- Table 54: Global Microgrid Industry Revenue Million Forecast, by Country 2019 & 2032
- Table 55: Global Microgrid Industry Revenue Million Forecast, by Application 2019 & 2032
- Table 56: Global Microgrid Industry Revenue Million Forecast, by Type 2019 & 2032
- Table 57: Global Microgrid Industry Revenue Million Forecast, by Country 2019 & 2032
- Table 58: Global Microgrid Industry Revenue Million Forecast, by Application 2019 & 2032
- Table 59: Global Microgrid Industry Revenue Million Forecast, by Type 2019 & 2032
- Table 60: Global Microgrid Industry Revenue Million Forecast, by Country 2019 & 2032
Frequently Asked Questions
1. What is the projected Compound Annual Growth Rate (CAGR) of the Microgrid Industry?
The projected CAGR is approximately 19.08%.
2. Which companies are prominent players in the Microgrid Industry?
Key companies in the market include Honeywell International Inc, Hitachi Energy Ltd, Standard Microgrid Inc, Toshiba Corp, Siemens AG, Schneider Electric SE, Eaton Corporation PLC, S&C Electric Co, ENGIE EPS SA, General Electric Company.
3. What are the main segments of the Microgrid Industry?
The market segments include Application, Type.
4. Can you provide details about the market size?
The market size is estimated to be USD 15.92 Million as of 2022.
5. What are some drivers contributing to market growth?
4.; Growing Infrastructure Projects in the Region.
6. What are the notable trends driving market growth?
Remote Off-grid Communities Systems Expected to Witness Growth.
7. Are there any restraints impacting market growth?
4.; High Operations and Maintenance Costs.
8. Can you provide examples of recent developments in the market?
In November 2021, the Los Angeles Transportation Department planned a new microgrid project for the electrification of EVs. The microgrid, with a solar plus storage power supply system, is expected to become the charging station for the fleet. The project, to be developed by Proterra Energy, received a grant of USD 6 million from the California Energy Commission. It is expected to produce around 7.5 MW of power output.
9. What pricing options are available for accessing the report?
Pricing options include single-user, multi-user, and enterprise licenses priced at USD 4750, USD 5250, and USD 8750 respectively.
10. Is the market size provided in terms of value or volume?
The market size is provided in terms of value, measured in Million.
11. Are there any specific market keywords associated with the report?
Yes, the market keyword associated with the report is "Microgrid Industry," which aids in identifying and referencing the specific market segment covered.
12. How do I determine which pricing option suits my needs best?
The pricing options vary based on user requirements and access needs. Individual users may opt for single-user licenses, while businesses requiring broader access may choose multi-user or enterprise licenses for cost-effective access to the report.
13. Are there any additional resources or data provided in the Microgrid Industry report?
While the report offers comprehensive insights, it's advisable to review the specific contents or supplementary materials provided to ascertain if additional resources or data are available.
14. How can I stay updated on further developments or reports in the Microgrid Industry?
To stay informed about further developments, trends, and reports in the Microgrid Industry, consider subscribing to industry newsletters, following relevant companies and organizations, or regularly checking reputable industry news sources and publications.
Methodology
Step 1 - Identification of Relevant Samples Size from Population Database


Step 2 - Approaches for Defining Global Market Size (Value, Volume* & Price*)

Note*: In applicable scenarios
Step 3 - Data Sources
Primary Research
- Web Analytics
- Survey Reports
- Research Institute
- Latest Research Reports
- Opinion Leaders
Secondary Research
- Annual Reports
- White Paper
- Latest Press Release
- Industry Association
- Paid Database
- Investor Presentations

Step 4 - Data Triangulation
Involves using different sources of information in order to increase the validity of a study
These sources are likely to be stakeholders in a program - participants, other researchers, program staff, other community members, and so on.
Then we put all data in single framework & apply various statistical tools to find out the dynamic on the market.
During the analysis stage, feedback from the stakeholder groups would be compared to determine areas of agreement as well as areas of divergence


