

Key Insights
The Australian power market is poised for significant growth, driven by an increasing demand for reliable and sustainable energy solutions. With a projected market size of $41.6 billion in 2024 and a robust Compound Annual Growth Rate (CAGR) of 5.65%, the sector is expected to witness substantial expansion throughout the forecast period of 2025-2033. Key growth drivers include the ongoing transition towards renewable energy sources to meet climate targets, coupled with substantial investments in upgrading and expanding the nation's power transmission and distribution infrastructure. The increasing adoption of smart grid technologies and the growing demand for electricity in industrial sectors such as mining and manufacturing are also contributing to this upward trajectory. The market's dynamism is further fueled by a competitive landscape featuring major players actively engaged in both traditional and renewable energy generation and supply, fostering innovation and improved service offerings for consumers.
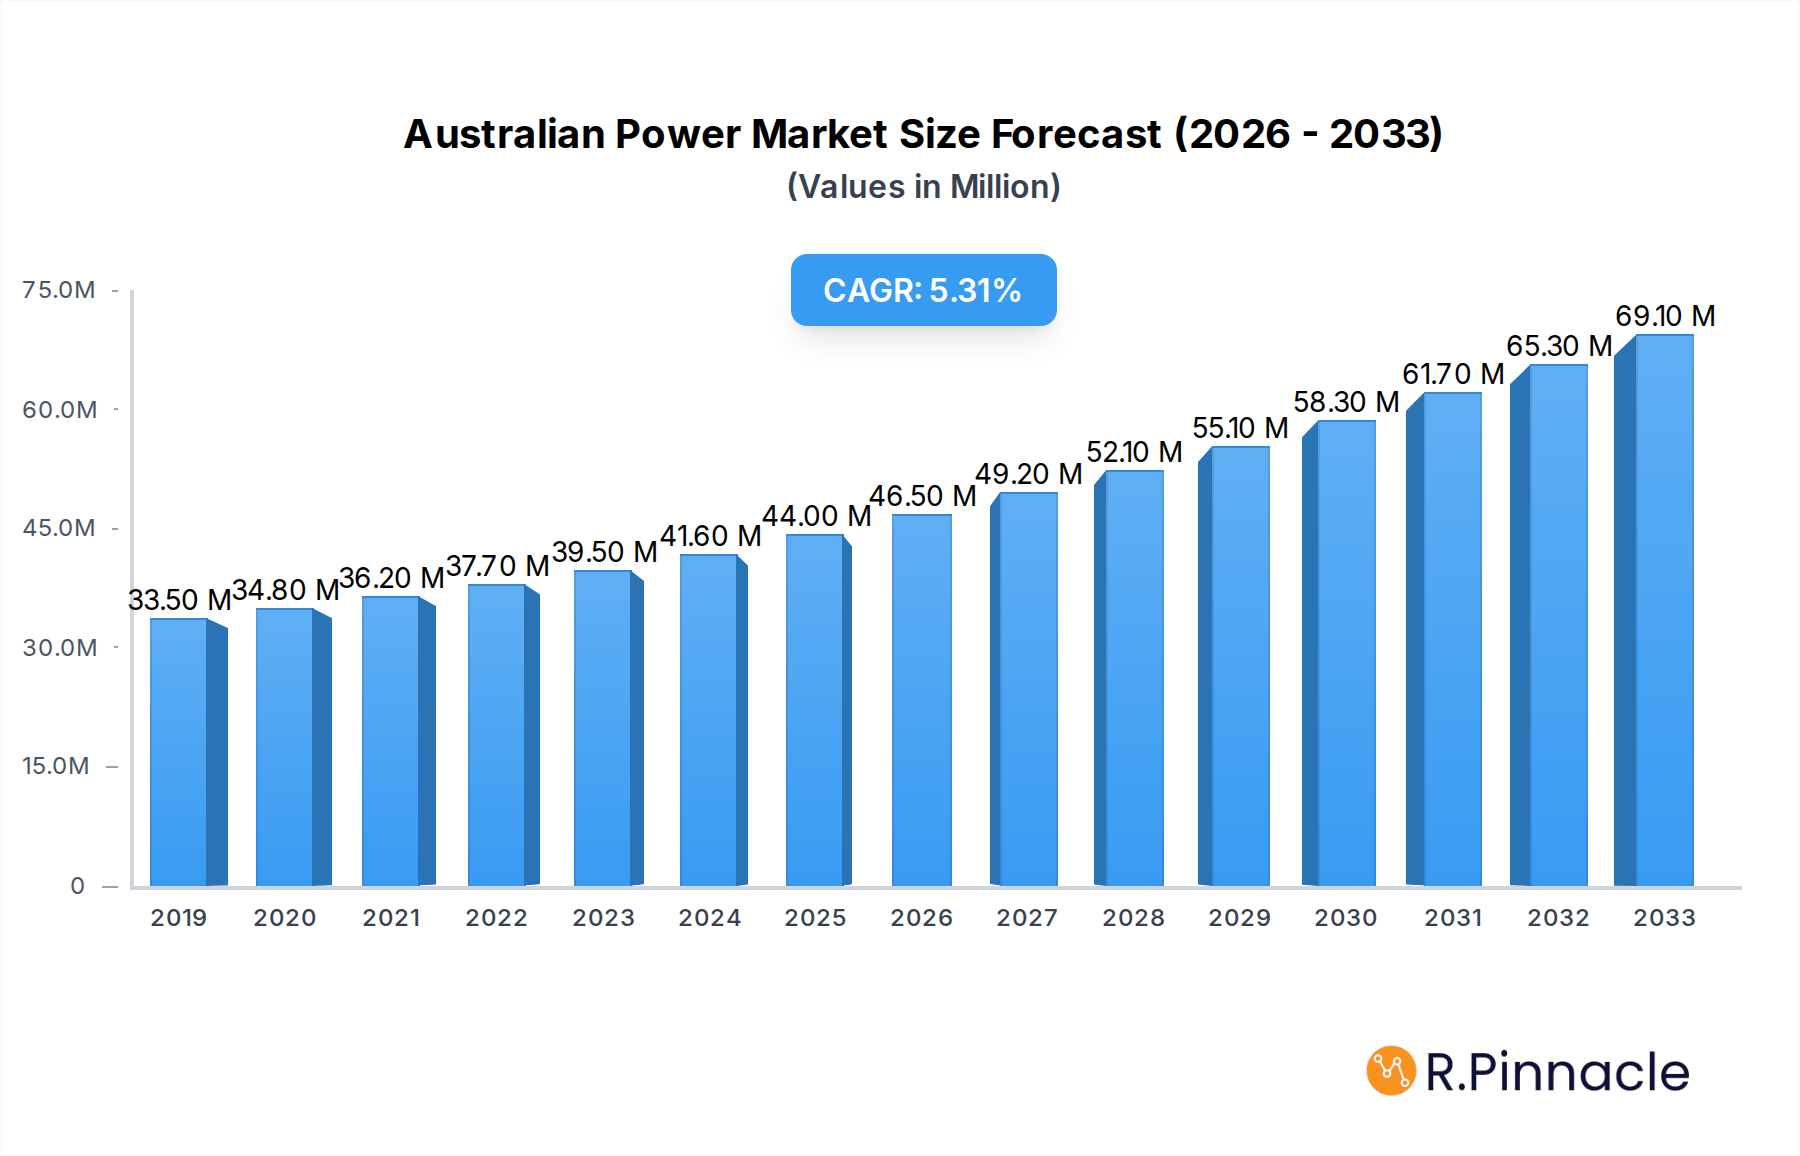
Australian Power Market Market Size (In Million)
The Australian power market is undergoing a significant transformation, with a pronounced shift towards cleaner energy alternatives. While traditional sources like coal and natural gas continue to play a role, the rapid expansion of renewable energy, including solar and wind power, is a defining trend. This is supported by government policies aimed at decarbonization and energy security. However, the market also faces certain restraints. These include the significant capital investment required for renewable energy projects and grid modernization, potential intermittency issues associated with renewable sources requiring advanced storage solutions, and evolving regulatory frameworks. The demand for electricity is projected to rise, driven by population growth, electrification initiatives, and the development of new industries, ensuring a continued need for both the expansion and modernization of the power sector.

Australian Power Market Company Market Share
This definitive report delivers an in-depth analysis of the dynamic Australian power market, offering critical insights for industry professionals, investors, and policymakers. Spanning the historical period of 2019-2024 and projecting through 2033 with a base and estimated year of 2025, this study dissects market structure, key players, and emerging trends. It provides actionable data on market dynamics, dominant regions, product innovations, and growth drivers, equipping stakeholders with the knowledge to navigate the evolving energy landscape.
Australian Power Market Market Structure & Innovation Trends
The Australian power market is characterized by a moderately concentrated structure, with leading utilities holding significant market share. Innovation is primarily driven by the imperative for decarbonization, increasing demand for renewable energy solutions, and advancements in grid modernization technologies. Regulatory frameworks are undergoing rapid evolution to support the transition away from fossil fuels, with a strong emphasis on emissions reduction targets and the integration of distributed energy resources. Product substitutes are increasingly prevalent, with solar PV, battery storage, and wind energy directly challenging traditional power generation sources. End-user demographics are shifting, with a growing consumer appetite for cleaner, more sustainable energy options and greater control over their energy consumption. Mergers and acquisitions (M&A) activities are robust, driven by companies seeking to expand their renewable portfolios and gain market share in this transformative period. For instance, significant M&A deals are expected to reshape the competitive landscape, with an estimated market share shift towards renewable energy providers exceeding 50% by 2033. M&A deal values in the renewable energy sector alone are projected to reach billions of Australian dollars annually.
Australian Power Market Market Dynamics & Trends
The Australian power market is poised for substantial growth, projected at a Compound Annual Growth Rate (CAGR) of approximately xx% from 2025 to 2033. This expansion is fueled by a confluence of powerful market growth drivers. Foremost among these is the accelerating global and national push towards decarbonization, necessitating significant investment in renewable energy infrastructure and the phasing out of older, less efficient fossil fuel power plants. Technological disruptions are rapidly reshaping the energy sector, with breakthroughs in battery storage, smart grid technologies, and hydrogen fuel cell advancements creating new opportunities and efficiencies. Consumer preferences are increasingly leaning towards sustainable and ethical energy consumption. This is evidenced by a rising demand for green energy plans and a greater willingness to adopt smart home energy management systems, contributing to an increased market penetration of distributed generation by an estimated xx% over the forecast period. The competitive dynamics are intensifying, with traditional energy giants adapting their strategies to incorporate substantial renewable energy generation and new market entrants challenging established players with innovative business models and technologies. The integration of electric vehicles (EVs) is also a significant emerging trend, driving demand for charging infrastructure and influencing grid management strategies, further stimulating market activity. The overall market penetration of renewable energy sources is projected to surpass xx% by 2033, fundamentally altering the energy mix.
Dominant Regions & Segments in Australian Power Market
The Australian power market's dominance is increasingly shifting towards Renewables within the Power Generation Source segment. Economic policies, such as government incentives for renewable energy projects and carbon pricing mechanisms, are primary drivers behind this shift. Furthermore, substantial infrastructure investments in wind and solar farms across the country are facilitating this dominance. The Power Transmission and Distribution segment is experiencing significant upgrades to accommodate the influx of distributed and variable renewable energy, ensuring grid stability and reliability.
- Renewables: This segment is experiencing unprecedented growth, driven by decreasing technology costs, supportive government policies, and increasing corporate and consumer demand for clean energy. States like Queensland and New South Wales are leading in renewable energy capacity additions.
- Power Transmission and Distribution: Essential for integrating renewables, this segment is seeing massive investment in modernizing and expanding the grid. Key drivers include the need to manage intermittent power flows from renewables and to connect new generation sources to the network.
- Natural Gas: While its share is expected to decline, natural gas will remain a crucial bridging fuel, providing grid stability and dispatchable power. Its dominance is supported by existing infrastructure and its role in complementing intermittent renewables.
- Coal: Facing a planned phase-out, coal power generation's dominance is rapidly diminishing. Regulatory frameworks and environmental concerns are the primary factors leading to its decline.
- Other Power Generation Sources (e.g., Hydro, Biomass): These segments play a vital role in providing baseload and flexible power, contributing to grid stability, particularly in regions with suitable geographical conditions.
Queensland, with its abundant solar and wind resources, is emerging as a dominant region for renewable energy development, attracting billions in investment for large-scale solar and wind farms. Victoria is also a significant player, with a strong commitment to renewable energy targets and significant investments in offshore wind projects. The ongoing development of the MacIntyre Wind Precinct, a USD 1.45 billion project, exemplifies the scale of investment in this segment.
Australian Power Market Product Innovations
Product innovations in the Australian power market are primarily focused on enhancing the efficiency, reliability, and sustainability of energy solutions. Advancements in solar panel technology, including higher energy conversion rates and bifacial panels, are improving output. Battery storage systems are becoming more sophisticated, offering longer duration storage and faster response times for grid services. Smart grid technologies, such as advanced metering infrastructure and demand-side management platforms, are enabling better control and optimization of energy consumption. The development of green hydrogen production and storage technologies also represents a significant innovation, promising to decarbonize hard-to-abate sectors. These innovations offer competitive advantages by reducing operational costs, improving grid stability, and meeting the growing demand for clean energy solutions.
Report Scope & Segmentation Analysis
This report segments the Australian power market by Power Generation Source, encompassing Coal, Natural Gas, Oil, Renewables, and Other Power Generation Sources, and by Power Transmission and Distribution. The Renewables segment, including solar, wind, and hydro, is projected to exhibit the highest growth rate, driven by decarbonization efforts and falling technology costs. The estimated market size for Renewables is projected to reach billions of Australian dollars by 2033. Power Transmission and Distribution is also a key growth area, requiring substantial investment in grid modernization to integrate diverse energy sources. Competitive dynamics within each segment are evolving rapidly, with a clear trend towards increased investment and market share for renewable energy providers.
Key Drivers of Australian Power Market Growth
The Australian power market's growth is propelled by several interconnected factors.
- Decarbonization Imperative: National and state-level climate change targets are driving the transition from fossil fuels to renewable energy sources.
- Technological Advancements: Falling costs of solar PV, wind turbines, and battery storage, coupled with innovations in grid management, are making clean energy more competitive.
- Government Policies and Incentives: Supportive regulatory frameworks, renewable energy targets, and financial incentives are accelerating investment in clean energy projects.
- Growing Energy Demand: Increased electrification across various sectors, including transport and industry, is boosting overall energy consumption.
Challenges in the Australian Power Market Sector
Despite robust growth potential, the Australian power market faces significant challenges.
- Grid Integration: The intermittent nature of renewable energy sources requires substantial investment in grid infrastructure and advanced management systems to ensure reliability.
- Supply Chain Constraints: Global supply chain disruptions can impact the availability and cost of key components for renewable energy projects.
- Regulatory Uncertainty: Evolving policy landscapes can create uncertainty for investors and developers.
- Social License and Community Acceptance: Gaining community support for new energy infrastructure, such as large-scale wind and solar farms, can be challenging.
Emerging Opportunities in Australian Power Market
Emerging opportunities in the Australian power market are diverse and promising.
- Green Hydrogen Production: Australia's vast renewable resources position it as a potential global leader in green hydrogen exports, creating new markets and industries.
- Offshore Wind Development: Significant potential exists for offshore wind farms, particularly along the southeastern coast, offering a new source of large-scale renewable energy.
- Battery Storage Solutions: The demand for grid-scale and behind-the-meter battery storage is growing, providing grid stability and enabling higher renewable energy penetration.
- Decentralized Energy Systems: The rise of microgrids and distributed energy resources presents opportunities for localized energy solutions and enhanced grid resilience.
Leading Players in the Australian Power Market Market
- Iberdrola SA
- Next Business Energy
- Smartest Energy Australia Pty Ltd
- Goldwind Australia
- Origin Energy Ltd
- AGL Energy Ltd
- Momentum Energy Pty Ltd
- Alinta Energy Pty Ltd
- Simply Energy Inc
- Energy Australia
Key Developments in Australian Power Market Industry
- April 2023: Australia announced plans to shut down most aged coal-fired power plants. The Liddell power station, a three-hour drive north of Sydney, was one in a series of aging coal-fired plants slated to close in the coming years. The Liddell power plant is set to be substituted by clean energy projects, including a hydrogen power plant.
- August 2022: Neoen Australia announced that its 400 MW solar farm, which forms part of its USD 414.6 million Western Downs Green Power Hub, began exporting electricity to the grid.
- June 2022: Construction started on the 1,026-megawatt (MW) MacIntyre Wind Precinct, the largest wind farm to ever be built in Australia. Acciona Energía and CleanCo Queensland are co-owners of the USD 1.45 billion project in Queensland, southwest of Warwick. Queensland-based Ark Energy is a co-investor.
Future Outlook for Australian Power Market Market
The future outlook for the Australian power market is exceptionally strong, driven by an unyielding commitment to a clean energy transition. The market is expected to witness continued robust growth, fueled by ongoing investments in renewable energy generation, particularly solar and wind, and the expansion of battery storage solutions. The development of green hydrogen is poised to unlock significant export potential and further decarbonize industrial processes, adding billions to the market value. Strategic opportunities lie in the continued modernization of the transmission and distribution network to accommodate the increasing share of variable renewable energy and in the development of smart grid technologies that enhance efficiency and resilience. The Australian power market is on a trajectory to become a global leader in renewable energy innovation and deployment.
Australian Power Market Segmentation
-
1. Power Generation Source
- 1.1. Coal
- 1.2. Natural Gas
- 1.3. Oil
- 1.4. Renewables
- 1.5. Other Power Generation Sources
- 2. Power Transmission and Distribution
Australian Power Market Segmentation By Geography
- 1. Australia
Australian Power Market Regional Market Share
Geographic Coverage of Australian Power Market
Australian Power Market REPORT HIGHLIGHTS
| Aspects | Details |
|---|---|
| Study Period | 2020-2034 |
| Base Year | 2025 |
| Estimated Year | 2026 |
| Forecast Period | 2026-2034 |
| Historical Period | 2020-2025 |
| Growth Rate | CAGR of 5.65% from 2020-2034 |
| Segmentation |
|
Table of Contents
- 1. Introduction
- 1.1. Research Scope
- 1.2. Market Segmentation
- 1.3. Research Objective
- 1.4. Definitions and Assumptions
- 2. Executive Summary
- 2.1. Market Snapshot
- 3. Market Dynamics
- 3.1. Market Drivers
- 3.2. Market Restrains
- 3.3. Market Trends
- 3.4. Market Opportunities
- 4. Market Factor Analysis
- 4.1. Porters Five Forces
- 4.1.1. Bargaining Power of Suppliers
- 4.1.2. Bargaining Power of Buyers
- 4.1.3. Threat of New Entrants
- 4.1.4. Threat of Substitutes
- 4.1.5. Competitive Rivalry
- 4.2. PESTEL analysis
- 4.3. BCG Analysis
- 4.3.1. Stars (High Growth, High Market Share)
- 4.3.2. Cash Cows (Low Growth, High Market Share)
- 4.3.3. Question Mark (High Growth, Low Market Share)
- 4.3.4. Dogs (Low Growth, Low Market Share)
- 4.4. Ansoff Matrix Analysis
- 4.5. Supply Chain Analysis
- 4.6. Regulatory Landscape
- 4.7. Current Market Potential and Opportunity Assessment (TAM–SAM–SOM Framework)
- 4.8. PRI Analyst Note
- 4.1. Porters Five Forces
- 5. Market Analysis, Insights and Forecast 2021-2033
- 5.1. Market Analysis, Insights and Forecast - by Power Generation Source
- 5.1.1. Coal
- 5.1.2. Natural Gas
- 5.1.3. Oil
- 5.1.4. Renewables
- 5.1.5. Other Power Generation Sources
- 5.2. Market Analysis, Insights and Forecast - by Power Transmission and Distribution
- 5.3. Market Analysis, Insights and Forecast - by Region
- 5.3.1. Australia
- 5.1. Market Analysis, Insights and Forecast - by Power Generation Source
- 6. Australian Power Market Analysis, Insights and Forecast, 2021-2033
- 6.1. Market Analysis, Insights and Forecast - by Power Generation Source
- 6.1.1. Coal
- 6.1.2. Natural Gas
- 6.1.3. Oil
- 6.1.4. Renewables
- 6.1.5. Other Power Generation Sources
- 6.2. Market Analysis, Insights and Forecast - by Power Transmission and Distribution
- 6.1. Market Analysis, Insights and Forecast - by Power Generation Source
- 7. Competitive Analysis
- 7.1. Company Profiles
- 7.1.1 Iberdrola SA
- 7.1.1.1. Company Overview
- 7.1.1.2. Products
- 7.1.1.3. Company Financials
- 7.1.1.4. SWOT Analysis
- 7.1.2 Next Business Energy
- 7.1.2.1. Company Overview
- 7.1.2.2. Products
- 7.1.2.3. Company Financials
- 7.1.2.4. SWOT Analysis
- 7.1.3 Smartest Energy Australia Pty Ltd
- 7.1.3.1. Company Overview
- 7.1.3.2. Products
- 7.1.3.3. Company Financials
- 7.1.3.4. SWOT Analysis
- 7.1.4 Goldwind Australia
- 7.1.4.1. Company Overview
- 7.1.4.2. Products
- 7.1.4.3. Company Financials
- 7.1.4.4. SWOT Analysis
- 7.1.5 Origin Energy Ltd
- 7.1.5.1. Company Overview
- 7.1.5.2. Products
- 7.1.5.3. Company Financials
- 7.1.5.4. SWOT Analysis
- 7.1.6 AGL Energy Ltd
- 7.1.6.1. Company Overview
- 7.1.6.2. Products
- 7.1.6.3. Company Financials
- 7.1.6.4. SWOT Analysis
- 7.1.7 Momentum Energy Pty Ltd
- 7.1.7.1. Company Overview
- 7.1.7.2. Products
- 7.1.7.3. Company Financials
- 7.1.7.4. SWOT Analysis
- 7.1.8 Alinta Energy Pty Ltd
- 7.1.8.1. Company Overview
- 7.1.8.2. Products
- 7.1.8.3. Company Financials
- 7.1.8.4. SWOT Analysis
- 7.1.9 Simply Energy Inc *List Not Exhaustive
- 7.1.9.1. Company Overview
- 7.1.9.2. Products
- 7.1.9.3. Company Financials
- 7.1.9.4. SWOT Analysis
- 7.1.10 Energy Australia
- 7.1.10.1. Company Overview
- 7.1.10.2. Products
- 7.1.10.3. Company Financials
- 7.1.10.4. SWOT Analysis
- 7.1.1 Iberdrola SA
- 7.2. Market Entropy
- 7.2.1 Company's Key Areas Served
- 7.2.2 Recent Developments
- 7.3. Company Market Share Analysis 2025
- 7.3.1 Top 5 Companies Market Share Analysis
- 7.3.2 Top 3 Companies Market Share Analysis
- 7.4. List of Potential Customers
- 8. Research Methodology
List of Figures
- Figure 1: Australian Power Market Revenue Breakdown (billion, %) by Product 2025 & 2033
- Figure 2: Australian Power Market Share (%) by Company 2025
List of Tables
- Table 1: Australian Power Market Revenue billion Forecast, by Power Generation Source 2020 & 2033
- Table 2: Australian Power Market Volume gigawatt Forecast, by Power Generation Source 2020 & 2033
- Table 3: Australian Power Market Revenue billion Forecast, by Power Transmission and Distribution 2020 & 2033
- Table 4: Australian Power Market Volume gigawatt Forecast, by Power Transmission and Distribution 2020 & 2033
- Table 5: Australian Power Market Revenue billion Forecast, by Region 2020 & 2033
- Table 6: Australian Power Market Volume gigawatt Forecast, by Region 2020 & 2033
- Table 7: Australian Power Market Revenue billion Forecast, by Power Generation Source 2020 & 2033
- Table 8: Australian Power Market Volume gigawatt Forecast, by Power Generation Source 2020 & 2033
- Table 9: Australian Power Market Revenue billion Forecast, by Power Transmission and Distribution 2020 & 2033
- Table 10: Australian Power Market Volume gigawatt Forecast, by Power Transmission and Distribution 2020 & 2033
- Table 11: Australian Power Market Revenue billion Forecast, by Country 2020 & 2033
- Table 12: Australian Power Market Volume gigawatt Forecast, by Country 2020 & 2033
Frequently Asked Questions
1. What is the projected Compound Annual Growth Rate (CAGR) of the Australian Power Market?
The projected CAGR is approximately 5.65%.
2. Which companies are prominent players in the Australian Power Market?
Key companies in the market include Iberdrola SA, Next Business Energy, Smartest Energy Australia Pty Ltd, Goldwind Australia, Origin Energy Ltd, AGL Energy Ltd, Momentum Energy Pty Ltd, Alinta Energy Pty Ltd, Simply Energy Inc *List Not Exhaustive, Energy Australia.
3. What are the main segments of the Australian Power Market?
The market segments include Power Generation Source, Power Transmission and Distribution.
4. Can you provide details about the market size?
The market size is estimated to be USD 41.6 billion as of 2022.
5. What are some drivers contributing to market growth?
4.; Increasing Electricity Demand from Manufacturing. Construction. and Mining Industries4.; The Availability of a Broad Range of Fuel Sources for Electricity Generation.
6. What are the notable trends driving market growth?
Renewables Expected to Witness Significant Growth.
7. Are there any restraints impacting market growth?
4.; Phasing Out of Coal-based Power Plants.
8. Can you provide examples of recent developments in the market?
April 2023: Australia announced plans to shut down most aged coal-fired power plants. The Liddell power station, a three-hour drive north of Sydney, was one in a series of aging coal-fired plants slated to close in the coming years. The Liddell power plant is set to be substituted by clean energy projects, including a hydrogen power plant.
9. What pricing options are available for accessing the report?
Pricing options include single-user, multi-user, and enterprise licenses priced at USD 3800, USD 4500, and USD 5800 respectively.
10. Is the market size provided in terms of value or volume?
The market size is provided in terms of value, measured in billion and volume, measured in gigawatt.
11. Are there any specific market keywords associated with the report?
Yes, the market keyword associated with the report is "Australian Power Market," which aids in identifying and referencing the specific market segment covered.
12. How do I determine which pricing option suits my needs best?
The pricing options vary based on user requirements and access needs. Individual users may opt for single-user licenses, while businesses requiring broader access may choose multi-user or enterprise licenses for cost-effective access to the report.
13. Are there any additional resources or data provided in the Australian Power Market report?
While the report offers comprehensive insights, it's advisable to review the specific contents or supplementary materials provided to ascertain if additional resources or data are available.
14. How can I stay updated on further developments or reports in the Australian Power Market?
To stay informed about further developments, trends, and reports in the Australian Power Market, consider subscribing to industry newsletters, following relevant companies and organizations, or regularly checking reputable industry news sources and publications.
Methodology
Step 1 - Identification of Relevant Samples Size from Population Database


Step 2 - Approaches for Defining Global Market Size (Value, Volume* & Price*)

Note*: In applicable scenarios
Step 3 - Data Sources
Primary Research
- Web Analytics
- Survey Reports
- Research Institute
- Latest Research Reports
- Opinion Leaders
Secondary Research
- Annual Reports
- White Paper
- Latest Press Release
- Industry Association
- Paid Database
- Investor Presentations

Step 4 - Data Triangulation
Involves using different sources of information in order to increase the validity of a study
These sources are likely to be stakeholders in a program - participants, other researchers, program staff, other community members, and so on.
Then we put all data in single framework & apply various statistical tools to find out the dynamic on the market.
During the analysis stage, feedback from the stakeholder groups would be compared to determine areas of agreement as well as areas of divergence