

Key Insights
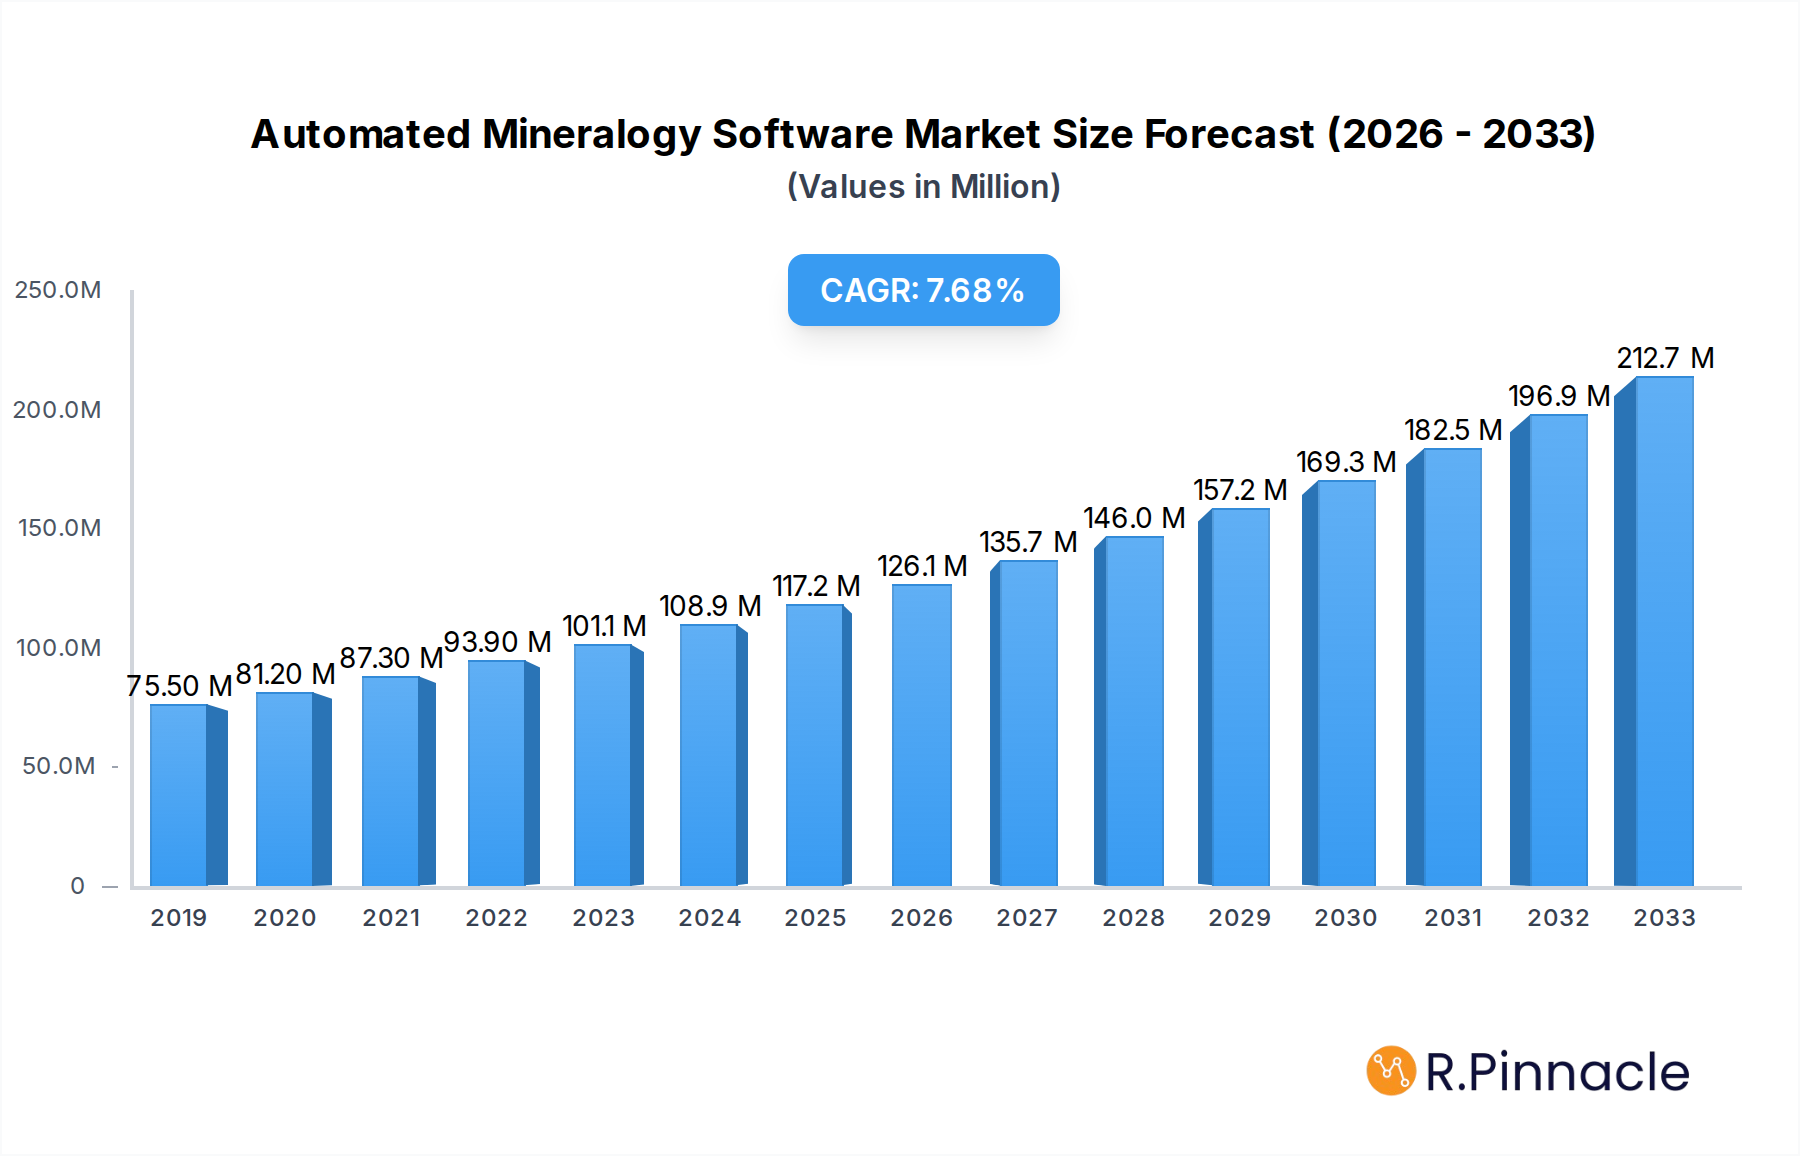
The global Automated Mineralogy Software market is poised for substantial expansion, projected to reach $105 million by 2025, driven by a robust CAGR of 8.4% through 2033. This significant growth is fueled by the increasing demand for precision and efficiency across various sectors, including mining and exploration, mineral processing, geological research, and environmental monitoring. Advancements in X-ray Fluorescence (XRF) and Scanning Electron Microscopy with Energy Dispersive X-ray Spectroscopy (SEM-EDS) technologies are central to this evolution, enabling more accurate and rapid mineral identification and characterization. The software's ability to automate complex analytical processes minimizes human error, reduces operational costs, and accelerates decision-making, making it an indispensable tool for resource management and scientific discovery. Emerging economies, particularly in the Asia Pacific region, are expected to contribute significantly to market growth due to increased investment in mining and infrastructure development.

Automated Mineralogy Software Market Size (In Million)
Despite the optimistic outlook, the market faces certain restraints, including the high initial investment cost of sophisticated hardware and software systems, and the need for skilled personnel to operate and interpret the data generated. However, the continuous innovation in analytical capabilities, coupled with the growing adoption of cloud-based solutions and artificial intelligence for data analysis, is expected to mitigate these challenges. The competitive landscape is characterized by the presence of major global players such as Thermo Fisher Scientific, Oxford Instruments, and Bruker, who are actively engaged in research and development to introduce advanced features and expand their product portfolios. The trend towards miniaturization of analytical instruments and the integration of automated mineralogy software with other geological and environmental data management systems further signal a dynamic and evolving market.
Automated Mineralogy Software Company Market Share
Automated Mineralogy Software Market Structure & Innovation Trends
The Automated Mineralogy Software market exhibits a moderately concentrated structure, dominated by key innovators and established players like Thermo Fisher Scientific, Oxford Instruments, Bruker, HITACHI, ZEISS, CAMECA (Ametek), and Beijing Opton. Innovation is primarily driven by advancements in microscopy, data processing algorithms, and artificial intelligence, leading to enhanced accuracy, speed, and scope of mineral characterization. Regulatory frameworks concerning environmental standards and resource extraction efficiency indirectly influence software development and adoption. Product substitutes, such as manual analysis and less advanced digital tools, are gradually being phased out as automated solutions offer superior throughput and data richness. End-user demographics span research institutions, mining and exploration companies, mineral processing facilities, and environmental monitoring agencies, all seeking precise and efficient mineral identification. Mergers and acquisitions (M&A) are infrequent but significant, with past deals valued in the hundreds of millions, aimed at consolidating market share and acquiring specialized technologies. The projected market share for leading solutions is expected to grow by approximately 15% annually in the coming years.
Automated Mineralogy Software Market Dynamics & Trends
The Automated Mineralogy Software market is poised for significant expansion, driven by a confluence of technological advancements, increasing demand for resource efficiency, and growing investments in geological research and mining operations. The historical period from 2019 to 2024 witnessed steady growth, fueled by the burgeoning need for precise mineral identification in the mining sector. The base year of 2025 marks a crucial juncture, with an estimated market size of over ten million dollars. The forecast period, from 2025 to 2033, projects a robust Compound Annual Growth Rate (CAGR) of approximately 12%, reflecting sustained demand and innovation.
Technological disruptions are at the forefront of market evolution. The integration of Artificial Intelligence (AI) and Machine Learning (ML) algorithms into SEM-EDS (Scanning Electron Microscopy - Energy Dispersive X-ray Spectroscopy) and XRF (X-ray Fluorescence) based software is revolutionizing mineral analysis. These advancements enable faster, more accurate, and more comprehensive mineral identification, quantification, and textural analysis, significantly reducing human error and analysis time. Improved data processing capabilities and cloud-based solutions are further enhancing accessibility and collaborative research.
Consumer preferences are increasingly shifting towards solutions that offer higher throughput, greater automation, and more detailed analytical outputs. The demand for real-time data analysis and integrated workflows, from sample preparation to final reporting, is on the rise. End-users are seeking software that can handle complex mineral assemblages, provide detailed liberation and association data for mineral processing optimization, and contribute to more accurate geological resource estimation. Furthermore, environmental monitoring applications are gaining traction, with automated mineralogy software playing a crucial role in identifying and quantifying pollutants and understanding their geological context.
Competitive dynamics within the market are characterized by fierce innovation and strategic partnerships. Key players are continuously investing in R&D to develop proprietary algorithms and enhanced hardware integrations. The market penetration of advanced automated mineralogy solutions is expected to accelerate as the benefits of increased efficiency and data accuracy become more apparent to a wider range of industry professionals. The ongoing digital transformation across industries, including mining and geology, further propels the adoption of sophisticated analytical tools like automated mineralogy software.
Dominant Regions & Segments in Automated Mineralogy Software
The Automated Mineralogy Software market demonstrates distinct regional dominance and segment leadership, with North America and Europe currently leading the charge in adoption and innovation. These regions benefit from established mining industries, significant investment in geological research, and a strong emphasis on environmental regulations, driving the demand for advanced analytical tools. Within these dominant regions, countries like the United States, Canada, Germany, and the United Kingdom are at the forefront, supported by robust academic research institutions and forward-thinking industrial sectors.
Application Dominance:
- Mining & Exploration: This segment consistently commands the largest market share, projected to exceed six million dollars by 2028. The imperative to discover and efficiently extract mineral resources fuels the demand for precise and rapid mineral identification and quantification. Economic policies supporting resource development and investments in exploration technologies are key drivers. The discovery of new mineral deposits and the optimization of existing mines directly translate into increased adoption of automated mineralogy software for grade control, ore characterization, and reserve estimation.
- Mineral Processing: Experiencing significant growth with an estimated market size of over three million dollars by 2028, this segment is driven by the need for process optimization. Software that provides detailed liberation and association data is crucial for maximizing recovery rates and minimizing waste. Energy efficiency mandates and the pursuit of circular economy principles in resource utilization further bolster its importance.
- Geological Research: Valued at approximately two million dollars by 2028, this segment benefits from ongoing academic and governmental research into Earth sciences, resource management, and climate change. Government funding for scientific research and the development of advanced analytical capabilities in universities are key contributors.
- Environmental Monitoring: While currently a smaller segment, it is projected for substantial growth, reaching over one million dollars by 2028. Stringent environmental regulations and increased awareness of the impact of mining and industrial activities on ecosystems are driving the need for accurate mineral identification in soil, water, and air samples.
Type Dominance:
- SEM-EDS Based Software: This type of software holds the largest market share, estimated at over seven million dollars by 2028, due to its high resolution, elemental analysis capabilities, and ability to characterize microstructures. Advancements in SEM technology and the increasing sophistication of EDS detectors directly influence its dominance. The ability to provide detailed textural and phase information makes it indispensable for complex geological and material science applications.
- X-ray Fluorescence (XRF) Based Software: Valued at approximately five million dollars by 2028, XRF-based software is favored for its speed, non-destructive analysis, and ability to handle a wide range of sample types. Its use in bulk elemental analysis and field-based applications contributes to its significant market presence. The portability and relative ease of use of XRF instruments, coupled with advanced software, make it a popular choice for initial screening and rapid analysis.
Automated Mineralogy Software Product Innovations
Automated mineralogy software is experiencing a rapid evolution, marked by the integration of AI-powered analytical engines, machine learning for predictive modeling, and cloud-based platforms for seamless data sharing and collaboration. These innovations are enhancing the speed, accuracy, and depth of mineral characterization, offering unparalleled insights into mineral phases, textures, and compositions. Key developments include algorithms that automate the identification of complex mineral assemblages, provide detailed liberation and association data for mineral processing, and generate comprehensive reports for geological research and environmental monitoring. The competitive advantage lies in the software's ability to reduce analysis time, minimize human error, and unlock new levels of understanding from geological samples.
Report Scope & Segmentation Analysis
This report comprehensively analyzes the Automated Mineralogy Software market, encompassing segmentation by application and software type.
Application Segmentation:
- Mining & Exploration: This segment, representing the largest market share, focuses on resource discovery, grade control, and reserve estimation. Growth is driven by global demand for minerals and advancements in exploration technologies.
- Mineral Processing: This segment is crucial for optimizing ore beneficiation, focusing on liberation, association, and recovery rates. Market growth is tied to the efficiency and sustainability of extraction processes.
- Geological Research: This segment supports academic and governmental studies, contributing to a deeper understanding of Earth processes and natural resources. It is influenced by research funding and scientific inquiry.
- Environmental Monitoring: This emerging segment addresses the identification and quantification of contaminants and their geological context. Growth is propelled by stringent environmental regulations and concerns for ecological health.
Type Segmentation:
- SEM-EDS Based Software: This category, leading in market share, offers high-resolution imaging and elemental analysis for detailed microstructural characterization. Advancements in SEM and EDS technologies fuel its segment growth.
- X-ray Fluorescence (XRF) Based Software: This segment provides rapid, non-destructive bulk elemental analysis, suitable for a wide range of sample types and field applications. Its segment growth is driven by speed and accessibility.
Key Drivers of Automated Mineralogy Software Growth
The growth of the Automated Mineralogy Software market is propelled by several key factors. Firstly, the escalating global demand for essential minerals and metals, driven by industrialization and technological advancements, necessitates more efficient and accurate exploration and extraction processes. Secondly, continuous technological innovation, particularly in AI, machine learning, and advanced microscopy (SEM-EDS, XRF), is enhancing the capabilities of automated mineralogy software, leading to faster, more precise, and comprehensive analyses. Thirdly, increasing environmental regulations and a growing focus on sustainable resource management are driving the adoption of software that can accurately assess mineral composition and potential environmental impacts. Finally, significant investments in geological research and development across various industries further fuel the demand for sophisticated analytical tools.
Challenges in the Automated Mineralogy Software Sector
Despite its growth potential, the Automated Mineralogy Software sector faces several challenges. The high initial cost of advanced hardware and software solutions can be a significant barrier, particularly for smaller companies or research institutions with limited budgets. Furthermore, the need for highly skilled personnel to operate and interpret the data generated by these sophisticated systems can lead to workforce training challenges. Regulatory hurdles, while often driving adoption, can also impose compliance costs and require ongoing updates to software functionalities. Supply chain disruptions for critical hardware components, as witnessed in recent years, can impact product availability and lead times. Finally, the competitive pressure from established players and emerging technologies necessitates continuous innovation and investment, which can strain resources.
Emerging Opportunities in Automated Mineralogy Software
Emerging opportunities within the Automated Mineralogy Software market are abundant and diverse. The increasing demand for critical minerals used in renewable energy technologies, such as batteries and electric vehicles, presents a significant growth avenue. Furthermore, the expansion of geological research into new frontiers, including extraterrestrial mineralogy and subsurface resource mapping, opens up novel applications. The growing emphasis on the circular economy and waste valorization creates opportunities for software that can accurately characterize recycled materials and industrial by-products. Advancements in quantum computing and big data analytics are expected to unlock new predictive capabilities for mineral exploration and resource forecasting. The development of more user-friendly, cloud-based solutions will also broaden market accessibility, particularly for emerging economies.
Leading Players in the Automated Mineralogy Software Market
Thermo Fisher Scientific Oxford Instruments Bruker HITACHI ZEISS CAMECA (Ametek) Beijing Opton
Key Developments in Automated Mineralogy Software Industry
- 2023/08: Introduction of advanced AI algorithms for automated mineral identification, significantly reducing analysis time and improving accuracy for complex samples.
- 2023/04: Launch of cloud-based data management platforms, enhancing collaboration and accessibility for research teams globally.
- 2022/11: Release of integrated SEM-EDS and XRF software suites, offering a more comprehensive analytical workflow.
- 2022/07: Significant investment in R&D by leading companies to incorporate machine learning for predictive mineral resource modeling.
- 2021/10: Increased focus on software solutions for environmental mineralogy, supporting contaminant analysis and remediation efforts.
- 2020/05: Development of enhanced textural analysis capabilities within SEM-EDS software for detailed petrographic studies.
Future Outlook for Automated Mineralogy Software Market
The future outlook for the Automated Mineralogy Software market is exceptionally bright, driven by sustained global demand for minerals, rapid technological advancements, and an increasing focus on sustainability and resource efficiency. The market is projected to experience continued robust growth, with an estimated market expansion of over 20% in the next five years. The increasing integration of AI and machine learning will further enhance analytical capabilities, enabling more sophisticated predictive modeling and automated discovery processes. The growing importance of critical minerals for the energy transition and the circular economy will create new market segments and drive demand for specialized software solutions. Furthermore, the development of more accessible and user-friendly platforms, coupled with cloud computing advancements, will broaden market penetration and foster greater collaboration among researchers and industry professionals worldwide.
Automated Mineralogy Software Segmentation
-
1. Application
- 1.1. Mining & Exploration
- 1.2. Mineral Processing
- 1.3. Geological Research
- 1.4. Environmental Monitoring
-
2. Type
- 2.1. SEM-EDS Based Software
- 2.2. X-ray Fluorescence (XRF) Based Software
Automated Mineralogy Software Segmentation By Geography
-
1. North America
- 1.1. United States
- 1.2. Canada
- 1.3. Mexico
-
2. South America
- 2.1. Brazil
- 2.2. Argentina
- 2.3. Rest of South America
-
3. Europe
- 3.1. United Kingdom
- 3.2. Germany
- 3.3. France
- 3.4. Italy
- 3.5. Spain
- 3.6. Russia
- 3.7. Benelux
- 3.8. Nordics
- 3.9. Rest of Europe
-
4. Middle East & Africa
- 4.1. Turkey
- 4.2. Israel
- 4.3. GCC
- 4.4. North Africa
- 4.5. South Africa
- 4.6. Rest of Middle East & Africa
-
5. Asia Pacific
- 5.1. China
- 5.2. India
- 5.3. Japan
- 5.4. South Korea
- 5.5. ASEAN
- 5.6. Oceania
- 5.7. Rest of Asia Pacific
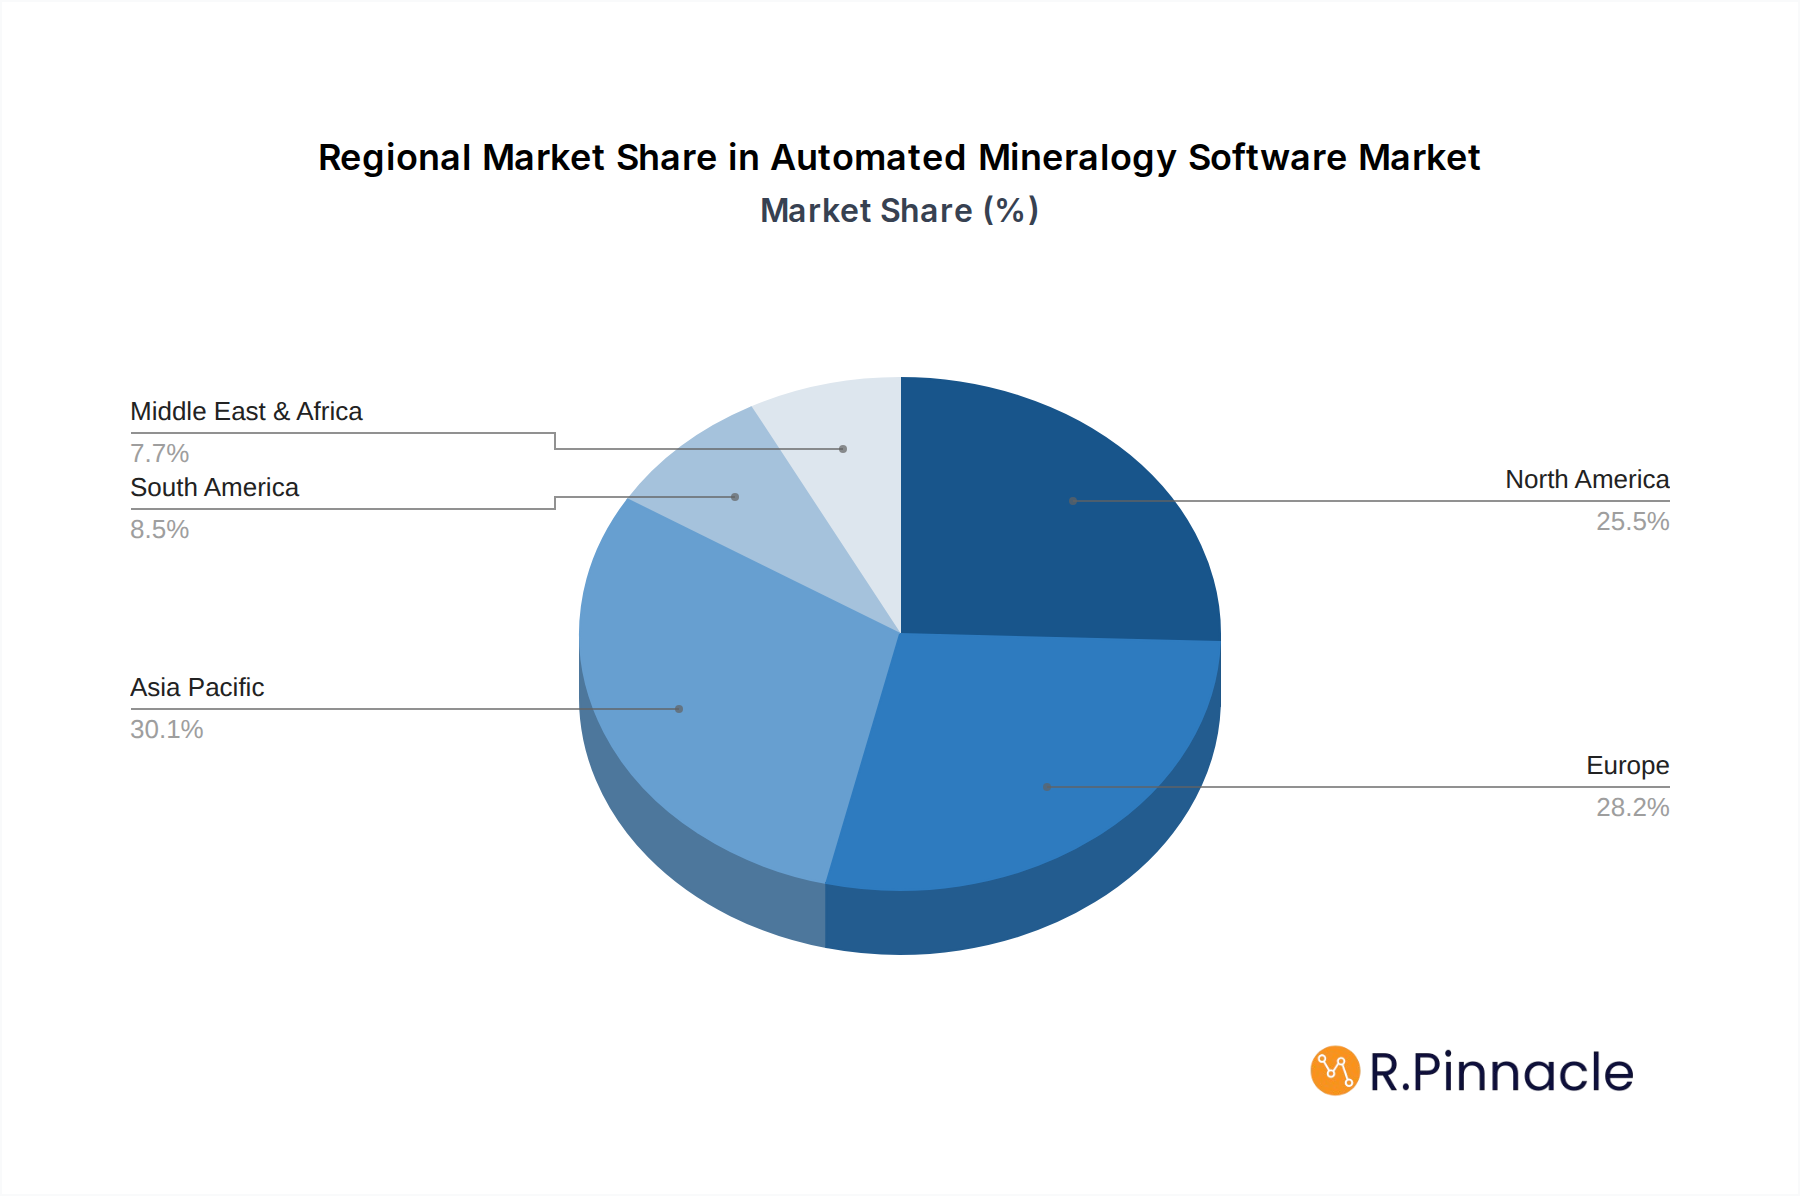
Automated Mineralogy Software Regional Market Share
Geographic Coverage of Automated Mineralogy Software
Automated Mineralogy Software REPORT HIGHLIGHTS
| Aspects | Details |
|---|---|
| Study Period | 2020-2034 |
| Base Year | 2025 |
| Estimated Year | 2026 |
| Forecast Period | 2026-2034 |
| Historical Period | 2020-2025 |
| Growth Rate | CAGR of 8.4% from 2020-2034 |
| Segmentation |
|
Table of Contents
- 1. Introduction
- 1.1. Research Scope
- 1.2. Market Segmentation
- 1.3. Research Methodology
- 1.4. Definitions and Assumptions
- 2. Executive Summary
- 2.1. Introduction
- 3. Market Dynamics
- 3.1. Introduction
- 3.2. Market Drivers
- 3.3. Market Restrains
- 3.4. Market Trends
- 4. Market Factor Analysis
- 4.1. Porters Five Forces
- 4.2. Supply/Value Chain
- 4.3. PESTEL analysis
- 4.4. Market Entropy
- 4.5. Patent/Trademark Analysis
- 5. Global Automated Mineralogy Software Analysis, Insights and Forecast, 2020-2032
- 5.1. Market Analysis, Insights and Forecast - by Application
- 5.1.1. Mining & Exploration
- 5.1.2. Mineral Processing
- 5.1.3. Geological Research
- 5.1.4. Environmental Monitoring
- 5.2. Market Analysis, Insights and Forecast - by Type
- 5.2.1. SEM-EDS Based Software
- 5.2.2. X-ray Fluorescence (XRF) Based Software
- 5.3. Market Analysis, Insights and Forecast - by Region
- 5.3.1. North America
- 5.3.2. South America
- 5.3.3. Europe
- 5.3.4. Middle East & Africa
- 5.3.5. Asia Pacific
- 5.1. Market Analysis, Insights and Forecast - by Application
- 6. North America Automated Mineralogy Software Analysis, Insights and Forecast, 2020-2032
- 6.1. Market Analysis, Insights and Forecast - by Application
- 6.1.1. Mining & Exploration
- 6.1.2. Mineral Processing
- 6.1.3. Geological Research
- 6.1.4. Environmental Monitoring
- 6.2. Market Analysis, Insights and Forecast - by Type
- 6.2.1. SEM-EDS Based Software
- 6.2.2. X-ray Fluorescence (XRF) Based Software
- 6.1. Market Analysis, Insights and Forecast - by Application
- 7. South America Automated Mineralogy Software Analysis, Insights and Forecast, 2020-2032
- 7.1. Market Analysis, Insights and Forecast - by Application
- 7.1.1. Mining & Exploration
- 7.1.2. Mineral Processing
- 7.1.3. Geological Research
- 7.1.4. Environmental Monitoring
- 7.2. Market Analysis, Insights and Forecast - by Type
- 7.2.1. SEM-EDS Based Software
- 7.2.2. X-ray Fluorescence (XRF) Based Software
- 7.1. Market Analysis, Insights and Forecast - by Application
- 8. Europe Automated Mineralogy Software Analysis, Insights and Forecast, 2020-2032
- 8.1. Market Analysis, Insights and Forecast - by Application
- 8.1.1. Mining & Exploration
- 8.1.2. Mineral Processing
- 8.1.3. Geological Research
- 8.1.4. Environmental Monitoring
- 8.2. Market Analysis, Insights and Forecast - by Type
- 8.2.1. SEM-EDS Based Software
- 8.2.2. X-ray Fluorescence (XRF) Based Software
- 8.1. Market Analysis, Insights and Forecast - by Application
- 9. Middle East & Africa Automated Mineralogy Software Analysis, Insights and Forecast, 2020-2032
- 9.1. Market Analysis, Insights and Forecast - by Application
- 9.1.1. Mining & Exploration
- 9.1.2. Mineral Processing
- 9.1.3. Geological Research
- 9.1.4. Environmental Monitoring
- 9.2. Market Analysis, Insights and Forecast - by Type
- 9.2.1. SEM-EDS Based Software
- 9.2.2. X-ray Fluorescence (XRF) Based Software
- 9.1. Market Analysis, Insights and Forecast - by Application
- 10. Asia Pacific Automated Mineralogy Software Analysis, Insights and Forecast, 2020-2032
- 10.1. Market Analysis, Insights and Forecast - by Application
- 10.1.1. Mining & Exploration
- 10.1.2. Mineral Processing
- 10.1.3. Geological Research
- 10.1.4. Environmental Monitoring
- 10.2. Market Analysis, Insights and Forecast - by Type
- 10.2.1. SEM-EDS Based Software
- 10.2.2. X-ray Fluorescence (XRF) Based Software
- 10.1. Market Analysis, Insights and Forecast - by Application
- 11. Competitive Analysis
- 11.1. Global Market Share Analysis 2025
- 11.2. Company Profiles
- 11.2.1 Thermo Fisher Scientific
- 11.2.1.1. Overview
- 11.2.1.2. Products
- 11.2.1.3. SWOT Analysis
- 11.2.1.4. Recent Developments
- 11.2.1.5. Financials (Based on Availability)
- 11.2.2 Oxford Instruments
- 11.2.2.1. Overview
- 11.2.2.2. Products
- 11.2.2.3. SWOT Analysis
- 11.2.2.4. Recent Developments
- 11.2.2.5. Financials (Based on Availability)
- 11.2.3 Bruker
- 11.2.3.1. Overview
- 11.2.3.2. Products
- 11.2.3.3. SWOT Analysis
- 11.2.3.4. Recent Developments
- 11.2.3.5. Financials (Based on Availability)
- 11.2.4 HITACHI
- 11.2.4.1. Overview
- 11.2.4.2. Products
- 11.2.4.3. SWOT Analysis
- 11.2.4.4. Recent Developments
- 11.2.4.5. Financials (Based on Availability)
- 11.2.5 ZEISS
- 11.2.5.1. Overview
- 11.2.5.2. Products
- 11.2.5.3. SWOT Analysis
- 11.2.5.4. Recent Developments
- 11.2.5.5. Financials (Based on Availability)
- 11.2.6 CAMECA (Ametek)
- 11.2.6.1. Overview
- 11.2.6.2. Products
- 11.2.6.3. SWOT Analysis
- 11.2.6.4. Recent Developments
- 11.2.6.5. Financials (Based on Availability)
- 11.2.7 Beijing Opton
- 11.2.7.1. Overview
- 11.2.7.2. Products
- 11.2.7.3. SWOT Analysis
- 11.2.7.4. Recent Developments
- 11.2.7.5. Financials (Based on Availability)
- 11.2.1 Thermo Fisher Scientific
List of Figures
- Figure 1: Global Automated Mineralogy Software Revenue Breakdown (million, %) by Region 2025 & 2033
- Figure 2: North America Automated Mineralogy Software Revenue (million), by Application 2025 & 2033
- Figure 3: North America Automated Mineralogy Software Revenue Share (%), by Application 2025 & 2033
- Figure 4: North America Automated Mineralogy Software Revenue (million), by Type 2025 & 2033
- Figure 5: North America Automated Mineralogy Software Revenue Share (%), by Type 2025 & 2033
- Figure 6: North America Automated Mineralogy Software Revenue (million), by Country 2025 & 2033
- Figure 7: North America Automated Mineralogy Software Revenue Share (%), by Country 2025 & 2033
- Figure 8: South America Automated Mineralogy Software Revenue (million), by Application 2025 & 2033
- Figure 9: South America Automated Mineralogy Software Revenue Share (%), by Application 2025 & 2033
- Figure 10: South America Automated Mineralogy Software Revenue (million), by Type 2025 & 2033
- Figure 11: South America Automated Mineralogy Software Revenue Share (%), by Type 2025 & 2033
- Figure 12: South America Automated Mineralogy Software Revenue (million), by Country 2025 & 2033
- Figure 13: South America Automated Mineralogy Software Revenue Share (%), by Country 2025 & 2033
- Figure 14: Europe Automated Mineralogy Software Revenue (million), by Application 2025 & 2033
- Figure 15: Europe Automated Mineralogy Software Revenue Share (%), by Application 2025 & 2033
- Figure 16: Europe Automated Mineralogy Software Revenue (million), by Type 2025 & 2033
- Figure 17: Europe Automated Mineralogy Software Revenue Share (%), by Type 2025 & 2033
- Figure 18: Europe Automated Mineralogy Software Revenue (million), by Country 2025 & 2033
- Figure 19: Europe Automated Mineralogy Software Revenue Share (%), by Country 2025 & 2033
- Figure 20: Middle East & Africa Automated Mineralogy Software Revenue (million), by Application 2025 & 2033
- Figure 21: Middle East & Africa Automated Mineralogy Software Revenue Share (%), by Application 2025 & 2033
- Figure 22: Middle East & Africa Automated Mineralogy Software Revenue (million), by Type 2025 & 2033
- Figure 23: Middle East & Africa Automated Mineralogy Software Revenue Share (%), by Type 2025 & 2033
- Figure 24: Middle East & Africa Automated Mineralogy Software Revenue (million), by Country 2025 & 2033
- Figure 25: Middle East & Africa Automated Mineralogy Software Revenue Share (%), by Country 2025 & 2033
- Figure 26: Asia Pacific Automated Mineralogy Software Revenue (million), by Application 2025 & 2033
- Figure 27: Asia Pacific Automated Mineralogy Software Revenue Share (%), by Application 2025 & 2033
- Figure 28: Asia Pacific Automated Mineralogy Software Revenue (million), by Type 2025 & 2033
- Figure 29: Asia Pacific Automated Mineralogy Software Revenue Share (%), by Type 2025 & 2033
- Figure 30: Asia Pacific Automated Mineralogy Software Revenue (million), by Country 2025 & 2033
- Figure 31: Asia Pacific Automated Mineralogy Software Revenue Share (%), by Country 2025 & 2033
List of Tables
- Table 1: Global Automated Mineralogy Software Revenue million Forecast, by Application 2020 & 2033
- Table 2: Global Automated Mineralogy Software Revenue million Forecast, by Type 2020 & 2033
- Table 3: Global Automated Mineralogy Software Revenue million Forecast, by Region 2020 & 2033
- Table 4: Global Automated Mineralogy Software Revenue million Forecast, by Application 2020 & 2033
- Table 5: Global Automated Mineralogy Software Revenue million Forecast, by Type 2020 & 2033
- Table 6: Global Automated Mineralogy Software Revenue million Forecast, by Country 2020 & 2033
- Table 7: United States Automated Mineralogy Software Revenue (million) Forecast, by Application 2020 & 2033
- Table 8: Canada Automated Mineralogy Software Revenue (million) Forecast, by Application 2020 & 2033
- Table 9: Mexico Automated Mineralogy Software Revenue (million) Forecast, by Application 2020 & 2033
- Table 10: Global Automated Mineralogy Software Revenue million Forecast, by Application 2020 & 2033
- Table 11: Global Automated Mineralogy Software Revenue million Forecast, by Type 2020 & 2033
- Table 12: Global Automated Mineralogy Software Revenue million Forecast, by Country 2020 & 2033
- Table 13: Brazil Automated Mineralogy Software Revenue (million) Forecast, by Application 2020 & 2033
- Table 14: Argentina Automated Mineralogy Software Revenue (million) Forecast, by Application 2020 & 2033
- Table 15: Rest of South America Automated Mineralogy Software Revenue (million) Forecast, by Application 2020 & 2033
- Table 16: Global Automated Mineralogy Software Revenue million Forecast, by Application 2020 & 2033
- Table 17: Global Automated Mineralogy Software Revenue million Forecast, by Type 2020 & 2033
- Table 18: Global Automated Mineralogy Software Revenue million Forecast, by Country 2020 & 2033
- Table 19: United Kingdom Automated Mineralogy Software Revenue (million) Forecast, by Application 2020 & 2033
- Table 20: Germany Automated Mineralogy Software Revenue (million) Forecast, by Application 2020 & 2033
- Table 21: France Automated Mineralogy Software Revenue (million) Forecast, by Application 2020 & 2033
- Table 22: Italy Automated Mineralogy Software Revenue (million) Forecast, by Application 2020 & 2033
- Table 23: Spain Automated Mineralogy Software Revenue (million) Forecast, by Application 2020 & 2033
- Table 24: Russia Automated Mineralogy Software Revenue (million) Forecast, by Application 2020 & 2033
- Table 25: Benelux Automated Mineralogy Software Revenue (million) Forecast, by Application 2020 & 2033
- Table 26: Nordics Automated Mineralogy Software Revenue (million) Forecast, by Application 2020 & 2033
- Table 27: Rest of Europe Automated Mineralogy Software Revenue (million) Forecast, by Application 2020 & 2033
- Table 28: Global Automated Mineralogy Software Revenue million Forecast, by Application 2020 & 2033
- Table 29: Global Automated Mineralogy Software Revenue million Forecast, by Type 2020 & 2033
- Table 30: Global Automated Mineralogy Software Revenue million Forecast, by Country 2020 & 2033
- Table 31: Turkey Automated Mineralogy Software Revenue (million) Forecast, by Application 2020 & 2033
- Table 32: Israel Automated Mineralogy Software Revenue (million) Forecast, by Application 2020 & 2033
- Table 33: GCC Automated Mineralogy Software Revenue (million) Forecast, by Application 2020 & 2033
- Table 34: North Africa Automated Mineralogy Software Revenue (million) Forecast, by Application 2020 & 2033
- Table 35: South Africa Automated Mineralogy Software Revenue (million) Forecast, by Application 2020 & 2033
- Table 36: Rest of Middle East & Africa Automated Mineralogy Software Revenue (million) Forecast, by Application 2020 & 2033
- Table 37: Global Automated Mineralogy Software Revenue million Forecast, by Application 2020 & 2033
- Table 38: Global Automated Mineralogy Software Revenue million Forecast, by Type 2020 & 2033
- Table 39: Global Automated Mineralogy Software Revenue million Forecast, by Country 2020 & 2033
- Table 40: China Automated Mineralogy Software Revenue (million) Forecast, by Application 2020 & 2033
- Table 41: India Automated Mineralogy Software Revenue (million) Forecast, by Application 2020 & 2033
- Table 42: Japan Automated Mineralogy Software Revenue (million) Forecast, by Application 2020 & 2033
- Table 43: South Korea Automated Mineralogy Software Revenue (million) Forecast, by Application 2020 & 2033
- Table 44: ASEAN Automated Mineralogy Software Revenue (million) Forecast, by Application 2020 & 2033
- Table 45: Oceania Automated Mineralogy Software Revenue (million) Forecast, by Application 2020 & 2033
- Table 46: Rest of Asia Pacific Automated Mineralogy Software Revenue (million) Forecast, by Application 2020 & 2033
Frequently Asked Questions
1. What is the projected Compound Annual Growth Rate (CAGR) of the Automated Mineralogy Software?
The projected CAGR is approximately 8.4%.
2. Which companies are prominent players in the Automated Mineralogy Software?
Key companies in the market include Thermo Fisher Scientific, Oxford Instruments, Bruker, HITACHI, ZEISS, CAMECA (Ametek), Beijing Opton.
3. What are the main segments of the Automated Mineralogy Software?
The market segments include Application, Type.
4. Can you provide details about the market size?
The market size is estimated to be USD 105 million as of 2022.
5. What are some drivers contributing to market growth?
N/A
6. What are the notable trends driving market growth?
N/A
7. Are there any restraints impacting market growth?
N/A
8. Can you provide examples of recent developments in the market?
N/A
9. What pricing options are available for accessing the report?
Pricing options include single-user, multi-user, and enterprise licenses priced at USD 2900.00, USD 4350.00, and USD 5800.00 respectively.
10. Is the market size provided in terms of value or volume?
The market size is provided in terms of value, measured in million.
11. Are there any specific market keywords associated with the report?
Yes, the market keyword associated with the report is "Automated Mineralogy Software," which aids in identifying and referencing the specific market segment covered.
12. How do I determine which pricing option suits my needs best?
The pricing options vary based on user requirements and access needs. Individual users may opt for single-user licenses, while businesses requiring broader access may choose multi-user or enterprise licenses for cost-effective access to the report.
13. Are there any additional resources or data provided in the Automated Mineralogy Software report?
While the report offers comprehensive insights, it's advisable to review the specific contents or supplementary materials provided to ascertain if additional resources or data are available.
14. How can I stay updated on further developments or reports in the Automated Mineralogy Software?
To stay informed about further developments, trends, and reports in the Automated Mineralogy Software, consider subscribing to industry newsletters, following relevant companies and organizations, or regularly checking reputable industry news sources and publications.
Methodology
Step 1 - Identification of Relevant Samples Size from Population Database


Step 2 - Approaches for Defining Global Market Size (Value, Volume* & Price*)

Note*: In applicable scenarios
Step 3 - Data Sources
Primary Research
- Web Analytics
- Survey Reports
- Research Institute
- Latest Research Reports
- Opinion Leaders
Secondary Research
- Annual Reports
- White Paper
- Latest Press Release
- Industry Association
- Paid Database
- Investor Presentations

Step 4 - Data Triangulation
Involves using different sources of information in order to increase the validity of a study
These sources are likely to be stakeholders in a program - participants, other researchers, program staff, other community members, and so on.
Then we put all data in single framework & apply various statistical tools to find out the dynamic on the market.
During the analysis stage, feedback from the stakeholder groups would be compared to determine areas of agreement as well as areas of divergence