
Key Insights
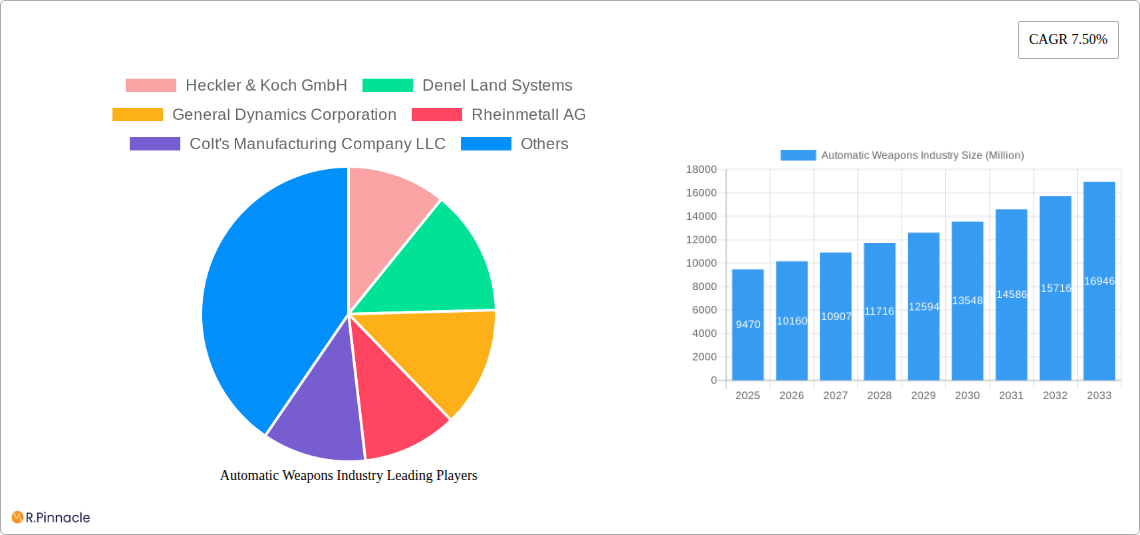
The global automatic weapons market, valued at $9.47 billion in 2025, is projected to experience robust growth, driven by escalating geopolitical instability, increasing defense budgets worldwide, and the modernization of armed forces. The market's Compound Annual Growth Rate (CAGR) of 7.50% from 2025 to 2033 indicates a significant expansion. Key drivers include the demand for advanced weaponry with enhanced accuracy, range, and lethality, coupled with the adoption of lighter, more portable automatic weapons for special forces and asymmetric warfare. Technological advancements like improved ammunition, integrated targeting systems, and the integration of smart technologies are further fueling market growth. While the market faces restraints such as stringent regulations on arms sales and ethical concerns surrounding the use of lethal weaponry, the ongoing demand for national security and counter-terrorism operations will continue to drive market expansion throughout the forecast period. Segmentation analysis reveals significant market shares held by automatic rifles and machine guns across various platforms (land, airborne, naval). North America and Europe are currently the dominant regions, though the Asia-Pacific region is poised for substantial growth driven by rising defense spending in countries like China and India. The competitive landscape is characterized by established players like Heckler & Koch, General Dynamics, and Rheinmetall, along with emerging regional manufacturers. These companies are actively investing in research and development to maintain a competitive edge, fostering innovation in automatic weapons design and manufacturing.
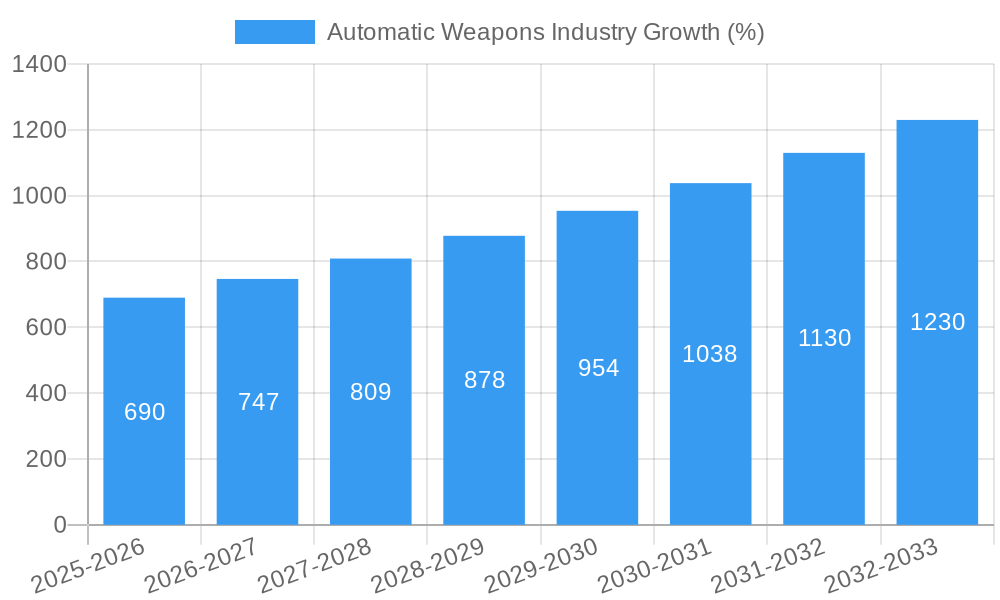
The forecast period from 2025 to 2033 anticipates considerable growth in the automatic weapons market. This expansion is expected to be driven by continuous investment in military modernization and the evolving needs of defense forces around the world. The steady adoption of technologically advanced weaponry across multiple platforms—land, air, and sea—will be a major catalyst for market expansion. Regional growth is expected to vary, with specific markets within Asia-Pacific and the Middle East and Africa experiencing above-average growth due to escalating regional conflicts and rising defense budgets. The continuing emphasis on sophisticated targeting systems, increased firepower, and enhanced operational capabilities will play a significant role in shaping the market's trajectory. Despite regulatory challenges and ethical concerns, the demand for improved security and counter-terrorism capabilities is expected to outweigh these restraints and fuel sustained market growth throughout the forecast period.
Automatic Weapons Industry Market Report: 2019-2033
This comprehensive report provides an in-depth analysis of the Automatic Weapons Industry, projecting market trends and developments from 2019 to 2033. Leveraging extensive data and expert insights, this report is an invaluable resource for industry professionals, investors, and strategic decision-makers. The report covers key market segments, leading players, and emerging opportunities, offering actionable intelligence for navigating this dynamic sector. The study period covers 2019-2033, with a base year of 2025 and a forecast period of 2025-2033.
Automatic Weapons Industry Market Structure & Innovation Trends
This section analyzes the competitive landscape, focusing on market concentration, innovation drivers, regulatory frameworks, and M&A activity within the Automatic Weapons Industry. The global market size in 2025 is estimated at USD xx Million.
Market Concentration: The market exhibits a moderately concentrated structure, with several major players holding significant market share. Heckler & Koch, General Dynamics, and Rheinmetall are among the leading companies, collectively accounting for an estimated xx% of the market in 2025. Smaller players compete intensely, particularly in niche segments.
Innovation Drivers: Key innovation drivers include advancements in materials science (lighter weight, durable materials), improved ergonomics and user interfaces, and integration of advanced technologies such as smart targeting systems.
Regulatory Frameworks: Stringent export controls, licensing requirements, and end-user restrictions significantly influence market dynamics. Regional variations in regulatory frameworks further complicate market access and operations.
Product Substitutes: Limited direct substitutes exist, but the increasing adoption of unmanned aerial vehicles (UAVs) and other remotely operated weaponry may present some indirect substitution.
End-User Demographics: The primary end-users are military forces globally, followed by law enforcement agencies. Government budgets and procurement strategies are major factors driving market demand.
M&A Activities: The historical period (2019-2024) saw a moderate level of M&A activity, with deal values totaling an estimated USD xx Million. Consolidation is expected to continue, driven by the pursuit of economies of scale and access to new technologies.
Automatic Weapons Industry Market Dynamics & Trends
This section details the market's growth trajectory, analyzing factors influencing its expansion. The compound annual growth rate (CAGR) from 2025 to 2033 is projected at xx%, driven by several key factors. Market penetration in key regions is expected to increase by xx% over the forecast period.
The global market is experiencing robust growth fueled by rising defense budgets in several regions, particularly in Asia-Pacific and the Middle East. Technological advancements, leading to improved weapon accuracy and lethality, further stimulate demand. Growing geopolitical instability and conflicts worldwide contribute to increased investment in military hardware. However, shifting consumer preferences toward precision-guided munitions and the adoption of alternative conflict resolution strategies could exert some moderating influence on market expansion. The competitive dynamics are characterized by intense rivalry among established players, with ongoing efforts to enhance product offerings and expand market share.
Dominant Regions & Segments in Automatic Weapons Industry
This section identifies leading regions and segments within the automatic weapons market.
Leading Region: North America currently holds the largest market share, driven by substantial defense spending and technological advancements. However, the Asia-Pacific region is projected to experience the fastest growth rate due to increased military modernization programs and geopolitical tensions.
Leading Segments:
Type: Machine guns currently dominate the market, followed by automatic rifles. The demand for automatic launchers and automatic cannons is also significant, particularly within the military sector.
Platform: Land-based systems account for the largest market share. However, growing demand for airborne and naval applications, driven by ongoing military modernization efforts, is expected to fuel growth in these segments.
Key Drivers (by Region):
- North America: High defense budgets, technological innovation, and a robust domestic industry.
- Europe: Significant military spending, particularly within NATO countries, and a strong presence of established manufacturers.
- Asia-Pacific: Rapid military modernization, geopolitical tensions, and increasing defense budgets.
- Middle East: Ongoing regional conflicts and substantial investment in defense capabilities.
Automatic Weapons Industry Product Innovations
Recent product innovations focus on reducing weight without compromising performance. Examples include the lighter M240L machine gun and the integration of advanced targeting systems. This enhances accuracy and effectiveness, improving the overall market fit of automatic weapons. The industry shows a strong trend toward modularity, allowing for customization based on user needs.
Report Scope & Segmentation Analysis
This report comprehensively segments the automatic weapons market by type (Automatic Rifle, Machine Gun, Automatic launchers, Automatic Cannon, Gatling Gun) and platform (Land, Airborne, Naval). Each segment’s growth projections, market sizes, and competitive dynamics are detailed, providing a granular view of the industry's structure and dynamics. Growth projections vary considerably across segments, with machine guns maintaining a dominant position throughout the forecast period. The competitive dynamics within each segment are influenced by factors such as technological innovation, pricing strategies, and government procurement policies.
Key Drivers of Automatic Weapons Industry Growth
Key growth drivers include rising global defense spending, ongoing geopolitical instability, technological advancements (lighter, more accurate weapons), and the increasing demand for advanced weaponry for both conventional and asymmetric warfare. Furthermore, government initiatives promoting domestic production and modernization of armed forces are stimulating market expansion.
Challenges in the Automatic Weapons Industry Sector
Challenges include stringent regulations on arms exports, complex supply chains susceptible to disruptions, and intense competition among numerous established and emerging players. These factors influence both production costs and market access. Fluctuations in global economic conditions and the availability of funding for military procurement programs also pose challenges to sustainable market growth.
Emerging Opportunities in Automatic Weapons Industry
Emerging opportunities include the development of lighter and more precise weapons, the integration of smart technologies and advanced sensors, the expansion into new markets with growing defense spending, and the increasing demand for customized weapon systems tailored to specific operational needs. The growing adoption of unmanned systems offers a new avenue for growth.
Leading Players in the Automatic Weapons Industry Market
- Heckler & Koch GmbH
- Denel Land Systems
- General Dynamics Corporation
- Rheinmetall AG
- Colt's Manufacturing Company LLC
- UkrOboronProm
- Sig Sauer Inc
- Israel Weapon Industries (IWI) Ltd
- Singapore Technologies Engineering Ltd
- BAE Systems plc
- Northrop Grumman Corporation
- FN HERSTAL (Herstal Group)
Key Developments in Automatic Weapons Industry
March 2023: Israel's IWI received a USD xx Million order for 1,000 Negev light machine guns from Estonia, replacing older MG3 and KSP-58 models. This highlights the ongoing demand for modern, reliable light machine guns.
February 2022: FN America secured a USD 49 Million contract from the US Army for M240L medium machine guns. This underscores the ongoing focus on lightweight, high-performance machine guns.
Future Outlook for Automatic Weapons Industry Market
The Automatic Weapons Industry is poised for continued growth, driven by sustained defense spending, ongoing technological innovation, and geopolitical factors. Strategic opportunities exist for companies that can successfully develop and deploy lightweight, highly accurate, and technologically advanced weaponry that meets the evolving needs of global armed forces. The market's future hinges on adapting to the changing battlefield landscape and emerging technological advancements in the defense sector.
Automatic Weapons Industry Segmentation
-
1. Type
- 1.1. Automatic Rifle
- 1.2. Machine Gun
- 1.3. Automatic launchers
- 1.4. Automatic Cannon
- 1.5. Gatling Gun
-
2. Platform
- 2.1. Land
- 2.2. Airborne
- 2.3. Naval
Automatic Weapons Industry Segmentation By Geography
-
1. North America
- 1.1. United States
- 1.2. Canada
-
2. Europe
- 2.1. United Kingdom
- 2.2. Germany
- 2.3. France
- 2.4. Russia
- 2.5. Rest of Europe
-
3. Asia Pacific
- 3.1. China
- 3.2. India
- 3.3. Japan
- 3.4. South Korea
- 3.5. Rest of Asia Pacific
-
4. Latin America
- 4.1. Brazil
- 4.2. Rest of Latin America
-
5. Middle East and Africa
- 5.1. United Arab Emirates
- 5.2. Saudi Arabia
- 5.3. South Africa
- 5.4. Rest of Middle East and Africa

Automatic Weapons Industry REPORT HIGHLIGHTS
| Aspects | Details |
|---|---|
| Study Period | 2019-2033 |
| Base Year | 2024 |
| Estimated Year | 2025 |
| Forecast Period | 2025-2033 |
| Historical Period | 2019-2024 |
| Growth Rate | CAGR of 7.50% from 2019-2033 |
| Segmentation |
|
Table of Contents
- 1. Introduction
- 1.1. Research Scope
- 1.2. Market Segmentation
- 1.3. Research Methodology
- 1.4. Definitions and Assumptions
- 2. Executive Summary
- 2.1. Introduction
- 3. Market Dynamics
- 3.1. Introduction
- 3.2. Market Drivers
- 3.3. Market Restrains
- 3.4. Market Trends
- 3.4.1. Land Segment to Witness Highest Growth During the Forecast Period
- 4. Market Factor Analysis
- 4.1. Porters Five Forces
- 4.2. Supply/Value Chain
- 4.3. PESTEL analysis
- 4.4. Market Entropy
- 4.5. Patent/Trademark Analysis
- 5. Global Automatic Weapons Industry Analysis, Insights and Forecast, 2019-2031
- 5.1. Market Analysis, Insights and Forecast - by Type
- 5.1.1. Automatic Rifle
- 5.1.2. Machine Gun
- 5.1.3. Automatic launchers
- 5.1.4. Automatic Cannon
- 5.1.5. Gatling Gun
- 5.2. Market Analysis, Insights and Forecast - by Platform
- 5.2.1. Land
- 5.2.2. Airborne
- 5.2.3. Naval
- 5.3. Market Analysis, Insights and Forecast - by Region
- 5.3.1. North America
- 5.3.2. Europe
- 5.3.3. Asia Pacific
- 5.3.4. Latin America
- 5.3.5. Middle East and Africa
- 5.1. Market Analysis, Insights and Forecast - by Type
- 6. North America Automatic Weapons Industry Analysis, Insights and Forecast, 2019-2031
- 6.1. Market Analysis, Insights and Forecast - by Type
- 6.1.1. Automatic Rifle
- 6.1.2. Machine Gun
- 6.1.3. Automatic launchers
- 6.1.4. Automatic Cannon
- 6.1.5. Gatling Gun
- 6.2. Market Analysis, Insights and Forecast - by Platform
- 6.2.1. Land
- 6.2.2. Airborne
- 6.2.3. Naval
- 6.1. Market Analysis, Insights and Forecast - by Type
- 7. Europe Automatic Weapons Industry Analysis, Insights and Forecast, 2019-2031
- 7.1. Market Analysis, Insights and Forecast - by Type
- 7.1.1. Automatic Rifle
- 7.1.2. Machine Gun
- 7.1.3. Automatic launchers
- 7.1.4. Automatic Cannon
- 7.1.5. Gatling Gun
- 7.2. Market Analysis, Insights and Forecast - by Platform
- 7.2.1. Land
- 7.2.2. Airborne
- 7.2.3. Naval
- 7.1. Market Analysis, Insights and Forecast - by Type
- 8. Asia Pacific Automatic Weapons Industry Analysis, Insights and Forecast, 2019-2031
- 8.1. Market Analysis, Insights and Forecast - by Type
- 8.1.1. Automatic Rifle
- 8.1.2. Machine Gun
- 8.1.3. Automatic launchers
- 8.1.4. Automatic Cannon
- 8.1.5. Gatling Gun
- 8.2. Market Analysis, Insights and Forecast - by Platform
- 8.2.1. Land
- 8.2.2. Airborne
- 8.2.3. Naval
- 8.1. Market Analysis, Insights and Forecast - by Type
- 9. Latin America Automatic Weapons Industry Analysis, Insights and Forecast, 2019-2031
- 9.1. Market Analysis, Insights and Forecast - by Type
- 9.1.1. Automatic Rifle
- 9.1.2. Machine Gun
- 9.1.3. Automatic launchers
- 9.1.4. Automatic Cannon
- 9.1.5. Gatling Gun
- 9.2. Market Analysis, Insights and Forecast - by Platform
- 9.2.1. Land
- 9.2.2. Airborne
- 9.2.3. Naval
- 9.1. Market Analysis, Insights and Forecast - by Type
- 10. Middle East and Africa Automatic Weapons Industry Analysis, Insights and Forecast, 2019-2031
- 10.1. Market Analysis, Insights and Forecast - by Type
- 10.1.1. Automatic Rifle
- 10.1.2. Machine Gun
- 10.1.3. Automatic launchers
- 10.1.4. Automatic Cannon
- 10.1.5. Gatling Gun
- 10.2. Market Analysis, Insights and Forecast - by Platform
- 10.2.1. Land
- 10.2.2. Airborne
- 10.2.3. Naval
- 10.1. Market Analysis, Insights and Forecast - by Type
- 11. North America Automatic Weapons Industry Analysis, Insights and Forecast, 2019-2031
- 11.1. Market Analysis, Insights and Forecast - By Country/Sub-region
- 11.1.1 United States
- 11.1.2 Canada
- 12. Europe Automatic Weapons Industry Analysis, Insights and Forecast, 2019-2031
- 12.1. Market Analysis, Insights and Forecast - By Country/Sub-region
- 12.1.1 United Kingdom
- 12.1.2 Germany
- 12.1.3 France
- 12.1.4 Russia
- 12.1.5 Rest of Europe
- 13. Asia Pacific Automatic Weapons Industry Analysis, Insights and Forecast, 2019-2031
- 13.1. Market Analysis, Insights and Forecast - By Country/Sub-region
- 13.1.1 China
- 13.1.2 India
- 13.1.3 Japan
- 13.1.4 South Korea
- 13.1.5 Rest of Asia Pacific
- 14. Latin America Automatic Weapons Industry Analysis, Insights and Forecast, 2019-2031
- 14.1. Market Analysis, Insights and Forecast - By Country/Sub-region
- 14.1.1 Brazil
- 14.1.2 Rest of Latin America
- 15. Middle East and Africa Automatic Weapons Industry Analysis, Insights and Forecast, 2019-2031
- 15.1. Market Analysis, Insights and Forecast - By Country/Sub-region
- 15.1.1 United Arab Emirates
- 15.1.2 Saudi Arabia
- 15.1.3 South Africa
- 15.1.4 Rest of Middle East and Africa
- 16. Competitive Analysis
- 16.1. Global Market Share Analysis 2024
- 16.2. Company Profiles
- 16.2.1 Heckler & Koch GmbH
- 16.2.1.1. Overview
- 16.2.1.2. Products
- 16.2.1.3. SWOT Analysis
- 16.2.1.4. Recent Developments
- 16.2.1.5. Financials (Based on Availability)
- 16.2.2 Denel Land Systems
- 16.2.2.1. Overview
- 16.2.2.2. Products
- 16.2.2.3. SWOT Analysis
- 16.2.2.4. Recent Developments
- 16.2.2.5. Financials (Based on Availability)
- 16.2.3 General Dynamics Corporation
- 16.2.3.1. Overview
- 16.2.3.2. Products
- 16.2.3.3. SWOT Analysis
- 16.2.3.4. Recent Developments
- 16.2.3.5. Financials (Based on Availability)
- 16.2.4 Rheinmetall AG
- 16.2.4.1. Overview
- 16.2.4.2. Products
- 16.2.4.3. SWOT Analysis
- 16.2.4.4. Recent Developments
- 16.2.4.5. Financials (Based on Availability)
- 16.2.5 Colt's Manufacturing Company LLC
- 16.2.5.1. Overview
- 16.2.5.2. Products
- 16.2.5.3. SWOT Analysis
- 16.2.5.4. Recent Developments
- 16.2.5.5. Financials (Based on Availability)
- 16.2.6 UkrOboronProm
- 16.2.6.1. Overview
- 16.2.6.2. Products
- 16.2.6.3. SWOT Analysis
- 16.2.6.4. Recent Developments
- 16.2.6.5. Financials (Based on Availability)
- 16.2.7 Sig Sauer Inc
- 16.2.7.1. Overview
- 16.2.7.2. Products
- 16.2.7.3. SWOT Analysis
- 16.2.7.4. Recent Developments
- 16.2.7.5. Financials (Based on Availability)
- 16.2.8 Israel Weapon Industries (IWI) Ltd
- 16.2.8.1. Overview
- 16.2.8.2. Products
- 16.2.8.3. SWOT Analysis
- 16.2.8.4. Recent Developments
- 16.2.8.5. Financials (Based on Availability)
- 16.2.9 Singapore Technologies Engineering Ltd
- 16.2.9.1. Overview
- 16.2.9.2. Products
- 16.2.9.3. SWOT Analysis
- 16.2.9.4. Recent Developments
- 16.2.9.5. Financials (Based on Availability)
- 16.2.10 BAE Systems plc
- 16.2.10.1. Overview
- 16.2.10.2. Products
- 16.2.10.3. SWOT Analysis
- 16.2.10.4. Recent Developments
- 16.2.10.5. Financials (Based on Availability)
- 16.2.11 Northrop Grumman Corporation
- 16.2.11.1. Overview
- 16.2.11.2. Products
- 16.2.11.3. SWOT Analysis
- 16.2.11.4. Recent Developments
- 16.2.11.5. Financials (Based on Availability)
- 16.2.12 FN HERSTAL (Herstal Group)
- 16.2.12.1. Overview
- 16.2.12.2. Products
- 16.2.12.3. SWOT Analysis
- 16.2.12.4. Recent Developments
- 16.2.12.5. Financials (Based on Availability)
- 16.2.1 Heckler & Koch GmbH
List of Figures
- Figure 1: Global Automatic Weapons Industry Revenue Breakdown (Million, %) by Region 2024 & 2032
- Figure 2: North America Automatic Weapons Industry Revenue (Million), by Country 2024 & 2032
- Figure 3: North America Automatic Weapons Industry Revenue Share (%), by Country 2024 & 2032
- Figure 4: Europe Automatic Weapons Industry Revenue (Million), by Country 2024 & 2032
- Figure 5: Europe Automatic Weapons Industry Revenue Share (%), by Country 2024 & 2032
- Figure 6: Asia Pacific Automatic Weapons Industry Revenue (Million), by Country 2024 & 2032
- Figure 7: Asia Pacific Automatic Weapons Industry Revenue Share (%), by Country 2024 & 2032
- Figure 8: Latin America Automatic Weapons Industry Revenue (Million), by Country 2024 & 2032
- Figure 9: Latin America Automatic Weapons Industry Revenue Share (%), by Country 2024 & 2032
- Figure 10: Middle East and Africa Automatic Weapons Industry Revenue (Million), by Country 2024 & 2032
- Figure 11: Middle East and Africa Automatic Weapons Industry Revenue Share (%), by Country 2024 & 2032
- Figure 12: North America Automatic Weapons Industry Revenue (Million), by Type 2024 & 2032
- Figure 13: North America Automatic Weapons Industry Revenue Share (%), by Type 2024 & 2032
- Figure 14: North America Automatic Weapons Industry Revenue (Million), by Platform 2024 & 2032
- Figure 15: North America Automatic Weapons Industry Revenue Share (%), by Platform 2024 & 2032
- Figure 16: North America Automatic Weapons Industry Revenue (Million), by Country 2024 & 2032
- Figure 17: North America Automatic Weapons Industry Revenue Share (%), by Country 2024 & 2032
- Figure 18: Europe Automatic Weapons Industry Revenue (Million), by Type 2024 & 2032
- Figure 19: Europe Automatic Weapons Industry Revenue Share (%), by Type 2024 & 2032
- Figure 20: Europe Automatic Weapons Industry Revenue (Million), by Platform 2024 & 2032
- Figure 21: Europe Automatic Weapons Industry Revenue Share (%), by Platform 2024 & 2032
- Figure 22: Europe Automatic Weapons Industry Revenue (Million), by Country 2024 & 2032
- Figure 23: Europe Automatic Weapons Industry Revenue Share (%), by Country 2024 & 2032
- Figure 24: Asia Pacific Automatic Weapons Industry Revenue (Million), by Type 2024 & 2032
- Figure 25: Asia Pacific Automatic Weapons Industry Revenue Share (%), by Type 2024 & 2032
- Figure 26: Asia Pacific Automatic Weapons Industry Revenue (Million), by Platform 2024 & 2032
- Figure 27: Asia Pacific Automatic Weapons Industry Revenue Share (%), by Platform 2024 & 2032
- Figure 28: Asia Pacific Automatic Weapons Industry Revenue (Million), by Country 2024 & 2032
- Figure 29: Asia Pacific Automatic Weapons Industry Revenue Share (%), by Country 2024 & 2032
- Figure 30: Latin America Automatic Weapons Industry Revenue (Million), by Type 2024 & 2032
- Figure 31: Latin America Automatic Weapons Industry Revenue Share (%), by Type 2024 & 2032
- Figure 32: Latin America Automatic Weapons Industry Revenue (Million), by Platform 2024 & 2032
- Figure 33: Latin America Automatic Weapons Industry Revenue Share (%), by Platform 2024 & 2032
- Figure 34: Latin America Automatic Weapons Industry Revenue (Million), by Country 2024 & 2032
- Figure 35: Latin America Automatic Weapons Industry Revenue Share (%), by Country 2024 & 2032
- Figure 36: Middle East and Africa Automatic Weapons Industry Revenue (Million), by Type 2024 & 2032
- Figure 37: Middle East and Africa Automatic Weapons Industry Revenue Share (%), by Type 2024 & 2032
- Figure 38: Middle East and Africa Automatic Weapons Industry Revenue (Million), by Platform 2024 & 2032
- Figure 39: Middle East and Africa Automatic Weapons Industry Revenue Share (%), by Platform 2024 & 2032
- Figure 40: Middle East and Africa Automatic Weapons Industry Revenue (Million), by Country 2024 & 2032
- Figure 41: Middle East and Africa Automatic Weapons Industry Revenue Share (%), by Country 2024 & 2032
List of Tables
- Table 1: Global Automatic Weapons Industry Revenue Million Forecast, by Region 2019 & 2032
- Table 2: Global Automatic Weapons Industry Revenue Million Forecast, by Type 2019 & 2032
- Table 3: Global Automatic Weapons Industry Revenue Million Forecast, by Platform 2019 & 2032
- Table 4: Global Automatic Weapons Industry Revenue Million Forecast, by Region 2019 & 2032
- Table 5: Global Automatic Weapons Industry Revenue Million Forecast, by Country 2019 & 2032
- Table 6: United States Automatic Weapons Industry Revenue (Million) Forecast, by Application 2019 & 2032
- Table 7: Canada Automatic Weapons Industry Revenue (Million) Forecast, by Application 2019 & 2032
- Table 8: Global Automatic Weapons Industry Revenue Million Forecast, by Country 2019 & 2032
- Table 9: United Kingdom Automatic Weapons Industry Revenue (Million) Forecast, by Application 2019 & 2032
- Table 10: Germany Automatic Weapons Industry Revenue (Million) Forecast, by Application 2019 & 2032
- Table 11: France Automatic Weapons Industry Revenue (Million) Forecast, by Application 2019 & 2032
- Table 12: Russia Automatic Weapons Industry Revenue (Million) Forecast, by Application 2019 & 2032
- Table 13: Rest of Europe Automatic Weapons Industry Revenue (Million) Forecast, by Application 2019 & 2032
- Table 14: Global Automatic Weapons Industry Revenue Million Forecast, by Country 2019 & 2032
- Table 15: China Automatic Weapons Industry Revenue (Million) Forecast, by Application 2019 & 2032
- Table 16: India Automatic Weapons Industry Revenue (Million) Forecast, by Application 2019 & 2032
- Table 17: Japan Automatic Weapons Industry Revenue (Million) Forecast, by Application 2019 & 2032
- Table 18: South Korea Automatic Weapons Industry Revenue (Million) Forecast, by Application 2019 & 2032
- Table 19: Rest of Asia Pacific Automatic Weapons Industry Revenue (Million) Forecast, by Application 2019 & 2032
- Table 20: Global Automatic Weapons Industry Revenue Million Forecast, by Country 2019 & 2032
- Table 21: Brazil Automatic Weapons Industry Revenue (Million) Forecast, by Application 2019 & 2032
- Table 22: Rest of Latin America Automatic Weapons Industry Revenue (Million) Forecast, by Application 2019 & 2032
- Table 23: Global Automatic Weapons Industry Revenue Million Forecast, by Country 2019 & 2032
- Table 24: United Arab Emirates Automatic Weapons Industry Revenue (Million) Forecast, by Application 2019 & 2032
- Table 25: Saudi Arabia Automatic Weapons Industry Revenue (Million) Forecast, by Application 2019 & 2032
- Table 26: South Africa Automatic Weapons Industry Revenue (Million) Forecast, by Application 2019 & 2032
- Table 27: Rest of Middle East and Africa Automatic Weapons Industry Revenue (Million) Forecast, by Application 2019 & 2032
- Table 28: Global Automatic Weapons Industry Revenue Million Forecast, by Type 2019 & 2032
- Table 29: Global Automatic Weapons Industry Revenue Million Forecast, by Platform 2019 & 2032
- Table 30: Global Automatic Weapons Industry Revenue Million Forecast, by Country 2019 & 2032
- Table 31: United States Automatic Weapons Industry Revenue (Million) Forecast, by Application 2019 & 2032
- Table 32: Canada Automatic Weapons Industry Revenue (Million) Forecast, by Application 2019 & 2032
- Table 33: Global Automatic Weapons Industry Revenue Million Forecast, by Type 2019 & 2032
- Table 34: Global Automatic Weapons Industry Revenue Million Forecast, by Platform 2019 & 2032
- Table 35: Global Automatic Weapons Industry Revenue Million Forecast, by Country 2019 & 2032
- Table 36: United Kingdom Automatic Weapons Industry Revenue (Million) Forecast, by Application 2019 & 2032
- Table 37: Germany Automatic Weapons Industry Revenue (Million) Forecast, by Application 2019 & 2032
- Table 38: France Automatic Weapons Industry Revenue (Million) Forecast, by Application 2019 & 2032
- Table 39: Russia Automatic Weapons Industry Revenue (Million) Forecast, by Application 2019 & 2032
- Table 40: Rest of Europe Automatic Weapons Industry Revenue (Million) Forecast, by Application 2019 & 2032
- Table 41: Global Automatic Weapons Industry Revenue Million Forecast, by Type 2019 & 2032
- Table 42: Global Automatic Weapons Industry Revenue Million Forecast, by Platform 2019 & 2032
- Table 43: Global Automatic Weapons Industry Revenue Million Forecast, by Country 2019 & 2032
- Table 44: China Automatic Weapons Industry Revenue (Million) Forecast, by Application 2019 & 2032
- Table 45: India Automatic Weapons Industry Revenue (Million) Forecast, by Application 2019 & 2032
- Table 46: Japan Automatic Weapons Industry Revenue (Million) Forecast, by Application 2019 & 2032
- Table 47: South Korea Automatic Weapons Industry Revenue (Million) Forecast, by Application 2019 & 2032
- Table 48: Rest of Asia Pacific Automatic Weapons Industry Revenue (Million) Forecast, by Application 2019 & 2032
- Table 49: Global Automatic Weapons Industry Revenue Million Forecast, by Type 2019 & 2032
- Table 50: Global Automatic Weapons Industry Revenue Million Forecast, by Platform 2019 & 2032
- Table 51: Global Automatic Weapons Industry Revenue Million Forecast, by Country 2019 & 2032
- Table 52: Brazil Automatic Weapons Industry Revenue (Million) Forecast, by Application 2019 & 2032
- Table 53: Rest of Latin America Automatic Weapons Industry Revenue (Million) Forecast, by Application 2019 & 2032
- Table 54: Global Automatic Weapons Industry Revenue Million Forecast, by Type 2019 & 2032
- Table 55: Global Automatic Weapons Industry Revenue Million Forecast, by Platform 2019 & 2032
- Table 56: Global Automatic Weapons Industry Revenue Million Forecast, by Country 2019 & 2032
- Table 57: United Arab Emirates Automatic Weapons Industry Revenue (Million) Forecast, by Application 2019 & 2032
- Table 58: Saudi Arabia Automatic Weapons Industry Revenue (Million) Forecast, by Application 2019 & 2032
- Table 59: South Africa Automatic Weapons Industry Revenue (Million) Forecast, by Application 2019 & 2032
- Table 60: Rest of Middle East and Africa Automatic Weapons Industry Revenue (Million) Forecast, by Application 2019 & 2032
Frequently Asked Questions
1. What is the projected Compound Annual Growth Rate (CAGR) of the Automatic Weapons Industry?
The projected CAGR is approximately 7.50%.
2. Which companies are prominent players in the Automatic Weapons Industry?
Key companies in the market include Heckler & Koch GmbH, Denel Land Systems, General Dynamics Corporation, Rheinmetall AG, Colt's Manufacturing Company LLC, UkrOboronProm, Sig Sauer Inc, Israel Weapon Industries (IWI) Ltd, Singapore Technologies Engineering Ltd, BAE Systems plc, Northrop Grumman Corporation, FN HERSTAL (Herstal Group).
3. What are the main segments of the Automatic Weapons Industry?
The market segments include Type, Platform.
4. Can you provide details about the market size?
The market size is estimated to be USD 9.47 Million as of 2022.
5. What are some drivers contributing to market growth?
N/A
6. What are the notable trends driving market growth?
Land Segment to Witness Highest Growth During the Forecast Period.
7. Are there any restraints impacting market growth?
N/A
8. Can you provide examples of recent developments in the market?
March 2023: the Estonian Defense Investment Centre awarded an order to Israel's IWI for the supply of 1,000 NG7 "Negev" light machine weapon systems to the Estonian Army. The "Negevv" machine guns, which are expected to be delivered towards the end of 2023, will take over from MG3 and KSP-58 machines that are already in use. NEGEV 7.62 LMG is a NATO 7.62x51mm Light machine gun, which is used by many countries worldwide.
9. What pricing options are available for accessing the report?
Pricing options include single-user, multi-user, and enterprise licenses priced at USD 4750, USD 5250, and USD 8750 respectively.
10. Is the market size provided in terms of value or volume?
The market size is provided in terms of value, measured in Million.
11. Are there any specific market keywords associated with the report?
Yes, the market keyword associated with the report is "Automatic Weapons Industry," which aids in identifying and referencing the specific market segment covered.
12. How do I determine which pricing option suits my needs best?
The pricing options vary based on user requirements and access needs. Individual users may opt for single-user licenses, while businesses requiring broader access may choose multi-user or enterprise licenses for cost-effective access to the report.
13. Are there any additional resources or data provided in the Automatic Weapons Industry report?
While the report offers comprehensive insights, it's advisable to review the specific contents or supplementary materials provided to ascertain if additional resources or data are available.
14. How can I stay updated on further developments or reports in the Automatic Weapons Industry?
To stay informed about further developments, trends, and reports in the Automatic Weapons Industry, consider subscribing to industry newsletters, following relevant companies and organizations, or regularly checking reputable industry news sources and publications.
Methodology
Step 1 - Identification of Relevant Samples Size from Population Database


Step 2 - Approaches for Defining Global Market Size (Value, Volume* & Price*)

Note*: In applicable scenarios
Step 3 - Data Sources
Primary Research
- Web Analytics
- Survey Reports
- Research Institute
- Latest Research Reports
- Opinion Leaders
Secondary Research
- Annual Reports
- White Paper
- Latest Press Release
- Industry Association
- Paid Database
- Investor Presentations

Step 4 - Data Triangulation
Involves using different sources of information in order to increase the validity of a study
These sources are likely to be stakeholders in a program - participants, other researchers, program staff, other community members, and so on.
Then we put all data in single framework & apply various statistical tools to find out the dynamic on the market.
During the analysis stage, feedback from the stakeholder groups would be compared to determine areas of agreement as well as areas of divergence


