
Key Insights
The global beverages market, valued at approximately $1.5 trillion in 2025, is projected to experience robust growth, driven by several key factors. Rising disposable incomes, particularly in developing economies, are fueling increased consumer spending on beverages, especially premium and functional drinks. Health and wellness trends are significantly impacting the market, with a surge in demand for healthier alternatives such as functional waters, low-sugar sodas, and plant-based beverages. The growing popularity of e-commerce and online grocery delivery services is also expanding distribution channels and driving accessibility for consumers. Furthermore, innovative product development and diversification, including the introduction of unique flavors, convenient packaging formats, and personalized beverage options, contribute to market dynamism. Competition remains fierce among established players like Anheuser-Busch InBev, Nestlé, PepsiCo, and Coca-Cola, prompting intense innovation and marketing efforts to capture market share.
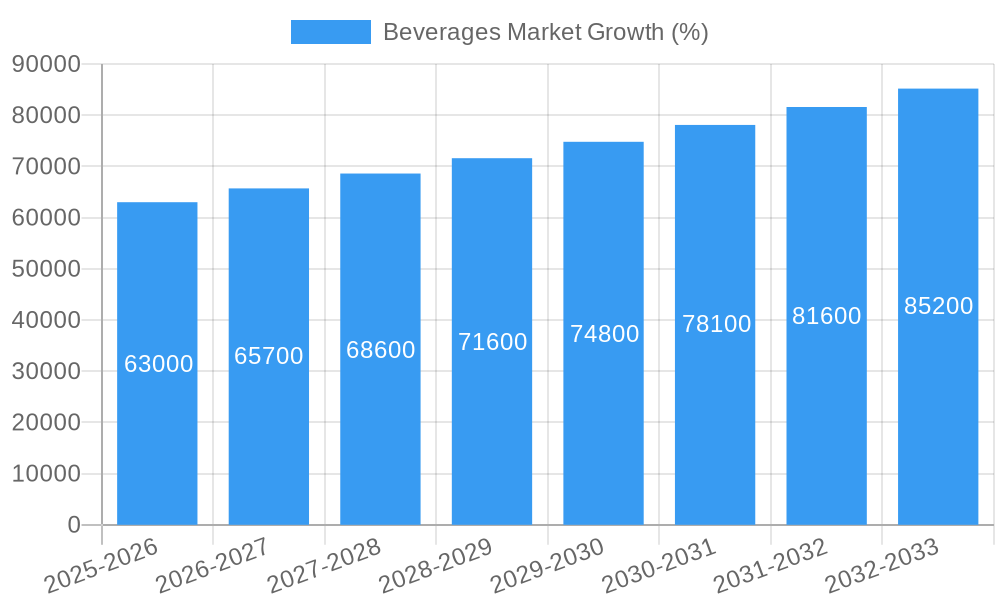
However, the market faces certain challenges. Fluctuating raw material prices, particularly for agricultural products used in beverage production, can impact profitability. Stricter regulations concerning sugar content and health labeling are prompting manufacturers to reformulate their products, which can be costly. Moreover, increasing consumer awareness of environmental concerns related to packaging and water usage puts pressure on companies to adopt sustainable practices. Despite these challenges, the long-term outlook for the beverages market remains positive, with consistent growth expected throughout the forecast period (2025-2033) fueled by evolving consumer preferences and the ongoing expansion of emerging markets. The continued expansion of the non-alcoholic beverage segment, driven by health-conscious choices and innovative product development, is a key factor in shaping market dynamics. Segmentation by distribution channel (on-trade versus off-trade) reveals further intricacies of market growth patterns.
Beverages Market: A Comprehensive Report (2019-2033)
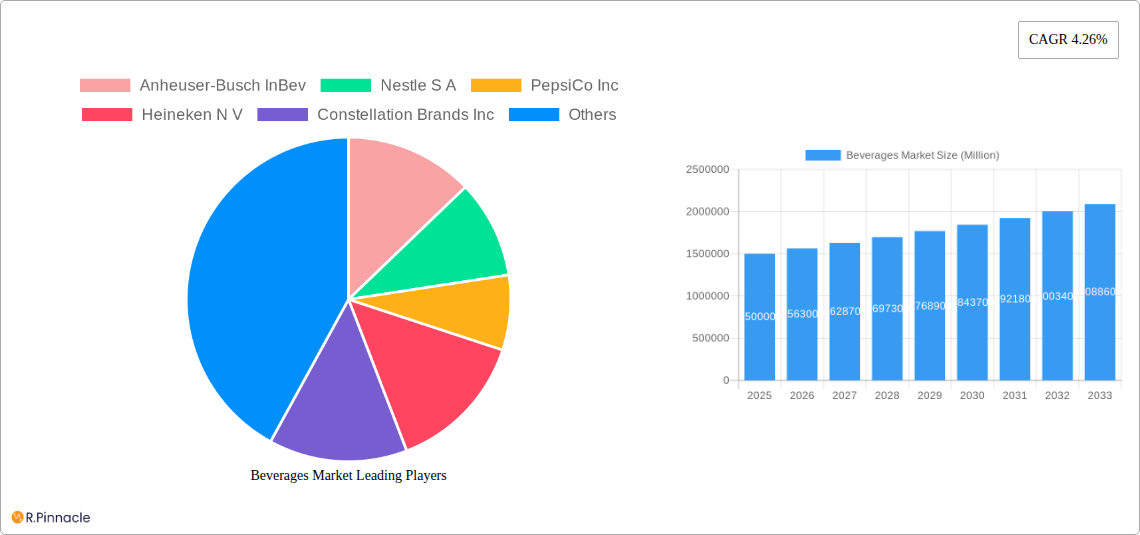
This comprehensive report provides an in-depth analysis of the global Beverages Market, offering valuable insights for industry professionals, investors, and strategic decision-makers. With a study period spanning 2019-2033, a base year of 2025, and a forecast period of 2025-2033, this report delivers actionable intelligence on market trends, competitive dynamics, and future growth potential. The report covers a market valued at xx Million in 2025, projected to reach xx Million by 2033, showcasing a robust CAGR of xx%.
Beverages Market Structure & Innovation Trends
This section analyzes the market structure, highlighting key players and their market share, alongside the innovative forces shaping the industry. The competitive landscape is dominated by major players such as Anheuser-Busch InBev, Nestlé S.A., PepsiCo Inc., Heineken N.V., Constellation Brands Inc., Suntory Holdings Limited, Red Bull GmbH, Keurig Dr Pepper, The Coca-Cola Company, and Diageo plc. However, the market also accommodates numerous smaller players and emerging brands.
Market Concentration: The market demonstrates a moderately concentrated structure, with a few dominant players commanding significant market share. Anheuser-Busch InBev and The Coca-Cola Company are amongst the leading players, each holding an estimated xx% market share in 2025.
Innovation Drivers: Consumer demand for healthier options, functional beverages, and personalized experiences is a key driver of innovation. This includes the rise of low/no-alcohol beverages, plant-based alternatives, and personalized nutrition drinks.
Regulatory Frameworks: Government regulations concerning alcohol content, labeling, and marketing significantly influence market dynamics. Changes in excise duties and health regulations can directly impact profitability and product development strategies.
Product Substitutes: The market faces competition from substitutes like water, juices, and other non-alcoholic drinks, impacting overall market growth and share for specific beverage categories.
End-User Demographics: The market caters to a diverse demographic, with varying consumption patterns based on age, lifestyle, and cultural factors. Understanding these trends is crucial for targeted product development and marketing strategies.
M&A Activities: The beverages sector has witnessed significant M&A activity in recent years, with deal values totaling xx Million in 2024. Consolidation among players has intensified competition and redefined market structures.
Beverages Market Dynamics & Trends
This section delves into the dynamic forces shaping the beverages market, encompassing growth drivers, disruptive technologies, shifting consumer preferences, and intensifying competitive dynamics. The market is driven by several key factors including changing lifestyles, increasing disposable incomes, and rising demand for convenience.
Technological advancements such as improved packaging technologies and efficient distribution networks are further boosting the growth. The increasing popularity of health-conscious beverages such as functional drinks and organic options is also a significant driver of growth. Competitive dynamics are characterized by intense competition among both established players and emerging brands, leading to innovative product launches, aggressive marketing campaigns, and strategic partnerships. The market continues to experience shifts in consumer preferences, with growing demand for healthier, more sustainable, and ethically sourced beverages. These factors collectively contribute to the market's projected growth of xx% CAGR during the forecast period.
Dominant Regions & Segments in Beverages Market
This section identifies the leading regions and segments within the beverages market based on product type (alcoholic and non-alcoholic beverages, including spirits) and distribution channel (on-trade and off-trade).
By Product Type: The non-alcoholic beverage segment holds a larger market share in 2025, driven by the growing health consciousness among consumers and the rising popularity of functional beverages. The alcoholic beverages segment, while smaller, demonstrates strong growth potential due to evolving consumer preferences and increasing premiumization within specific sub-categories. The spirits segment is experiencing significant growth due to increased demand for premium and craft spirits.
By Distribution Channel: The off-trade channel currently dominates, reflecting the convenience of purchasing beverages through supermarkets, convenience stores, and online retailers. The on-trade channel, while smaller, maintains relevance due to the social experience associated with consuming beverages in bars and restaurants.
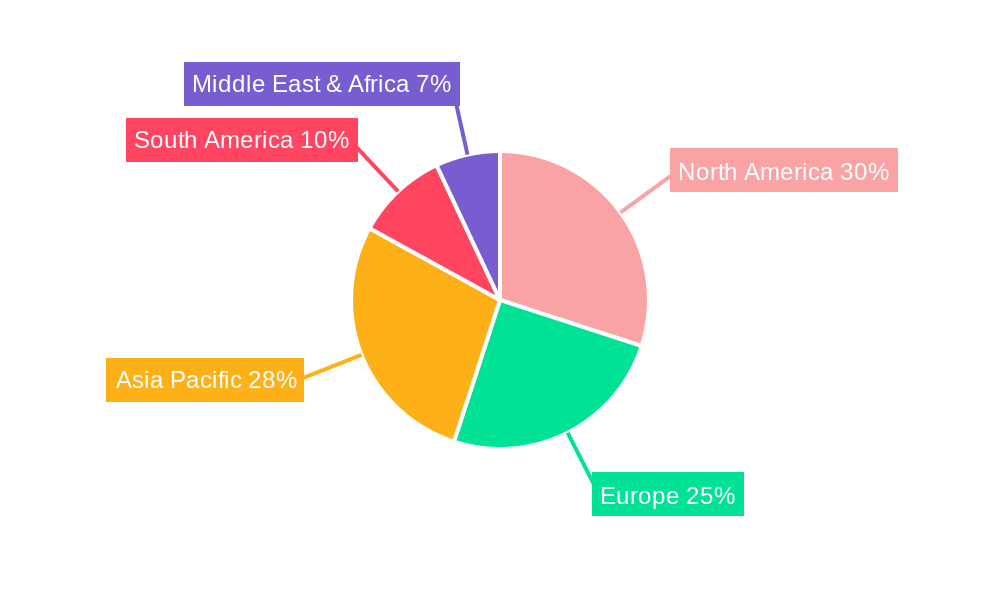
Dominant Regions: [Insert analysis of dominant regions, citing specific countries and detailing factors such as economic policies, infrastructure, cultural preferences, and regulatory environments that contribute to their dominance. Include relevant metrics and quantifiable data to support claims.]
Beverages Market Product Innovations
Recent innovations in the beverages market include the introduction of functional beverages, incorporating health benefits and natural ingredients. Technological advancements in brewing and packaging techniques also lead to improved product quality, longer shelf life, and enhanced consumer experience. The market is witnessing a shift towards sustainable packaging solutions, reflecting growing consumer environmental consciousness. The introduction of innovative flavors and unique product formats contributes to a competitive landscape constantly evolving to meet changing consumer needs.
Report Scope & Segmentation Analysis
This report segments the beverages market by product type (alcoholic beverages, spirits, non-alcoholic beverages) and distribution channel (on-trade, off-trade). Each segment is analyzed in detail, providing insights into market size, growth projections, and competitive dynamics. The alcoholic beverage segment is further segmented into beer, wine, and spirits, with individual market sizing and forecast for each subcategory. Similarly, the non-alcoholic segment is categorized into carbonated soft drinks, juices, bottled water, and others, each with individual growth projections and analysis. The on-trade and off-trade channels are also analyzed separately, detailing their respective market sizes, growth forecasts, and key players.
Key Drivers of Beverages Market Growth
Key drivers of growth in the beverages market include rising disposable incomes, changing lifestyles, increased urbanization, and growing demand for convenience. Technological advancements in production and packaging, as well as innovative product development, are also contributing to growth. Favorable government policies and the rising popularity of health and wellness-focused beverages further fuel market expansion.
Challenges in the Beverages Market Sector
The beverages market faces challenges including intense competition, fluctuating raw material prices, and stringent regulatory requirements. Supply chain disruptions and concerns about sustainability can impact production and profitability. Changing consumer preferences and the emergence of new product substitutes also present ongoing challenges for market players.
Emerging Opportunities in Beverages Market
Emerging opportunities in the beverages market include the growing demand for functional beverages, personalized nutrition drinks, and sustainably sourced products. Expanding into new and emerging markets, particularly in developing countries, presents significant growth potential. Innovations in packaging technology and the adoption of direct-to-consumer models also offer new market opportunities.
Leading Players in the Beverages Market Market
- Anheuser-Busch InBev [Anheuser-Busch InBev]
- Nestlé S.A. [Nestlé S.A.]
- PepsiCo Inc. [PepsiCo Inc.]
- Heineken N.V. [Heineken N.V.]
- Constellation Brands Inc. [Constellation Brands Inc.]
- Suntory Holdings Limited [Suntory Holdings Limited]
- Red Bull GmbH [Red Bull GmbH]
- Keurig Dr Pepper
- The Coca-Cola Company [The Coca-Cola Company]
- Diageo plc [Diageo plc]
Key Developments in Beverages Market Industry
- October 2022: Budweiser APAC opened a state-of-the-art brewery in Putian, China, expanding its footprint in the Asia-Pacific region.
- October 2022: VictoriaTM introduced Vicky Chamoy, a unique beer with a Mexican twist, tapping into emerging flavor trends.
- March 2023: Red Bull launched its Juneberry Summer Edition product line in the UK, showcasing product innovation and seasonal offerings.
Future Outlook for Beverages Market Market
The future of the beverages market is bright, driven by sustained consumer demand, continuous innovation, and expansion into new markets. Growth will be fueled by the increasing preference for premium and healthier options, alongside sustainable packaging solutions. Companies focusing on product differentiation, targeted marketing, and strategic partnerships will be well-positioned to capitalize on future growth opportunities.
Beverages Market Segmentation
-
1. Product Type
-
1.1. Alcoholic Beverages
- 1.1.1. Beer
- 1.1.2. Wine
- 1.1.3. Spirits
-
1.2. Non-Alcoholic Beverages
- 1.2.1. Energy & Sports Drink
- 1.2.2. Soft Drinks
- 1.2.3. Bottled Water
- 1.2.4. Packaged Juice
- 1.2.5. RTD Tea and Coffee
- 1.2.6. Other Non-Alcoholic Beverages
-
1.1. Alcoholic Beverages
-
2. Distribution Channel
- 2.1. On-trade
-
2.2. Off-trade
- 2.2.1. Supermarkets/Hypermarkets
- 2.2.2. Convenience/Grocery Stores
- 2.2.3. Online Retail Stores
- 2.2.4. Other Off Trade Channels
Beverages Market Segmentation By Geography
-
1. North America
- 1.1. United States
- 1.2. Canada
- 1.3. Mexico
- 1.4. Rest of North America
-
2. Europe
- 2.1. United Kingdom
- 2.2. Germany
- 2.3. Spain
- 2.4. France
- 2.5. Italy
- 2.6. Russia
- 2.7. Rest of Europe
-
3. Asia Pacific
- 3.1. China
- 3.2. Japan
- 3.3. India
- 3.4. Australia
- 3.5. Rest of Asia Pacific
-
4. South America
- 4.1. Brazil
- 4.2. Argentina
- 4.3. Rest of South America
- 5. Middle East
-
6. Saudi Arabia
- 6.1. South Africa
- 6.2. Rest of Middle East
Beverages Market REPORT HIGHLIGHTS
| Aspects | Details |
|---|---|
| Study Period | 2019-2033 |
| Base Year | 2024 |
| Estimated Year | 2025 |
| Forecast Period | 2025-2033 |
| Historical Period | 2019-2024 |
| Growth Rate | CAGR of 4.26% from 2019-2033 |
| Segmentation |
|
Table of Contents
- 1. Introduction
- 1.1. Research Scope
- 1.2. Market Segmentation
- 1.3. Research Methodology
- 1.4. Definitions and Assumptions
- 2. Executive Summary
- 2.1. Introduction
- 3. Market Dynamics
- 3.1. Introduction
- 3.2. Market Drivers
- 3.2.1. Preference for Plant-based and Clean-label RTD Products; Consumer Inclination Toward Sugar-Free Drinks
- 3.3. Market Restrains
- 3.3.1. Concerns Over Health Issues Associated With Beverages
- 3.4. Market Trends
- 3.4.1. Consumer Inclination Toward Sugar-Free Drinks
- 4. Market Factor Analysis
- 4.1. Porters Five Forces
- 4.2. Supply/Value Chain
- 4.3. PESTEL analysis
- 4.4. Market Entropy
- 4.5. Patent/Trademark Analysis
- 5. Global Beverages Market Analysis, Insights and Forecast, 2019-2031
- 5.1. Market Analysis, Insights and Forecast - by Product Type
- 5.1.1. Alcoholic Beverages
- 5.1.1.1. Beer
- 5.1.1.2. Wine
- 5.1.1.3. Spirits
- 5.1.2. Non-Alcoholic Beverages
- 5.1.2.1. Energy & Sports Drink
- 5.1.2.2. Soft Drinks
- 5.1.2.3. Bottled Water
- 5.1.2.4. Packaged Juice
- 5.1.2.5. RTD Tea and Coffee
- 5.1.2.6. Other Non-Alcoholic Beverages
- 5.1.1. Alcoholic Beverages
- 5.2. Market Analysis, Insights and Forecast - by Distribution Channel
- 5.2.1. On-trade
- 5.2.2. Off-trade
- 5.2.2.1. Supermarkets/Hypermarkets
- 5.2.2.2. Convenience/Grocery Stores
- 5.2.2.3. Online Retail Stores
- 5.2.2.4. Other Off Trade Channels
- 5.3. Market Analysis, Insights and Forecast - by Region
- 5.3.1. North America
- 5.3.2. Europe
- 5.3.3. Asia Pacific
- 5.3.4. South America
- 5.3.5. Middle East
- 5.3.6. Saudi Arabia
- 5.1. Market Analysis, Insights and Forecast - by Product Type
- 6. North America Beverages Market Analysis, Insights and Forecast, 2019-2031
- 6.1. Market Analysis, Insights and Forecast - by Product Type
- 6.1.1. Alcoholic Beverages
- 6.1.1.1. Beer
- 6.1.1.2. Wine
- 6.1.1.3. Spirits
- 6.1.2. Non-Alcoholic Beverages
- 6.1.2.1. Energy & Sports Drink
- 6.1.2.2. Soft Drinks
- 6.1.2.3. Bottled Water
- 6.1.2.4. Packaged Juice
- 6.1.2.5. RTD Tea and Coffee
- 6.1.2.6. Other Non-Alcoholic Beverages
- 6.1.1. Alcoholic Beverages
- 6.2. Market Analysis, Insights and Forecast - by Distribution Channel
- 6.2.1. On-trade
- 6.2.2. Off-trade
- 6.2.2.1. Supermarkets/Hypermarkets
- 6.2.2.2. Convenience/Grocery Stores
- 6.2.2.3. Online Retail Stores
- 6.2.2.4. Other Off Trade Channels
- 6.1. Market Analysis, Insights and Forecast - by Product Type
- 7. Europe Beverages Market Analysis, Insights and Forecast, 2019-2031
- 7.1. Market Analysis, Insights and Forecast - by Product Type
- 7.1.1. Alcoholic Beverages
- 7.1.1.1. Beer
- 7.1.1.2. Wine
- 7.1.1.3. Spirits
- 7.1.2. Non-Alcoholic Beverages
- 7.1.2.1. Energy & Sports Drink
- 7.1.2.2. Soft Drinks
- 7.1.2.3. Bottled Water
- 7.1.2.4. Packaged Juice
- 7.1.2.5. RTD Tea and Coffee
- 7.1.2.6. Other Non-Alcoholic Beverages
- 7.1.1. Alcoholic Beverages
- 7.2. Market Analysis, Insights and Forecast - by Distribution Channel
- 7.2.1. On-trade
- 7.2.2. Off-trade
- 7.2.2.1. Supermarkets/Hypermarkets
- 7.2.2.2. Convenience/Grocery Stores
- 7.2.2.3. Online Retail Stores
- 7.2.2.4. Other Off Trade Channels
- 7.1. Market Analysis, Insights and Forecast - by Product Type
- 8. Asia Pacific Beverages Market Analysis, Insights and Forecast, 2019-2031
- 8.1. Market Analysis, Insights and Forecast - by Product Type
- 8.1.1. Alcoholic Beverages
- 8.1.1.1. Beer
- 8.1.1.2. Wine
- 8.1.1.3. Spirits
- 8.1.2. Non-Alcoholic Beverages
- 8.1.2.1. Energy & Sports Drink
- 8.1.2.2. Soft Drinks
- 8.1.2.3. Bottled Water
- 8.1.2.4. Packaged Juice
- 8.1.2.5. RTD Tea and Coffee
- 8.1.2.6. Other Non-Alcoholic Beverages
- 8.1.1. Alcoholic Beverages
- 8.2. Market Analysis, Insights and Forecast - by Distribution Channel
- 8.2.1. On-trade
- 8.2.2. Off-trade
- 8.2.2.1. Supermarkets/Hypermarkets
- 8.2.2.2. Convenience/Grocery Stores
- 8.2.2.3. Online Retail Stores
- 8.2.2.4. Other Off Trade Channels
- 8.1. Market Analysis, Insights and Forecast - by Product Type
- 9. South America Beverages Market Analysis, Insights and Forecast, 2019-2031
- 9.1. Market Analysis, Insights and Forecast - by Product Type
- 9.1.1. Alcoholic Beverages
- 9.1.1.1. Beer
- 9.1.1.2. Wine
- 9.1.1.3. Spirits
- 9.1.2. Non-Alcoholic Beverages
- 9.1.2.1. Energy & Sports Drink
- 9.1.2.2. Soft Drinks
- 9.1.2.3. Bottled Water
- 9.1.2.4. Packaged Juice
- 9.1.2.5. RTD Tea and Coffee
- 9.1.2.6. Other Non-Alcoholic Beverages
- 9.1.1. Alcoholic Beverages
- 9.2. Market Analysis, Insights and Forecast - by Distribution Channel
- 9.2.1. On-trade
- 9.2.2. Off-trade
- 9.2.2.1. Supermarkets/Hypermarkets
- 9.2.2.2. Convenience/Grocery Stores
- 9.2.2.3. Online Retail Stores
- 9.2.2.4. Other Off Trade Channels
- 9.1. Market Analysis, Insights and Forecast - by Product Type
- 10. Middle East Beverages Market Analysis, Insights and Forecast, 2019-2031
- 10.1. Market Analysis, Insights and Forecast - by Product Type
- 10.1.1. Alcoholic Beverages
- 10.1.1.1. Beer
- 10.1.1.2. Wine
- 10.1.1.3. Spirits
- 10.1.2. Non-Alcoholic Beverages
- 10.1.2.1. Energy & Sports Drink
- 10.1.2.2. Soft Drinks
- 10.1.2.3. Bottled Water
- 10.1.2.4. Packaged Juice
- 10.1.2.5. RTD Tea and Coffee
- 10.1.2.6. Other Non-Alcoholic Beverages
- 10.1.1. Alcoholic Beverages
- 10.2. Market Analysis, Insights and Forecast - by Distribution Channel
- 10.2.1. On-trade
- 10.2.2. Off-trade
- 10.2.2.1. Supermarkets/Hypermarkets
- 10.2.2.2. Convenience/Grocery Stores
- 10.2.2.3. Online Retail Stores
- 10.2.2.4. Other Off Trade Channels
- 10.1. Market Analysis, Insights and Forecast - by Product Type
- 11. Saudi Arabia Beverages Market Analysis, Insights and Forecast, 2019-2031
- 11.1. Market Analysis, Insights and Forecast - by Product Type
- 11.1.1. Alcoholic Beverages
- 11.1.1.1. Beer
- 11.1.1.2. Wine
- 11.1.1.3. Spirits
- 11.1.2. Non-Alcoholic Beverages
- 11.1.2.1. Energy & Sports Drink
- 11.1.2.2. Soft Drinks
- 11.1.2.3. Bottled Water
- 11.1.2.4. Packaged Juice
- 11.1.2.5. RTD Tea and Coffee
- 11.1.2.6. Other Non-Alcoholic Beverages
- 11.1.1. Alcoholic Beverages
- 11.2. Market Analysis, Insights and Forecast - by Distribution Channel
- 11.2.1. On-trade
- 11.2.2. Off-trade
- 11.2.2.1. Supermarkets/Hypermarkets
- 11.2.2.2. Convenience/Grocery Stores
- 11.2.2.3. Online Retail Stores
- 11.2.2.4. Other Off Trade Channels
- 11.1. Market Analysis, Insights and Forecast - by Product Type
- 12. North America Beverages Market Analysis, Insights and Forecast, 2019-2031
- 12.1. Market Analysis, Insights and Forecast - By Country/Sub-region
- 12.1.1 United States
- 12.1.2 Canada
- 12.1.3 Mexico
- 12.1.4 Rest of North America
- 13. Europe Beverages Market Analysis, Insights and Forecast, 2019-2031
- 13.1. Market Analysis, Insights and Forecast - By Country/Sub-region
- 13.1.1 United Kingdom
- 13.1.2 Germany
- 13.1.3 Spain
- 13.1.4 France
- 13.1.5 Italy
- 13.1.6 Russia
- 13.1.7 Rest of Europe
- 14. Asia Pacific Beverages Market Analysis, Insights and Forecast, 2019-2031
- 14.1. Market Analysis, Insights and Forecast - By Country/Sub-region
- 14.1.1 China
- 14.1.2 Japan
- 14.1.3 India
- 14.1.4 Australia
- 14.1.5 Rest of Asia Pacific
- 15. South America Beverages Market Analysis, Insights and Forecast, 2019-2031
- 15.1. Market Analysis, Insights and Forecast - By Country/Sub-region
- 15.1.1 Brazil
- 15.1.2 Argentina
- 15.1.3 Rest of South America
- 16. Middle East & Africa Beverages Market Analysis, Insights and Forecast, 2019-2031
- 16.1. Market Analysis, Insights and Forecast - By Country/Sub-region
- 16.1.1 UAE
- 16.1.2 South Africa
- 16.1.3 Saudi Arabia
- 16.1.4 Rest of MEA
- 17. Competitive Analysis
- 17.1. Global Market Share Analysis 2024
- 17.2. Company Profiles
- 17.2.1 Anheuser-Busch InBev
- 17.2.1.1. Overview
- 17.2.1.2. Products
- 17.2.1.3. SWOT Analysis
- 17.2.1.4. Recent Developments
- 17.2.1.5. Financials (Based on Availability)
- 17.2.2 Nestle S A
- 17.2.2.1. Overview
- 17.2.2.2. Products
- 17.2.2.3. SWOT Analysis
- 17.2.2.4. Recent Developments
- 17.2.2.5. Financials (Based on Availability)
- 17.2.3 PepsiCo Inc
- 17.2.3.1. Overview
- 17.2.3.2. Products
- 17.2.3.3. SWOT Analysis
- 17.2.3.4. Recent Developments
- 17.2.3.5. Financials (Based on Availability)
- 17.2.4 Heineken N V
- 17.2.4.1. Overview
- 17.2.4.2. Products
- 17.2.4.3. SWOT Analysis
- 17.2.4.4. Recent Developments
- 17.2.4.5. Financials (Based on Availability)
- 17.2.5 Constellation Brands Inc
- 17.2.5.1. Overview
- 17.2.5.2. Products
- 17.2.5.3. SWOT Analysis
- 17.2.5.4. Recent Developments
- 17.2.5.5. Financials (Based on Availability)
- 17.2.6 Suntory Holdings Limited
- 17.2.6.1. Overview
- 17.2.6.2. Products
- 17.2.6.3. SWOT Analysis
- 17.2.6.4. Recent Developments
- 17.2.6.5. Financials (Based on Availability)
- 17.2.7 Red Bull GmbH
- 17.2.7.1. Overview
- 17.2.7.2. Products
- 17.2.7.3. SWOT Analysis
- 17.2.7.4. Recent Developments
- 17.2.7.5. Financials (Based on Availability)
- 17.2.8 Keurig Dr Pepper*List Not Exhaustive
- 17.2.8.1. Overview
- 17.2.8.2. Products
- 17.2.8.3. SWOT Analysis
- 17.2.8.4. Recent Developments
- 17.2.8.5. Financials (Based on Availability)
- 17.2.9 The Coca-Cola Company
- 17.2.9.1. Overview
- 17.2.9.2. Products
- 17.2.9.3. SWOT Analysis
- 17.2.9.4. Recent Developments
- 17.2.9.5. Financials (Based on Availability)
- 17.2.10 Diageo plc
- 17.2.10.1. Overview
- 17.2.10.2. Products
- 17.2.10.3. SWOT Analysis
- 17.2.10.4. Recent Developments
- 17.2.10.5. Financials (Based on Availability)
- 17.2.1 Anheuser-Busch InBev
List of Figures
- Figure 1: Global Beverages Market Revenue Breakdown (Million, %) by Region 2024 & 2032
- Figure 2: North America Beverages Market Revenue (Million), by Country 2024 & 2032
- Figure 3: North America Beverages Market Revenue Share (%), by Country 2024 & 2032
- Figure 4: Europe Beverages Market Revenue (Million), by Country 2024 & 2032
- Figure 5: Europe Beverages Market Revenue Share (%), by Country 2024 & 2032
- Figure 6: Asia Pacific Beverages Market Revenue (Million), by Country 2024 & 2032
- Figure 7: Asia Pacific Beverages Market Revenue Share (%), by Country 2024 & 2032
- Figure 8: South America Beverages Market Revenue (Million), by Country 2024 & 2032
- Figure 9: South America Beverages Market Revenue Share (%), by Country 2024 & 2032
- Figure 10: Middle East & Africa Beverages Market Revenue (Million), by Country 2024 & 2032
- Figure 11: Middle East & Africa Beverages Market Revenue Share (%), by Country 2024 & 2032
- Figure 12: North America Beverages Market Revenue (Million), by Product Type 2024 & 2032
- Figure 13: North America Beverages Market Revenue Share (%), by Product Type 2024 & 2032
- Figure 14: North America Beverages Market Revenue (Million), by Distribution Channel 2024 & 2032
- Figure 15: North America Beverages Market Revenue Share (%), by Distribution Channel 2024 & 2032
- Figure 16: North America Beverages Market Revenue (Million), by Country 2024 & 2032
- Figure 17: North America Beverages Market Revenue Share (%), by Country 2024 & 2032
- Figure 18: Europe Beverages Market Revenue (Million), by Product Type 2024 & 2032
- Figure 19: Europe Beverages Market Revenue Share (%), by Product Type 2024 & 2032
- Figure 20: Europe Beverages Market Revenue (Million), by Distribution Channel 2024 & 2032
- Figure 21: Europe Beverages Market Revenue Share (%), by Distribution Channel 2024 & 2032
- Figure 22: Europe Beverages Market Revenue (Million), by Country 2024 & 2032
- Figure 23: Europe Beverages Market Revenue Share (%), by Country 2024 & 2032
- Figure 24: Asia Pacific Beverages Market Revenue (Million), by Product Type 2024 & 2032
- Figure 25: Asia Pacific Beverages Market Revenue Share (%), by Product Type 2024 & 2032
- Figure 26: Asia Pacific Beverages Market Revenue (Million), by Distribution Channel 2024 & 2032
- Figure 27: Asia Pacific Beverages Market Revenue Share (%), by Distribution Channel 2024 & 2032
- Figure 28: Asia Pacific Beverages Market Revenue (Million), by Country 2024 & 2032
- Figure 29: Asia Pacific Beverages Market Revenue Share (%), by Country 2024 & 2032
- Figure 30: South America Beverages Market Revenue (Million), by Product Type 2024 & 2032
- Figure 31: South America Beverages Market Revenue Share (%), by Product Type 2024 & 2032
- Figure 32: South America Beverages Market Revenue (Million), by Distribution Channel 2024 & 2032
- Figure 33: South America Beverages Market Revenue Share (%), by Distribution Channel 2024 & 2032
- Figure 34: South America Beverages Market Revenue (Million), by Country 2024 & 2032
- Figure 35: South America Beverages Market Revenue Share (%), by Country 2024 & 2032
- Figure 36: Middle East Beverages Market Revenue (Million), by Product Type 2024 & 2032
- Figure 37: Middle East Beverages Market Revenue Share (%), by Product Type 2024 & 2032
- Figure 38: Middle East Beverages Market Revenue (Million), by Distribution Channel 2024 & 2032
- Figure 39: Middle East Beverages Market Revenue Share (%), by Distribution Channel 2024 & 2032
- Figure 40: Middle East Beverages Market Revenue (Million), by Country 2024 & 2032
- Figure 41: Middle East Beverages Market Revenue Share (%), by Country 2024 & 2032
- Figure 42: Saudi Arabia Beverages Market Revenue (Million), by Product Type 2024 & 2032
- Figure 43: Saudi Arabia Beverages Market Revenue Share (%), by Product Type 2024 & 2032
- Figure 44: Saudi Arabia Beverages Market Revenue (Million), by Distribution Channel 2024 & 2032
- Figure 45: Saudi Arabia Beverages Market Revenue Share (%), by Distribution Channel 2024 & 2032
- Figure 46: Saudi Arabia Beverages Market Revenue (Million), by Country 2024 & 2032
- Figure 47: Saudi Arabia Beverages Market Revenue Share (%), by Country 2024 & 2032
List of Tables
- Table 1: Global Beverages Market Revenue Million Forecast, by Region 2019 & 2032
- Table 2: Global Beverages Market Revenue Million Forecast, by Product Type 2019 & 2032
- Table 3: Global Beverages Market Revenue Million Forecast, by Distribution Channel 2019 & 2032
- Table 4: Global Beverages Market Revenue Million Forecast, by Region 2019 & 2032
- Table 5: Global Beverages Market Revenue Million Forecast, by Country 2019 & 2032
- Table 6: United States Beverages Market Revenue (Million) Forecast, by Application 2019 & 2032
- Table 7: Canada Beverages Market Revenue (Million) Forecast, by Application 2019 & 2032
- Table 8: Mexico Beverages Market Revenue (Million) Forecast, by Application 2019 & 2032
- Table 9: Rest of North America Beverages Market Revenue (Million) Forecast, by Application 2019 & 2032
- Table 10: Global Beverages Market Revenue Million Forecast, by Country 2019 & 2032
- Table 11: United Kingdom Beverages Market Revenue (Million) Forecast, by Application 2019 & 2032
- Table 12: Germany Beverages Market Revenue (Million) Forecast, by Application 2019 & 2032
- Table 13: Spain Beverages Market Revenue (Million) Forecast, by Application 2019 & 2032
- Table 14: France Beverages Market Revenue (Million) Forecast, by Application 2019 & 2032
- Table 15: Italy Beverages Market Revenue (Million) Forecast, by Application 2019 & 2032
- Table 16: Russia Beverages Market Revenue (Million) Forecast, by Application 2019 & 2032
- Table 17: Rest of Europe Beverages Market Revenue (Million) Forecast, by Application 2019 & 2032
- Table 18: Global Beverages Market Revenue Million Forecast, by Country 2019 & 2032
- Table 19: China Beverages Market Revenue (Million) Forecast, by Application 2019 & 2032
- Table 20: Japan Beverages Market Revenue (Million) Forecast, by Application 2019 & 2032
- Table 21: India Beverages Market Revenue (Million) Forecast, by Application 2019 & 2032
- Table 22: Australia Beverages Market Revenue (Million) Forecast, by Application 2019 & 2032
- Table 23: Rest of Asia Pacific Beverages Market Revenue (Million) Forecast, by Application 2019 & 2032
- Table 24: Global Beverages Market Revenue Million Forecast, by Country 2019 & 2032
- Table 25: Brazil Beverages Market Revenue (Million) Forecast, by Application 2019 & 2032
- Table 26: Argentina Beverages Market Revenue (Million) Forecast, by Application 2019 & 2032
- Table 27: Rest of South America Beverages Market Revenue (Million) Forecast, by Application 2019 & 2032
- Table 28: Global Beverages Market Revenue Million Forecast, by Country 2019 & 2032
- Table 29: UAE Beverages Market Revenue (Million) Forecast, by Application 2019 & 2032
- Table 30: South Africa Beverages Market Revenue (Million) Forecast, by Application 2019 & 2032
- Table 31: Saudi Arabia Beverages Market Revenue (Million) Forecast, by Application 2019 & 2032
- Table 32: Rest of MEA Beverages Market Revenue (Million) Forecast, by Application 2019 & 2032
- Table 33: Global Beverages Market Revenue Million Forecast, by Product Type 2019 & 2032
- Table 34: Global Beverages Market Revenue Million Forecast, by Distribution Channel 2019 & 2032
- Table 35: Global Beverages Market Revenue Million Forecast, by Country 2019 & 2032
- Table 36: United States Beverages Market Revenue (Million) Forecast, by Application 2019 & 2032
- Table 37: Canada Beverages Market Revenue (Million) Forecast, by Application 2019 & 2032
- Table 38: Mexico Beverages Market Revenue (Million) Forecast, by Application 2019 & 2032
- Table 39: Rest of North America Beverages Market Revenue (Million) Forecast, by Application 2019 & 2032
- Table 40: Global Beverages Market Revenue Million Forecast, by Product Type 2019 & 2032
- Table 41: Global Beverages Market Revenue Million Forecast, by Distribution Channel 2019 & 2032
- Table 42: Global Beverages Market Revenue Million Forecast, by Country 2019 & 2032
- Table 43: United Kingdom Beverages Market Revenue (Million) Forecast, by Application 2019 & 2032
- Table 44: Germany Beverages Market Revenue (Million) Forecast, by Application 2019 & 2032
- Table 45: Spain Beverages Market Revenue (Million) Forecast, by Application 2019 & 2032
- Table 46: France Beverages Market Revenue (Million) Forecast, by Application 2019 & 2032
- Table 47: Italy Beverages Market Revenue (Million) Forecast, by Application 2019 & 2032
- Table 48: Russia Beverages Market Revenue (Million) Forecast, by Application 2019 & 2032
- Table 49: Rest of Europe Beverages Market Revenue (Million) Forecast, by Application 2019 & 2032
- Table 50: Global Beverages Market Revenue Million Forecast, by Product Type 2019 & 2032
- Table 51: Global Beverages Market Revenue Million Forecast, by Distribution Channel 2019 & 2032
- Table 52: Global Beverages Market Revenue Million Forecast, by Country 2019 & 2032
- Table 53: China Beverages Market Revenue (Million) Forecast, by Application 2019 & 2032
- Table 54: Japan Beverages Market Revenue (Million) Forecast, by Application 2019 & 2032
- Table 55: India Beverages Market Revenue (Million) Forecast, by Application 2019 & 2032
- Table 56: Australia Beverages Market Revenue (Million) Forecast, by Application 2019 & 2032
- Table 57: Rest of Asia Pacific Beverages Market Revenue (Million) Forecast, by Application 2019 & 2032
- Table 58: Global Beverages Market Revenue Million Forecast, by Product Type 2019 & 2032
- Table 59: Global Beverages Market Revenue Million Forecast, by Distribution Channel 2019 & 2032
- Table 60: Global Beverages Market Revenue Million Forecast, by Country 2019 & 2032
- Table 61: Brazil Beverages Market Revenue (Million) Forecast, by Application 2019 & 2032
- Table 62: Argentina Beverages Market Revenue (Million) Forecast, by Application 2019 & 2032
- Table 63: Rest of South America Beverages Market Revenue (Million) Forecast, by Application 2019 & 2032
- Table 64: Global Beverages Market Revenue Million Forecast, by Product Type 2019 & 2032
- Table 65: Global Beverages Market Revenue Million Forecast, by Distribution Channel 2019 & 2032
- Table 66: Global Beverages Market Revenue Million Forecast, by Country 2019 & 2032
- Table 67: Global Beverages Market Revenue Million Forecast, by Product Type 2019 & 2032
- Table 68: Global Beverages Market Revenue Million Forecast, by Distribution Channel 2019 & 2032
- Table 69: Global Beverages Market Revenue Million Forecast, by Country 2019 & 2032
- Table 70: South Africa Beverages Market Revenue (Million) Forecast, by Application 2019 & 2032
- Table 71: Rest of Middle East Beverages Market Revenue (Million) Forecast, by Application 2019 & 2032
Frequently Asked Questions
1. What is the projected Compound Annual Growth Rate (CAGR) of the Beverages Market?
The projected CAGR is approximately 4.26%.
2. Which companies are prominent players in the Beverages Market?
Key companies in the market include Anheuser-Busch InBev, Nestle S A, PepsiCo Inc, Heineken N V, Constellation Brands Inc, Suntory Holdings Limited, Red Bull GmbH, Keurig Dr Pepper*List Not Exhaustive, The Coca-Cola Company, Diageo plc.
3. What are the main segments of the Beverages Market?
The market segments include Product Type, Distribution Channel.
4. Can you provide details about the market size?
The market size is estimated to be USD XX Million as of 2022.
5. What are some drivers contributing to market growth?
Preference for Plant-based and Clean-label RTD Products; Consumer Inclination Toward Sugar-Free Drinks.
6. What are the notable trends driving market growth?
Consumer Inclination Toward Sugar-Free Drinks.
7. Are there any restraints impacting market growth?
Concerns Over Health Issues Associated With Beverages.
8. Can you provide examples of recent developments in the market?
March 2023: Red Bull unveiled its Summer Edition product line in the United Kingdom, featuring an exciting new flavor - Juneberry. These Juneberry-flavored energy drinks are now widely accessible, being distributed across major retailers throughout the country. Consumers can enjoy them in both single-serving and multipack options.
9. What pricing options are available for accessing the report?
Pricing options include single-user, multi-user, and enterprise licenses priced at USD 4750, USD 5250, and USD 8750 respectively.
10. Is the market size provided in terms of value or volume?
The market size is provided in terms of value, measured in Million.
11. Are there any specific market keywords associated with the report?
Yes, the market keyword associated with the report is "Beverages Market," which aids in identifying and referencing the specific market segment covered.
12. How do I determine which pricing option suits my needs best?
The pricing options vary based on user requirements and access needs. Individual users may opt for single-user licenses, while businesses requiring broader access may choose multi-user or enterprise licenses for cost-effective access to the report.
13. Are there any additional resources or data provided in the Beverages Market report?
While the report offers comprehensive insights, it's advisable to review the specific contents or supplementary materials provided to ascertain if additional resources or data are available.
14. How can I stay updated on further developments or reports in the Beverages Market?
To stay informed about further developments, trends, and reports in the Beverages Market, consider subscribing to industry newsletters, following relevant companies and organizations, or regularly checking reputable industry news sources and publications.
Methodology
Step 1 - Identification of Relevant Samples Size from Population Database


Step 2 - Approaches for Defining Global Market Size (Value, Volume* & Price*)

Note*: In applicable scenarios
Step 3 - Data Sources
Primary Research
- Web Analytics
- Survey Reports
- Research Institute
- Latest Research Reports
- Opinion Leaders
Secondary Research
- Annual Reports
- White Paper
- Latest Press Release
- Industry Association
- Paid Database
- Investor Presentations

Step 4 - Data Triangulation
Involves using different sources of information in order to increase the validity of a study
These sources are likely to be stakeholders in a program - participants, other researchers, program staff, other community members, and so on.
Then we put all data in single framework & apply various statistical tools to find out the dynamic on the market.
During the analysis stage, feedback from the stakeholder groups would be compared to determine areas of agreement as well as areas of divergence


