
Key Insights
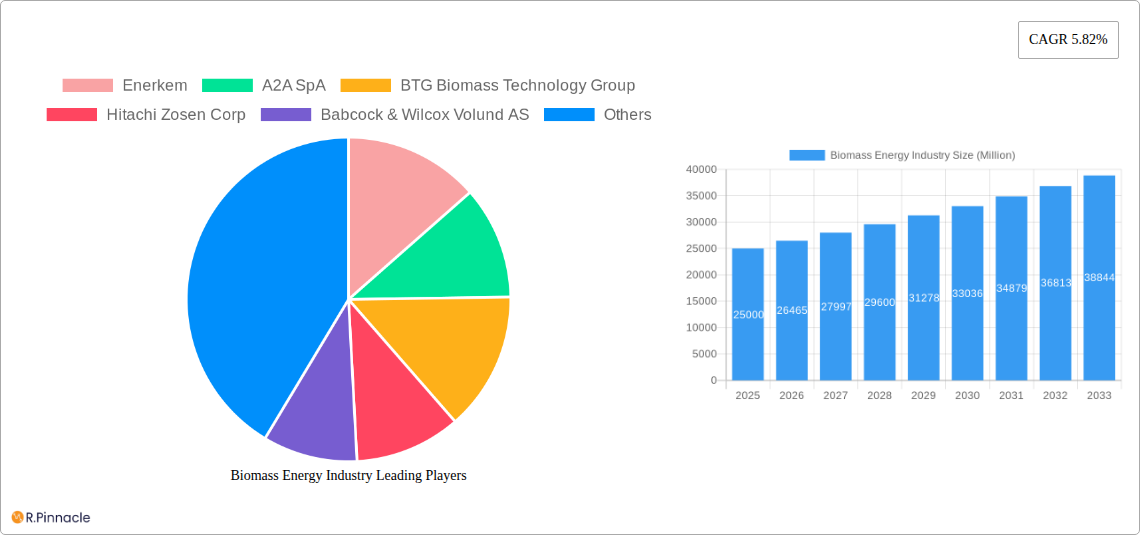
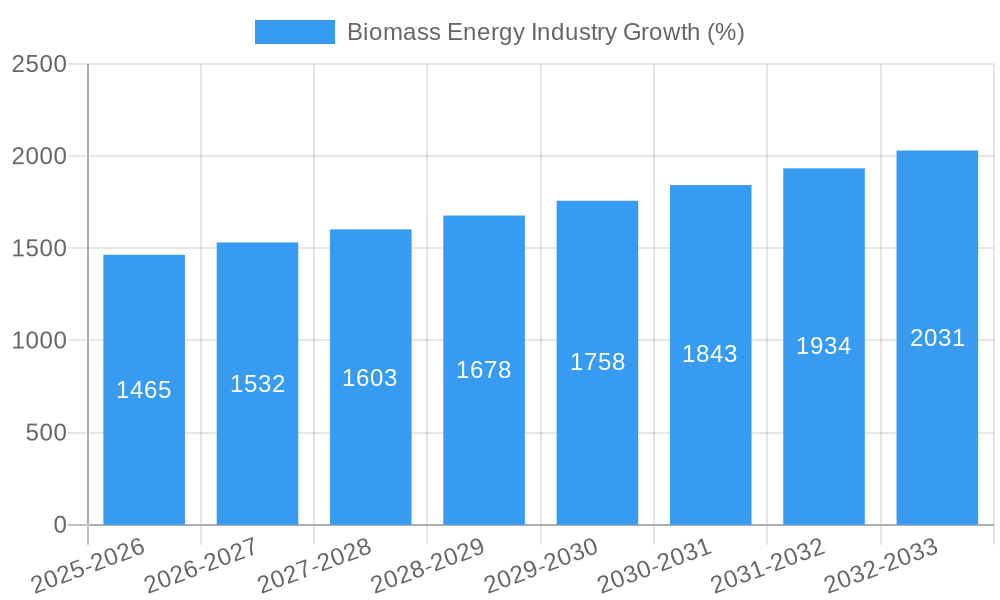
The biomass energy industry is experiencing robust growth, driven by increasing concerns about climate change and the need for sustainable energy sources. A compound annual growth rate (CAGR) of 5.82% from 2019 to 2024 indicates a significant upward trajectory. This growth is fueled by several key factors. Government policies promoting renewable energy, coupled with rising fossil fuel prices, are creating a favorable environment for biomass energy adoption. Technological advancements in gasification, fast pyrolysis, and fermentation are improving efficiency and reducing costs, making biomass energy more competitive. Furthermore, the increasing availability of sustainable biomass feedstocks, including agricultural residues and forestry byproducts, is further bolstering the market's expansion. The industry is segmented by biomass type (solid biomass, biogas, renewable waste, and others) and technology (gasification, fast pyrolysis, fermentation, and others), offering diverse investment and development opportunities. Key players like Enerkem, A2A SpA, and BTG Biomass Technology Group are actively shaping the market landscape through innovation and expansion.
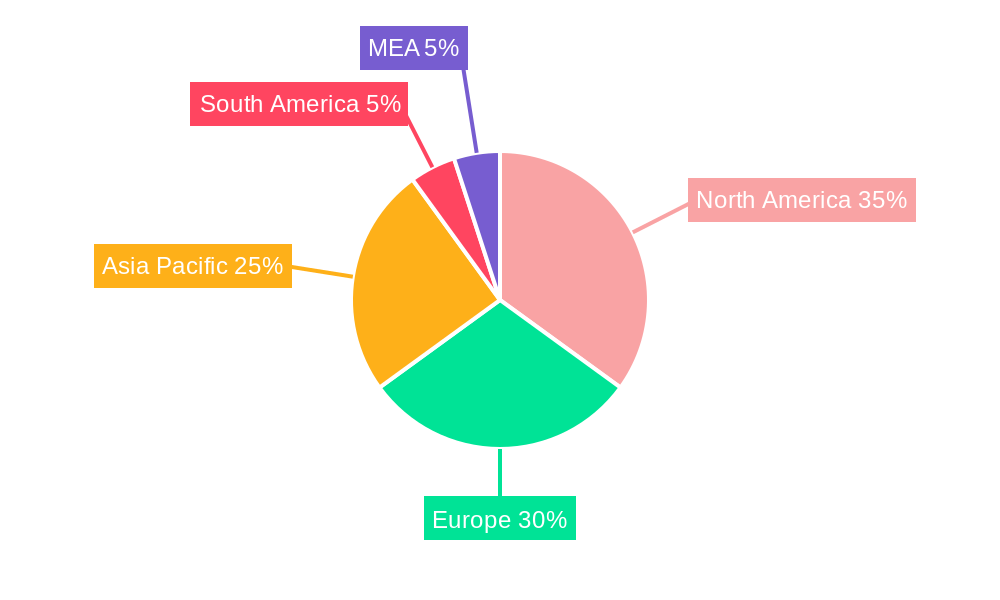
Regional variations in market growth are expected, with North America and Europe anticipated to maintain significant market shares due to established renewable energy policies and robust infrastructure. However, the Asia-Pacific region is poised for substantial growth due to its large population and increasing energy demand, creating a significant potential market for biomass energy solutions. While the industry faces challenges such as feedstock availability and inconsistent policy support in certain regions, the overall outlook remains positive. The long-term forecast, projecting growth through 2033, suggests a substantial and sustained contribution of biomass energy to the global energy mix. The market's continued expansion hinges on addressing challenges related to efficient feedstock logistics, improving technology affordability, and ensuring consistent policy frameworks that support sustainable biomass energy development.
This comprehensive report provides an in-depth analysis of the Biomass Energy Industry, offering crucial insights for industry professionals, investors, and strategists. We examine market dynamics, technological advancements, leading players, and future growth projections for the period 2019-2033, with a base year of 2025 and a forecast period of 2025-2033. The report leverages extensive data from the historical period (2019-2024) to paint a clear picture of the current market landscape and future trends. Expect detailed segmentation analysis by biomass type (Solid Biomass, Biogas, Renewable Waste, Other Types) and technology (Gasification, Fast Pyrolysis, Fermentation, Other Technologies). The global market size is estimated to reach xx Million by 2025.
Biomass Energy Industry Market Structure & Innovation Trends
This section analyzes the market structure, highlighting key players, their market share, and overall market concentration. We delve into the drivers of innovation, including government regulations, technological advancements, and the emergence of substitute products. The analysis includes a review of mergers and acquisitions (M&A) activity within the industry, with specific examples of deal values and their impact on market dynamics.
- Market Concentration: The biomass energy market exhibits a moderately concentrated structure, with a few major players holding significant market share. The top 10 companies control approximately xx% of the global market.
- Innovation Drivers: Stringent environmental regulations, the push for energy independence, and advancements in biofuel conversion technologies are driving innovation within the industry.
- Regulatory Frameworks: Government policies, subsidies, and carbon emission regulations significantly influence market growth and investment decisions.
- Product Substitutes: Competition from traditional fossil fuels and emerging renewable energy sources (e.g., solar and wind) presents a significant challenge.
- End-User Demographics: The primary end-users include power generation companies, industrial facilities, and transportation sectors.
- M&A Activities: The past five years have witnessed significant M&A activity, with deal values totaling approximately xx Million, indicating consolidation and expansion within the industry. Examples include [insert specific example of M&A activity with deal value].
Biomass Energy Industry Market Dynamics & Trends
This section explores the key market dynamics shaping the biomass energy industry, including growth drivers, technological disruptions, consumer preferences, and competitive dynamics. A detailed analysis of market growth (CAGR) and market penetration for different biomass types and technologies is provided. We also examine the impact of global macroeconomic trends and geopolitical factors on market growth.
[Insert 600-word paragraph detailing market growth drivers (e.g., increasing demand for renewable energy, government incentives, technological advancements), technological disruptions (e.g., advancements in gasification and pyrolysis technologies), consumer preferences (e.g., preference for sustainable energy sources), and competitive dynamics (e.g., competition among biomass technology providers, competition from other renewable energy sources). Include specific metrics like CAGR and market penetration.]
Dominant Regions & Segments in Biomass Energy Industry
This section identifies the leading regions and segments within the biomass energy industry. The analysis focuses on market size, growth rate, and key drivers for each segment, including economic policies, infrastructure development, and government support.
Leading Regions: [Insert paragraph analyzing dominant regions, including factors contributing to their dominance e.g., favorable government policies, abundant biomass resources, and established infrastructure.]
Dominant Segments:
- By Type:
- Solid Biomass: [Insert paragraph discussing dominance of Solid Biomass. Include key drivers such as policy support, existing infrastructure, etc.]
- Biogas: [Insert paragraph discussing dominance of Biogas. Include key drivers such as policy support, existing infrastructure, etc.]
- Renewable Waste: [Insert paragraph discussing dominance of Renewable Waste. Include key drivers such as policy support, existing infrastructure, etc.]
- Other Types: [Insert paragraph discussing dominance of Other Types. Include key drivers such as policy support, existing infrastructure, etc.]
- By Technology:
- Gasification: [Insert paragraph discussing dominance of Gasification. Include key drivers such as policy support, existing infrastructure, etc.]
- Fast Pyrolysis: [Insert paragraph discussing dominance of Fast Pyrolysis. Include key drivers such as policy support, existing infrastructure, etc.]
- Fermentation: [Insert paragraph discussing dominance of Fermentation. Include key drivers such as policy support, existing infrastructure, etc.]
- Other Technologies: [Insert paragraph discussing dominance of Other Technologies. Include key drivers such as policy support, existing infrastructure, etc.]
Biomass Energy Industry Product Innovations
This section summarizes recent product developments, applications, and competitive advantages within the biomass energy industry. The analysis focuses on technological trends and the market fit of new products.
[Insert 100-150 word paragraph summarizing product developments, applications, and competitive advantages, emphasizing technological trends and market fit.]
Report Scope & Segmentation Analysis
This report provides a comprehensive analysis of the biomass energy market, segmented by type and technology.
By Type: Solid Biomass, Biogas, Renewable Waste, Other Types. Each segment’s growth projection, market size, and competitive dynamics are analyzed. [Insert brief description of each segment, including growth projections and competitive dynamics, 100-150 words total]
By Technology: Gasification, Fast Pyrolysis, Fermentation, Other Technologies. Growth projections, market sizes, and competitive dynamics are also analyzed for each technology segment. [Insert brief description of each segment, including growth projections and competitive dynamics, 100-150 words total]
Key Drivers of Biomass Energy Industry Growth
Several factors contribute to the growth of the biomass energy industry. These include technological advancements leading to improved efficiency and cost-effectiveness, supportive government policies and incentives promoting renewable energy adoption, and increasing environmental concerns driving the demand for sustainable energy sources. Specific examples include the recent government investment in biorefineries and bioenergy funds in Canada and Australia (detailed in the Key Developments section).
Challenges in the Biomass Energy Industry Sector
Despite significant growth potential, the biomass energy industry faces several challenges. These include the inconsistent supply of biomass feedstock, high initial investment costs for bioenergy infrastructure, and regulatory hurdles related to land use and environmental impact assessments. These factors can impact the overall profitability and scalability of biomass energy projects. Furthermore, competition from other renewable energy sources poses a significant challenge.
Emerging Opportunities in Biomass Energy Industry
The biomass energy industry presents several emerging opportunities. Advancements in biofuel technologies, coupled with growing demand for renewable energy, are creating new markets for biomass-based products. The increasing integration of biomass energy into smart grids and the development of innovative biomass conversion technologies offer significant growth potential. Furthermore, the utilization of agricultural waste and other renewable resources for bioenergy production presents a promising opportunity for sustainable economic development.
Leading Players in the Biomass Energy Industry Market
- Enerkem
- A2A SpA
- BTG Biomass Technology Group
- Hitachi Zosen Corp
- Babcock & Wilcox Volund AS
- Biomass Engineering Ltd
- Fortum Oyj
- Orsted AS
- MVV Energie AG
- Mitsubishi Heavy Industries Ltd
Key Developments in Biomass Energy Industry Industry
- June 2023: Canada's Minister of Natural Resources announced a USD 10 million contribution to BioLesna Carbon Technologies LP, a joint venture between BC Biocarbon and Dunkley Lumber Ltd., for a new biorefinery in Carrot River, Saskatchewan. This development signifies increased government support for the bioenergy sector and its potential to create jobs and stimulate economic growth in rural communities.
- June 2023: Australia's Victorian government announced an USD 8 million bioenergy fund. This substantial investment underscores the growing recognition of bioenergy's role in achieving sustainability goals and diversifying the energy mix. The fund's focus on converting food waste into usable energy highlights the industry's potential for waste reduction and resource efficiency.
Future Outlook for Biomass Energy Industry Market
The biomass energy industry is poised for significant growth over the next decade. Technological advancements, coupled with increasing environmental concerns and supportive government policies, are expected to drive market expansion. Strategic investments in biorefinery development and the exploration of innovative biomass conversion technologies will further enhance the sector's growth trajectory. The industry's capacity to contribute to sustainable energy goals and address waste management challenges presents compelling opportunities for long-term growth and market expansion.
Biomass Energy Industry Segmentation
-
1. Type
- 1.1. Solid Biomass
- 1.2. Biogas
- 1.3. Renewable Waste
- 1.4. Other Types
-
2. Technology
- 2.1. Gasification
- 2.2. Fast Pyrolysis
- 2.3. Fermentation
- 2.4. Other Technologies
Biomass Energy Industry Segmentation By Geography
-
1. North America
- 1.1. United States
- 1.2. Canada
- 1.3. Rest of North America
-
2. Europe
- 2.1. Germany
- 2.2. France
- 2.3. United Kingdom
- 2.4. Italy
- 2.5. Rest of Europe
-
3. Asia Pacific
- 3.1. China
- 3.2. India
- 3.3. Japan
- 3.4. Australia
- 3.5. Rest of Asia Pacific
-
4. South America
- 4.1. Brazil
- 4.2. Argentina
- 4.3. Chile
- 4.4. Rest of South America
-
5. Middle East and Africa
- 5.1. Saudi Arabia
- 5.2. United Arab Emirates
- 5.3. South Africa
- 5.4. Qatar
Biomass Energy Industry REPORT HIGHLIGHTS
| Aspects | Details |
|---|---|
| Study Period | 2019-2033 |
| Base Year | 2024 |
| Estimated Year | 2025 |
| Forecast Period | 2025-2033 |
| Historical Period | 2019-2024 |
| Growth Rate | CAGR of 5.82% from 2019-2033 |
| Segmentation |
|
Table of Contents
- 1. Introduction
- 1.1. Research Scope
- 1.2. Market Segmentation
- 1.3. Research Methodology
- 1.4. Definitions and Assumptions
- 2. Executive Summary
- 2.1. Introduction
- 3. Market Dynamics
- 3.1. Introduction
- 3.2. Market Drivers
- 3.2.1. Shift towards Renewable Energy4.; Less Electricity Generation Cost from Bioenergy
- 3.3. Market Restrains
- 3.3.1. High Initial Investments
- 3.4. Market Trends
- 3.4.1. Biomass is Expected to Dominate the Market
- 4. Market Factor Analysis
- 4.1. Porters Five Forces
- 4.2. Supply/Value Chain
- 4.3. PESTEL analysis
- 4.4. Market Entropy
- 4.5. Patent/Trademark Analysis
- 5. Global Biomass Energy Industry Analysis, Insights and Forecast, 2019-2031
- 5.1. Market Analysis, Insights and Forecast - by Type
- 5.1.1. Solid Biomass
- 5.1.2. Biogas
- 5.1.3. Renewable Waste
- 5.1.4. Other Types
- 5.2. Market Analysis, Insights and Forecast - by Technology
- 5.2.1. Gasification
- 5.2.2. Fast Pyrolysis
- 5.2.3. Fermentation
- 5.2.4. Other Technologies
- 5.3. Market Analysis, Insights and Forecast - by Region
- 5.3.1. North America
- 5.3.2. Europe
- 5.3.3. Asia Pacific
- 5.3.4. South America
- 5.3.5. Middle East and Africa
- 5.1. Market Analysis, Insights and Forecast - by Type
- 6. North America Biomass Energy Industry Analysis, Insights and Forecast, 2019-2031
- 6.1. Market Analysis, Insights and Forecast - by Type
- 6.1.1. Solid Biomass
- 6.1.2. Biogas
- 6.1.3. Renewable Waste
- 6.1.4. Other Types
- 6.2. Market Analysis, Insights and Forecast - by Technology
- 6.2.1. Gasification
- 6.2.2. Fast Pyrolysis
- 6.2.3. Fermentation
- 6.2.4. Other Technologies
- 6.1. Market Analysis, Insights and Forecast - by Type
- 7. Europe Biomass Energy Industry Analysis, Insights and Forecast, 2019-2031
- 7.1. Market Analysis, Insights and Forecast - by Type
- 7.1.1. Solid Biomass
- 7.1.2. Biogas
- 7.1.3. Renewable Waste
- 7.1.4. Other Types
- 7.2. Market Analysis, Insights and Forecast - by Technology
- 7.2.1. Gasification
- 7.2.2. Fast Pyrolysis
- 7.2.3. Fermentation
- 7.2.4. Other Technologies
- 7.1. Market Analysis, Insights and Forecast - by Type
- 8. Asia Pacific Biomass Energy Industry Analysis, Insights and Forecast, 2019-2031
- 8.1. Market Analysis, Insights and Forecast - by Type
- 8.1.1. Solid Biomass
- 8.1.2. Biogas
- 8.1.3. Renewable Waste
- 8.1.4. Other Types
- 8.2. Market Analysis, Insights and Forecast - by Technology
- 8.2.1. Gasification
- 8.2.2. Fast Pyrolysis
- 8.2.3. Fermentation
- 8.2.4. Other Technologies
- 8.1. Market Analysis, Insights and Forecast - by Type
- 9. South America Biomass Energy Industry Analysis, Insights and Forecast, 2019-2031
- 9.1. Market Analysis, Insights and Forecast - by Type
- 9.1.1. Solid Biomass
- 9.1.2. Biogas
- 9.1.3. Renewable Waste
- 9.1.4. Other Types
- 9.2. Market Analysis, Insights and Forecast - by Technology
- 9.2.1. Gasification
- 9.2.2. Fast Pyrolysis
- 9.2.3. Fermentation
- 9.2.4. Other Technologies
- 9.1. Market Analysis, Insights and Forecast - by Type
- 10. Middle East and Africa Biomass Energy Industry Analysis, Insights and Forecast, 2019-2031
- 10.1. Market Analysis, Insights and Forecast - by Type
- 10.1.1. Solid Biomass
- 10.1.2. Biogas
- 10.1.3. Renewable Waste
- 10.1.4. Other Types
- 10.2. Market Analysis, Insights and Forecast - by Technology
- 10.2.1. Gasification
- 10.2.2. Fast Pyrolysis
- 10.2.3. Fermentation
- 10.2.4. Other Technologies
- 10.1. Market Analysis, Insights and Forecast - by Type
- 11. North America Biomass Energy Industry Analysis, Insights and Forecast, 2019-2031
- 11.1. Market Analysis, Insights and Forecast - By Country/Sub-region
- 11.1.1 United States
- 11.1.2 Canada
- 11.1.3 Mexico
- 12. Europe Biomass Energy Industry Analysis, Insights and Forecast, 2019-2031
- 12.1. Market Analysis, Insights and Forecast - By Country/Sub-region
- 12.1.1 Germany
- 12.1.2 United Kingdom
- 12.1.3 France
- 12.1.4 Spain
- 12.1.5 Italy
- 12.1.6 Spain
- 12.1.7 Belgium
- 12.1.8 Netherland
- 12.1.9 Nordics
- 12.1.10 Rest of Europe
- 13. Asia Pacific Biomass Energy Industry Analysis, Insights and Forecast, 2019-2031
- 13.1. Market Analysis, Insights and Forecast - By Country/Sub-region
- 13.1.1 China
- 13.1.2 Japan
- 13.1.3 India
- 13.1.4 South Korea
- 13.1.5 Southeast Asia
- 13.1.6 Australia
- 13.1.7 Indonesia
- 13.1.8 Phillipes
- 13.1.9 Singapore
- 13.1.10 Thailandc
- 13.1.11 Rest of Asia Pacific
- 14. South America Biomass Energy Industry Analysis, Insights and Forecast, 2019-2031
- 14.1. Market Analysis, Insights and Forecast - By Country/Sub-region
- 14.1.1 Brazil
- 14.1.2 Argentina
- 14.1.3 Peru
- 14.1.4 Chile
- 14.1.5 Colombia
- 14.1.6 Ecuador
- 14.1.7 Venezuela
- 14.1.8 Rest of South America
- 15. MEA Biomass Energy Industry Analysis, Insights and Forecast, 2019-2031
- 15.1. Market Analysis, Insights and Forecast - By Country/Sub-region
- 15.1.1 United Arab Emirates
- 15.1.2 Saudi Arabia
- 15.1.3 South Africa
- 15.1.4 Rest of Middle East and Africa
- 16. Competitive Analysis
- 16.1. Global Market Share Analysis 2024
- 16.2. Company Profiles
- 16.2.1 Enerkem
- 16.2.1.1. Overview
- 16.2.1.2. Products
- 16.2.1.3. SWOT Analysis
- 16.2.1.4. Recent Developments
- 16.2.1.5. Financials (Based on Availability)
- 16.2.2 A2A SpA
- 16.2.2.1. Overview
- 16.2.2.2. Products
- 16.2.2.3. SWOT Analysis
- 16.2.2.4. Recent Developments
- 16.2.2.5. Financials (Based on Availability)
- 16.2.3 BTG Biomass Technology Group
- 16.2.3.1. Overview
- 16.2.3.2. Products
- 16.2.3.3. SWOT Analysis
- 16.2.3.4. Recent Developments
- 16.2.3.5. Financials (Based on Availability)
- 16.2.4 Hitachi Zosen Corp
- 16.2.4.1. Overview
- 16.2.4.2. Products
- 16.2.4.3. SWOT Analysis
- 16.2.4.4. Recent Developments
- 16.2.4.5. Financials (Based on Availability)
- 16.2.5 Babcock & Wilcox Volund AS
- 16.2.5.1. Overview
- 16.2.5.2. Products
- 16.2.5.3. SWOT Analysis
- 16.2.5.4. Recent Developments
- 16.2.5.5. Financials (Based on Availability)
- 16.2.6 Biomass Engineering Ltd
- 16.2.6.1. Overview
- 16.2.6.2. Products
- 16.2.6.3. SWOT Analysis
- 16.2.6.4. Recent Developments
- 16.2.6.5. Financials (Based on Availability)
- 16.2.7 Fortum Oyj
- 16.2.7.1. Overview
- 16.2.7.2. Products
- 16.2.7.3. SWOT Analysis
- 16.2.7.4. Recent Developments
- 16.2.7.5. Financials (Based on Availability)
- 16.2.8 Orsted AS
- 16.2.8.1. Overview
- 16.2.8.2. Products
- 16.2.8.3. SWOT Analysis
- 16.2.8.4. Recent Developments
- 16.2.8.5. Financials (Based on Availability)
- 16.2.9 MVV Energie AG
- 16.2.9.1. Overview
- 16.2.9.2. Products
- 16.2.9.3. SWOT Analysis
- 16.2.9.4. Recent Developments
- 16.2.9.5. Financials (Based on Availability)
- 16.2.10 Mitsubishi Heavy Industries Ltd
- 16.2.10.1. Overview
- 16.2.10.2. Products
- 16.2.10.3. SWOT Analysis
- 16.2.10.4. Recent Developments
- 16.2.10.5. Financials (Based on Availability)
- 16.2.1 Enerkem
List of Figures
- Figure 1: Global Biomass Energy Industry Revenue Breakdown (Million, %) by Region 2024 & 2032
- Figure 2: Global Biomass Energy Industry Volume Breakdown (gigawatt, %) by Region 2024 & 2032
- Figure 3: North America Biomass Energy Industry Revenue (Million), by Country 2024 & 2032
- Figure 4: North America Biomass Energy Industry Volume (gigawatt), by Country 2024 & 2032
- Figure 5: North America Biomass Energy Industry Revenue Share (%), by Country 2024 & 2032
- Figure 6: North America Biomass Energy Industry Volume Share (%), by Country 2024 & 2032
- Figure 7: Europe Biomass Energy Industry Revenue (Million), by Country 2024 & 2032
- Figure 8: Europe Biomass Energy Industry Volume (gigawatt), by Country 2024 & 2032
- Figure 9: Europe Biomass Energy Industry Revenue Share (%), by Country 2024 & 2032
- Figure 10: Europe Biomass Energy Industry Volume Share (%), by Country 2024 & 2032
- Figure 11: Asia Pacific Biomass Energy Industry Revenue (Million), by Country 2024 & 2032
- Figure 12: Asia Pacific Biomass Energy Industry Volume (gigawatt), by Country 2024 & 2032
- Figure 13: Asia Pacific Biomass Energy Industry Revenue Share (%), by Country 2024 & 2032
- Figure 14: Asia Pacific Biomass Energy Industry Volume Share (%), by Country 2024 & 2032
- Figure 15: South America Biomass Energy Industry Revenue (Million), by Country 2024 & 2032
- Figure 16: South America Biomass Energy Industry Volume (gigawatt), by Country 2024 & 2032
- Figure 17: South America Biomass Energy Industry Revenue Share (%), by Country 2024 & 2032
- Figure 18: South America Biomass Energy Industry Volume Share (%), by Country 2024 & 2032
- Figure 19: MEA Biomass Energy Industry Revenue (Million), by Country 2024 & 2032
- Figure 20: MEA Biomass Energy Industry Volume (gigawatt), by Country 2024 & 2032
- Figure 21: MEA Biomass Energy Industry Revenue Share (%), by Country 2024 & 2032
- Figure 22: MEA Biomass Energy Industry Volume Share (%), by Country 2024 & 2032
- Figure 23: North America Biomass Energy Industry Revenue (Million), by Type 2024 & 2032
- Figure 24: North America Biomass Energy Industry Volume (gigawatt), by Type 2024 & 2032
- Figure 25: North America Biomass Energy Industry Revenue Share (%), by Type 2024 & 2032
- Figure 26: North America Biomass Energy Industry Volume Share (%), by Type 2024 & 2032
- Figure 27: North America Biomass Energy Industry Revenue (Million), by Technology 2024 & 2032
- Figure 28: North America Biomass Energy Industry Volume (gigawatt), by Technology 2024 & 2032
- Figure 29: North America Biomass Energy Industry Revenue Share (%), by Technology 2024 & 2032
- Figure 30: North America Biomass Energy Industry Volume Share (%), by Technology 2024 & 2032
- Figure 31: North America Biomass Energy Industry Revenue (Million), by Country 2024 & 2032
- Figure 32: North America Biomass Energy Industry Volume (gigawatt), by Country 2024 & 2032
- Figure 33: North America Biomass Energy Industry Revenue Share (%), by Country 2024 & 2032
- Figure 34: North America Biomass Energy Industry Volume Share (%), by Country 2024 & 2032
- Figure 35: Europe Biomass Energy Industry Revenue (Million), by Type 2024 & 2032
- Figure 36: Europe Biomass Energy Industry Volume (gigawatt), by Type 2024 & 2032
- Figure 37: Europe Biomass Energy Industry Revenue Share (%), by Type 2024 & 2032
- Figure 38: Europe Biomass Energy Industry Volume Share (%), by Type 2024 & 2032
- Figure 39: Europe Biomass Energy Industry Revenue (Million), by Technology 2024 & 2032
- Figure 40: Europe Biomass Energy Industry Volume (gigawatt), by Technology 2024 & 2032
- Figure 41: Europe Biomass Energy Industry Revenue Share (%), by Technology 2024 & 2032
- Figure 42: Europe Biomass Energy Industry Volume Share (%), by Technology 2024 & 2032
- Figure 43: Europe Biomass Energy Industry Revenue (Million), by Country 2024 & 2032
- Figure 44: Europe Biomass Energy Industry Volume (gigawatt), by Country 2024 & 2032
- Figure 45: Europe Biomass Energy Industry Revenue Share (%), by Country 2024 & 2032
- Figure 46: Europe Biomass Energy Industry Volume Share (%), by Country 2024 & 2032
- Figure 47: Asia Pacific Biomass Energy Industry Revenue (Million), by Type 2024 & 2032
- Figure 48: Asia Pacific Biomass Energy Industry Volume (gigawatt), by Type 2024 & 2032
- Figure 49: Asia Pacific Biomass Energy Industry Revenue Share (%), by Type 2024 & 2032
- Figure 50: Asia Pacific Biomass Energy Industry Volume Share (%), by Type 2024 & 2032
- Figure 51: Asia Pacific Biomass Energy Industry Revenue (Million), by Technology 2024 & 2032
- Figure 52: Asia Pacific Biomass Energy Industry Volume (gigawatt), by Technology 2024 & 2032
- Figure 53: Asia Pacific Biomass Energy Industry Revenue Share (%), by Technology 2024 & 2032
- Figure 54: Asia Pacific Biomass Energy Industry Volume Share (%), by Technology 2024 & 2032
- Figure 55: Asia Pacific Biomass Energy Industry Revenue (Million), by Country 2024 & 2032
- Figure 56: Asia Pacific Biomass Energy Industry Volume (gigawatt), by Country 2024 & 2032
- Figure 57: Asia Pacific Biomass Energy Industry Revenue Share (%), by Country 2024 & 2032
- Figure 58: Asia Pacific Biomass Energy Industry Volume Share (%), by Country 2024 & 2032
- Figure 59: South America Biomass Energy Industry Revenue (Million), by Type 2024 & 2032
- Figure 60: South America Biomass Energy Industry Volume (gigawatt), by Type 2024 & 2032
- Figure 61: South America Biomass Energy Industry Revenue Share (%), by Type 2024 & 2032
- Figure 62: South America Biomass Energy Industry Volume Share (%), by Type 2024 & 2032
- Figure 63: South America Biomass Energy Industry Revenue (Million), by Technology 2024 & 2032
- Figure 64: South America Biomass Energy Industry Volume (gigawatt), by Technology 2024 & 2032
- Figure 65: South America Biomass Energy Industry Revenue Share (%), by Technology 2024 & 2032
- Figure 66: South America Biomass Energy Industry Volume Share (%), by Technology 2024 & 2032
- Figure 67: South America Biomass Energy Industry Revenue (Million), by Country 2024 & 2032
- Figure 68: South America Biomass Energy Industry Volume (gigawatt), by Country 2024 & 2032
- Figure 69: South America Biomass Energy Industry Revenue Share (%), by Country 2024 & 2032
- Figure 70: South America Biomass Energy Industry Volume Share (%), by Country 2024 & 2032
- Figure 71: Middle East and Africa Biomass Energy Industry Revenue (Million), by Type 2024 & 2032
- Figure 72: Middle East and Africa Biomass Energy Industry Volume (gigawatt), by Type 2024 & 2032
- Figure 73: Middle East and Africa Biomass Energy Industry Revenue Share (%), by Type 2024 & 2032
- Figure 74: Middle East and Africa Biomass Energy Industry Volume Share (%), by Type 2024 & 2032
- Figure 75: Middle East and Africa Biomass Energy Industry Revenue (Million), by Technology 2024 & 2032
- Figure 76: Middle East and Africa Biomass Energy Industry Volume (gigawatt), by Technology 2024 & 2032
- Figure 77: Middle East and Africa Biomass Energy Industry Revenue Share (%), by Technology 2024 & 2032
- Figure 78: Middle East and Africa Biomass Energy Industry Volume Share (%), by Technology 2024 & 2032
- Figure 79: Middle East and Africa Biomass Energy Industry Revenue (Million), by Country 2024 & 2032
- Figure 80: Middle East and Africa Biomass Energy Industry Volume (gigawatt), by Country 2024 & 2032
- Figure 81: Middle East and Africa Biomass Energy Industry Revenue Share (%), by Country 2024 & 2032
- Figure 82: Middle East and Africa Biomass Energy Industry Volume Share (%), by Country 2024 & 2032
List of Tables
- Table 1: Global Biomass Energy Industry Revenue Million Forecast, by Region 2019 & 2032
- Table 2: Global Biomass Energy Industry Volume gigawatt Forecast, by Region 2019 & 2032
- Table 3: Global Biomass Energy Industry Revenue Million Forecast, by Type 2019 & 2032
- Table 4: Global Biomass Energy Industry Volume gigawatt Forecast, by Type 2019 & 2032
- Table 5: Global Biomass Energy Industry Revenue Million Forecast, by Technology 2019 & 2032
- Table 6: Global Biomass Energy Industry Volume gigawatt Forecast, by Technology 2019 & 2032
- Table 7: Global Biomass Energy Industry Revenue Million Forecast, by Region 2019 & 2032
- Table 8: Global Biomass Energy Industry Volume gigawatt Forecast, by Region 2019 & 2032
- Table 9: Global Biomass Energy Industry Revenue Million Forecast, by Country 2019 & 2032
- Table 10: Global Biomass Energy Industry Volume gigawatt Forecast, by Country 2019 & 2032
- Table 11: United States Biomass Energy Industry Revenue (Million) Forecast, by Application 2019 & 2032
- Table 12: United States Biomass Energy Industry Volume (gigawatt) Forecast, by Application 2019 & 2032
- Table 13: Canada Biomass Energy Industry Revenue (Million) Forecast, by Application 2019 & 2032
- Table 14: Canada Biomass Energy Industry Volume (gigawatt) Forecast, by Application 2019 & 2032
- Table 15: Mexico Biomass Energy Industry Revenue (Million) Forecast, by Application 2019 & 2032
- Table 16: Mexico Biomass Energy Industry Volume (gigawatt) Forecast, by Application 2019 & 2032
- Table 17: Global Biomass Energy Industry Revenue Million Forecast, by Country 2019 & 2032
- Table 18: Global Biomass Energy Industry Volume gigawatt Forecast, by Country 2019 & 2032
- Table 19: Germany Biomass Energy Industry Revenue (Million) Forecast, by Application 2019 & 2032
- Table 20: Germany Biomass Energy Industry Volume (gigawatt) Forecast, by Application 2019 & 2032
- Table 21: United Kingdom Biomass Energy Industry Revenue (Million) Forecast, by Application 2019 & 2032
- Table 22: United Kingdom Biomass Energy Industry Volume (gigawatt) Forecast, by Application 2019 & 2032
- Table 23: France Biomass Energy Industry Revenue (Million) Forecast, by Application 2019 & 2032
- Table 24: France Biomass Energy Industry Volume (gigawatt) Forecast, by Application 2019 & 2032
- Table 25: Spain Biomass Energy Industry Revenue (Million) Forecast, by Application 2019 & 2032
- Table 26: Spain Biomass Energy Industry Volume (gigawatt) Forecast, by Application 2019 & 2032
- Table 27: Italy Biomass Energy Industry Revenue (Million) Forecast, by Application 2019 & 2032
- Table 28: Italy Biomass Energy Industry Volume (gigawatt) Forecast, by Application 2019 & 2032
- Table 29: Spain Biomass Energy Industry Revenue (Million) Forecast, by Application 2019 & 2032
- Table 30: Spain Biomass Energy Industry Volume (gigawatt) Forecast, by Application 2019 & 2032
- Table 31: Belgium Biomass Energy Industry Revenue (Million) Forecast, by Application 2019 & 2032
- Table 32: Belgium Biomass Energy Industry Volume (gigawatt) Forecast, by Application 2019 & 2032
- Table 33: Netherland Biomass Energy Industry Revenue (Million) Forecast, by Application 2019 & 2032
- Table 34: Netherland Biomass Energy Industry Volume (gigawatt) Forecast, by Application 2019 & 2032
- Table 35: Nordics Biomass Energy Industry Revenue (Million) Forecast, by Application 2019 & 2032
- Table 36: Nordics Biomass Energy Industry Volume (gigawatt) Forecast, by Application 2019 & 2032
- Table 37: Rest of Europe Biomass Energy Industry Revenue (Million) Forecast, by Application 2019 & 2032
- Table 38: Rest of Europe Biomass Energy Industry Volume (gigawatt) Forecast, by Application 2019 & 2032
- Table 39: Global Biomass Energy Industry Revenue Million Forecast, by Country 2019 & 2032
- Table 40: Global Biomass Energy Industry Volume gigawatt Forecast, by Country 2019 & 2032
- Table 41: China Biomass Energy Industry Revenue (Million) Forecast, by Application 2019 & 2032
- Table 42: China Biomass Energy Industry Volume (gigawatt) Forecast, by Application 2019 & 2032
- Table 43: Japan Biomass Energy Industry Revenue (Million) Forecast, by Application 2019 & 2032
- Table 44: Japan Biomass Energy Industry Volume (gigawatt) Forecast, by Application 2019 & 2032
- Table 45: India Biomass Energy Industry Revenue (Million) Forecast, by Application 2019 & 2032
- Table 46: India Biomass Energy Industry Volume (gigawatt) Forecast, by Application 2019 & 2032
- Table 47: South Korea Biomass Energy Industry Revenue (Million) Forecast, by Application 2019 & 2032
- Table 48: South Korea Biomass Energy Industry Volume (gigawatt) Forecast, by Application 2019 & 2032
- Table 49: Southeast Asia Biomass Energy Industry Revenue (Million) Forecast, by Application 2019 & 2032
- Table 50: Southeast Asia Biomass Energy Industry Volume (gigawatt) Forecast, by Application 2019 & 2032
- Table 51: Australia Biomass Energy Industry Revenue (Million) Forecast, by Application 2019 & 2032
- Table 52: Australia Biomass Energy Industry Volume (gigawatt) Forecast, by Application 2019 & 2032
- Table 53: Indonesia Biomass Energy Industry Revenue (Million) Forecast, by Application 2019 & 2032
- Table 54: Indonesia Biomass Energy Industry Volume (gigawatt) Forecast, by Application 2019 & 2032
- Table 55: Phillipes Biomass Energy Industry Revenue (Million) Forecast, by Application 2019 & 2032
- Table 56: Phillipes Biomass Energy Industry Volume (gigawatt) Forecast, by Application 2019 & 2032
- Table 57: Singapore Biomass Energy Industry Revenue (Million) Forecast, by Application 2019 & 2032
- Table 58: Singapore Biomass Energy Industry Volume (gigawatt) Forecast, by Application 2019 & 2032
- Table 59: Thailandc Biomass Energy Industry Revenue (Million) Forecast, by Application 2019 & 2032
- Table 60: Thailandc Biomass Energy Industry Volume (gigawatt) Forecast, by Application 2019 & 2032
- Table 61: Rest of Asia Pacific Biomass Energy Industry Revenue (Million) Forecast, by Application 2019 & 2032
- Table 62: Rest of Asia Pacific Biomass Energy Industry Volume (gigawatt) Forecast, by Application 2019 & 2032
- Table 63: Global Biomass Energy Industry Revenue Million Forecast, by Country 2019 & 2032
- Table 64: Global Biomass Energy Industry Volume gigawatt Forecast, by Country 2019 & 2032
- Table 65: Brazil Biomass Energy Industry Revenue (Million) Forecast, by Application 2019 & 2032
- Table 66: Brazil Biomass Energy Industry Volume (gigawatt) Forecast, by Application 2019 & 2032
- Table 67: Argentina Biomass Energy Industry Revenue (Million) Forecast, by Application 2019 & 2032
- Table 68: Argentina Biomass Energy Industry Volume (gigawatt) Forecast, by Application 2019 & 2032
- Table 69: Peru Biomass Energy Industry Revenue (Million) Forecast, by Application 2019 & 2032
- Table 70: Peru Biomass Energy Industry Volume (gigawatt) Forecast, by Application 2019 & 2032
- Table 71: Chile Biomass Energy Industry Revenue (Million) Forecast, by Application 2019 & 2032
- Table 72: Chile Biomass Energy Industry Volume (gigawatt) Forecast, by Application 2019 & 2032
- Table 73: Colombia Biomass Energy Industry Revenue (Million) Forecast, by Application 2019 & 2032
- Table 74: Colombia Biomass Energy Industry Volume (gigawatt) Forecast, by Application 2019 & 2032
- Table 75: Ecuador Biomass Energy Industry Revenue (Million) Forecast, by Application 2019 & 2032
- Table 76: Ecuador Biomass Energy Industry Volume (gigawatt) Forecast, by Application 2019 & 2032
- Table 77: Venezuela Biomass Energy Industry Revenue (Million) Forecast, by Application 2019 & 2032
- Table 78: Venezuela Biomass Energy Industry Volume (gigawatt) Forecast, by Application 2019 & 2032
- Table 79: Rest of South America Biomass Energy Industry Revenue (Million) Forecast, by Application 2019 & 2032
- Table 80: Rest of South America Biomass Energy Industry Volume (gigawatt) Forecast, by Application 2019 & 2032
- Table 81: Global Biomass Energy Industry Revenue Million Forecast, by Country 2019 & 2032
- Table 82: Global Biomass Energy Industry Volume gigawatt Forecast, by Country 2019 & 2032
- Table 83: United Arab Emirates Biomass Energy Industry Revenue (Million) Forecast, by Application 2019 & 2032
- Table 84: United Arab Emirates Biomass Energy Industry Volume (gigawatt) Forecast, by Application 2019 & 2032
- Table 85: Saudi Arabia Biomass Energy Industry Revenue (Million) Forecast, by Application 2019 & 2032
- Table 86: Saudi Arabia Biomass Energy Industry Volume (gigawatt) Forecast, by Application 2019 & 2032
- Table 87: South Africa Biomass Energy Industry Revenue (Million) Forecast, by Application 2019 & 2032
- Table 88: South Africa Biomass Energy Industry Volume (gigawatt) Forecast, by Application 2019 & 2032
- Table 89: Rest of Middle East and Africa Biomass Energy Industry Revenue (Million) Forecast, by Application 2019 & 2032
- Table 90: Rest of Middle East and Africa Biomass Energy Industry Volume (gigawatt) Forecast, by Application 2019 & 2032
- Table 91: Global Biomass Energy Industry Revenue Million Forecast, by Type 2019 & 2032
- Table 92: Global Biomass Energy Industry Volume gigawatt Forecast, by Type 2019 & 2032
- Table 93: Global Biomass Energy Industry Revenue Million Forecast, by Technology 2019 & 2032
- Table 94: Global Biomass Energy Industry Volume gigawatt Forecast, by Technology 2019 & 2032
- Table 95: Global Biomass Energy Industry Revenue Million Forecast, by Country 2019 & 2032
- Table 96: Global Biomass Energy Industry Volume gigawatt Forecast, by Country 2019 & 2032
- Table 97: United States Biomass Energy Industry Revenue (Million) Forecast, by Application 2019 & 2032
- Table 98: United States Biomass Energy Industry Volume (gigawatt) Forecast, by Application 2019 & 2032
- Table 99: Canada Biomass Energy Industry Revenue (Million) Forecast, by Application 2019 & 2032
- Table 100: Canada Biomass Energy Industry Volume (gigawatt) Forecast, by Application 2019 & 2032
- Table 101: Rest of North America Biomass Energy Industry Revenue (Million) Forecast, by Application 2019 & 2032
- Table 102: Rest of North America Biomass Energy Industry Volume (gigawatt) Forecast, by Application 2019 & 2032
- Table 103: Global Biomass Energy Industry Revenue Million Forecast, by Type 2019 & 2032
- Table 104: Global Biomass Energy Industry Volume gigawatt Forecast, by Type 2019 & 2032
- Table 105: Global Biomass Energy Industry Revenue Million Forecast, by Technology 2019 & 2032
- Table 106: Global Biomass Energy Industry Volume gigawatt Forecast, by Technology 2019 & 2032
- Table 107: Global Biomass Energy Industry Revenue Million Forecast, by Country 2019 & 2032
- Table 108: Global Biomass Energy Industry Volume gigawatt Forecast, by Country 2019 & 2032
- Table 109: Germany Biomass Energy Industry Revenue (Million) Forecast, by Application 2019 & 2032
- Table 110: Germany Biomass Energy Industry Volume (gigawatt) Forecast, by Application 2019 & 2032
- Table 111: France Biomass Energy Industry Revenue (Million) Forecast, by Application 2019 & 2032
- Table 112: France Biomass Energy Industry Volume (gigawatt) Forecast, by Application 2019 & 2032
- Table 113: United Kingdom Biomass Energy Industry Revenue (Million) Forecast, by Application 2019 & 2032
- Table 114: United Kingdom Biomass Energy Industry Volume (gigawatt) Forecast, by Application 2019 & 2032
- Table 115: Italy Biomass Energy Industry Revenue (Million) Forecast, by Application 2019 & 2032
- Table 116: Italy Biomass Energy Industry Volume (gigawatt) Forecast, by Application 2019 & 2032
- Table 117: Rest of Europe Biomass Energy Industry Revenue (Million) Forecast, by Application 2019 & 2032
- Table 118: Rest of Europe Biomass Energy Industry Volume (gigawatt) Forecast, by Application 2019 & 2032
- Table 119: Global Biomass Energy Industry Revenue Million Forecast, by Type 2019 & 2032
- Table 120: Global Biomass Energy Industry Volume gigawatt Forecast, by Type 2019 & 2032
- Table 121: Global Biomass Energy Industry Revenue Million Forecast, by Technology 2019 & 2032
- Table 122: Global Biomass Energy Industry Volume gigawatt Forecast, by Technology 2019 & 2032
- Table 123: Global Biomass Energy Industry Revenue Million Forecast, by Country 2019 & 2032
- Table 124: Global Biomass Energy Industry Volume gigawatt Forecast, by Country 2019 & 2032
- Table 125: China Biomass Energy Industry Revenue (Million) Forecast, by Application 2019 & 2032
- Table 126: China Biomass Energy Industry Volume (gigawatt) Forecast, by Application 2019 & 2032
- Table 127: India Biomass Energy Industry Revenue (Million) Forecast, by Application 2019 & 2032
- Table 128: India Biomass Energy Industry Volume (gigawatt) Forecast, by Application 2019 & 2032
- Table 129: Japan Biomass Energy Industry Revenue (Million) Forecast, by Application 2019 & 2032
- Table 130: Japan Biomass Energy Industry Volume (gigawatt) Forecast, by Application 2019 & 2032
- Table 131: Australia Biomass Energy Industry Revenue (Million) Forecast, by Application 2019 & 2032
- Table 132: Australia Biomass Energy Industry Volume (gigawatt) Forecast, by Application 2019 & 2032
- Table 133: Rest of Asia Pacific Biomass Energy Industry Revenue (Million) Forecast, by Application 2019 & 2032
- Table 134: Rest of Asia Pacific Biomass Energy Industry Volume (gigawatt) Forecast, by Application 2019 & 2032
- Table 135: Global Biomass Energy Industry Revenue Million Forecast, by Type 2019 & 2032
- Table 136: Global Biomass Energy Industry Volume gigawatt Forecast, by Type 2019 & 2032
- Table 137: Global Biomass Energy Industry Revenue Million Forecast, by Technology 2019 & 2032
- Table 138: Global Biomass Energy Industry Volume gigawatt Forecast, by Technology 2019 & 2032
- Table 139: Global Biomass Energy Industry Revenue Million Forecast, by Country 2019 & 2032
- Table 140: Global Biomass Energy Industry Volume gigawatt Forecast, by Country 2019 & 2032
- Table 141: Brazil Biomass Energy Industry Revenue (Million) Forecast, by Application 2019 & 2032
- Table 142: Brazil Biomass Energy Industry Volume (gigawatt) Forecast, by Application 2019 & 2032
- Table 143: Argentina Biomass Energy Industry Revenue (Million) Forecast, by Application 2019 & 2032
- Table 144: Argentina Biomass Energy Industry Volume (gigawatt) Forecast, by Application 2019 & 2032
- Table 145: Chile Biomass Energy Industry Revenue (Million) Forecast, by Application 2019 & 2032
- Table 146: Chile Biomass Energy Industry Volume (gigawatt) Forecast, by Application 2019 & 2032
- Table 147: Rest of South America Biomass Energy Industry Revenue (Million) Forecast, by Application 2019 & 2032
- Table 148: Rest of South America Biomass Energy Industry Volume (gigawatt) Forecast, by Application 2019 & 2032
- Table 149: Global Biomass Energy Industry Revenue Million Forecast, by Type 2019 & 2032
- Table 150: Global Biomass Energy Industry Volume gigawatt Forecast, by Type 2019 & 2032
- Table 151: Global Biomass Energy Industry Revenue Million Forecast, by Technology 2019 & 2032
- Table 152: Global Biomass Energy Industry Volume gigawatt Forecast, by Technology 2019 & 2032
- Table 153: Global Biomass Energy Industry Revenue Million Forecast, by Country 2019 & 2032
- Table 154: Global Biomass Energy Industry Volume gigawatt Forecast, by Country 2019 & 2032
- Table 155: Saudi Arabia Biomass Energy Industry Revenue (Million) Forecast, by Application 2019 & 2032
- Table 156: Saudi Arabia Biomass Energy Industry Volume (gigawatt) Forecast, by Application 2019 & 2032
- Table 157: United Arab Emirates Biomass Energy Industry Revenue (Million) Forecast, by Application 2019 & 2032
- Table 158: United Arab Emirates Biomass Energy Industry Volume (gigawatt) Forecast, by Application 2019 & 2032
- Table 159: South Africa Biomass Energy Industry Revenue (Million) Forecast, by Application 2019 & 2032
- Table 160: South Africa Biomass Energy Industry Volume (gigawatt) Forecast, by Application 2019 & 2032
- Table 161: Qatar Biomass Energy Industry Revenue (Million) Forecast, by Application 2019 & 2032
- Table 162: Qatar Biomass Energy Industry Volume (gigawatt) Forecast, by Application 2019 & 2032
Frequently Asked Questions
1. What is the projected Compound Annual Growth Rate (CAGR) of the Biomass Energy Industry?
The projected CAGR is approximately 5.82%.
2. Which companies are prominent players in the Biomass Energy Industry?
Key companies in the market include Enerkem, A2A SpA, BTG Biomass Technology Group, Hitachi Zosen Corp, Babcock & Wilcox Volund AS, Biomass Engineering Ltd, Fortum Oyj, Orsted AS, MVV Energie AG, Mitsubishi Heavy Industries Ltd.
3. What are the main segments of the Biomass Energy Industry?
The market segments include Type, Technology.
4. Can you provide details about the market size?
The market size is estimated to be USD XX Million as of 2022.
5. What are some drivers contributing to market growth?
Shift towards Renewable Energy4.; Less Electricity Generation Cost from Bioenergy.
6. What are the notable trends driving market growth?
Biomass is Expected to Dominate the Market.
7. Are there any restraints impacting market growth?
High Initial Investments.
8. Can you provide examples of recent developments in the market?
June 2023: Canada's Minister of Natural Resources announced a USD 10 million contribution to BioLesna Carbon Technologies LP, a joint venture between BC Biocarbon and Dunkley Lumber Ltd., for a new biorefinery in Carrot River, Saskatchewan.
9. What pricing options are available for accessing the report?
Pricing options include single-user, multi-user, and enterprise licenses priced at USD 4750, USD 5250, and USD 8750 respectively.
10. Is the market size provided in terms of value or volume?
The market size is provided in terms of value, measured in Million and volume, measured in gigawatt.
11. Are there any specific market keywords associated with the report?
Yes, the market keyword associated with the report is "Biomass Energy Industry," which aids in identifying and referencing the specific market segment covered.
12. How do I determine which pricing option suits my needs best?
The pricing options vary based on user requirements and access needs. Individual users may opt for single-user licenses, while businesses requiring broader access may choose multi-user or enterprise licenses for cost-effective access to the report.
13. Are there any additional resources or data provided in the Biomass Energy Industry report?
While the report offers comprehensive insights, it's advisable to review the specific contents or supplementary materials provided to ascertain if additional resources or data are available.
14. How can I stay updated on further developments or reports in the Biomass Energy Industry?
To stay informed about further developments, trends, and reports in the Biomass Energy Industry, consider subscribing to industry newsletters, following relevant companies and organizations, or regularly checking reputable industry news sources and publications.
Methodology
Step 1 - Identification of Relevant Samples Size from Population Database


Step 2 - Approaches for Defining Global Market Size (Value, Volume* & Price*)

Note*: In applicable scenarios
Step 3 - Data Sources
Primary Research
- Web Analytics
- Survey Reports
- Research Institute
- Latest Research Reports
- Opinion Leaders
Secondary Research
- Annual Reports
- White Paper
- Latest Press Release
- Industry Association
- Paid Database
- Investor Presentations

Step 4 - Data Triangulation
Involves using different sources of information in order to increase the validity of a study
These sources are likely to be stakeholders in a program - participants, other researchers, program staff, other community members, and so on.
Then we put all data in single framework & apply various statistical tools to find out the dynamic on the market.
During the analysis stage, feedback from the stakeholder groups would be compared to determine areas of agreement as well as areas of divergence


