
Key Insights
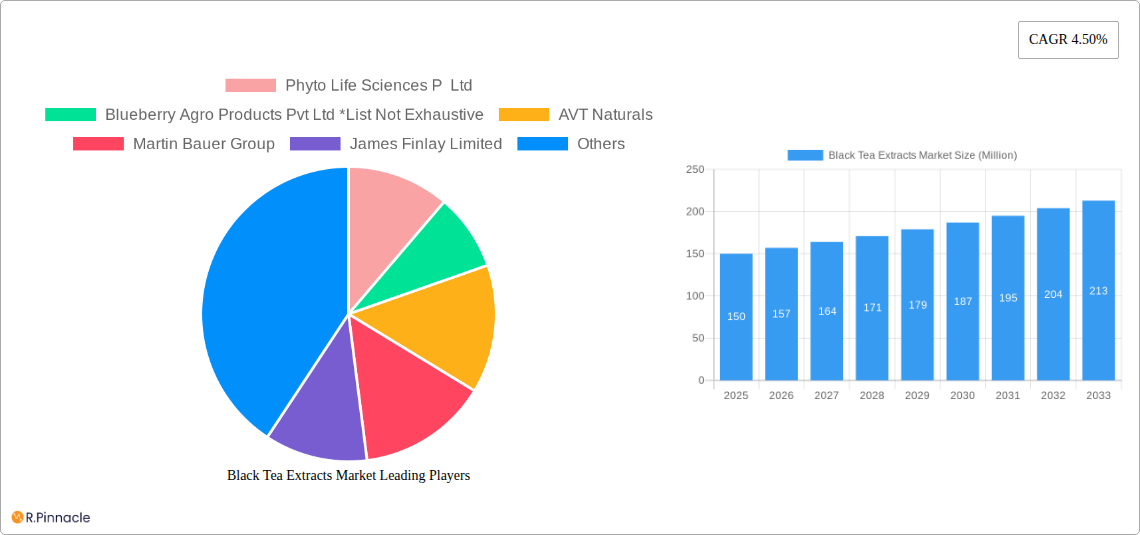
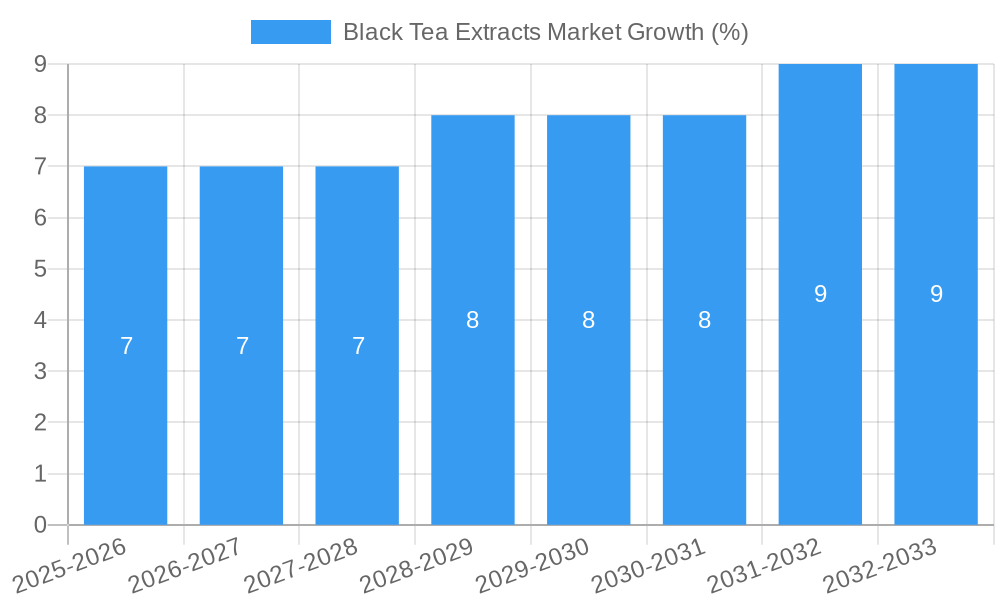
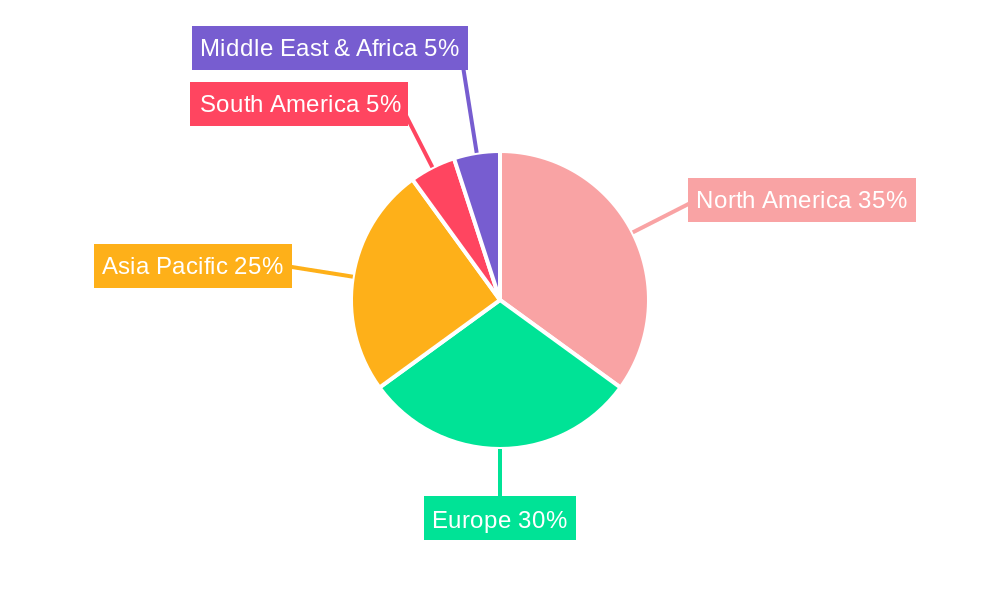
The black tea extracts market, valued at approximately $XX million in 2025, is projected to experience steady growth, exhibiting a compound annual growth rate (CAGR) of 4.50% from 2025 to 2033. This expansion is driven by several key factors. The increasing demand for natural and functional food ingredients fuels the adoption of black tea extracts in beverages, functional foods, and dietary supplements. Consumers are increasingly seeking healthier alternatives, and black tea extracts, rich in antioxidants and bioactive compounds, align perfectly with this trend. The burgeoning cosmetics and beauty supplements sector also presents a significant opportunity, with black tea extracts utilized for their purported skin benefits. Furthermore, the growing awareness of health benefits linked to black tea consumption, such as improved cardiovascular health and enhanced cognitive function, is driving market expansion. The market is segmented by form (liquid, encapsulated, powder), application (beverages, functional foods, cosmetics & beauty supplements, dietary supplements, others), and solubility (hot water soluble, cold water soluble). While the powder form currently dominates due to ease of use and versatility, the encapsulated segment is anticipated to witness significant growth owing to its enhanced stability and precise dosage control. Geographic distribution shows robust demand across North America and Europe, with Asia-Pacific poised for substantial growth driven by increasing disposable incomes and rising health consciousness in emerging markets. However, factors like fluctuating raw material prices and potential regulatory hurdles could pose challenges to market expansion.
The competitive landscape is moderately concentrated, with key players like Phyto Life Sciences P Ltd, AVT Naturals, and Martin Bauer Group driving innovation and market penetration through strategic partnerships, product diversification, and geographical expansion. Smaller, regional players cater to niche markets and offer specialized extracts. The market's future trajectory is positive, bolstered by continuous research into the health benefits of black tea extracts and the expanding applications across various sectors. However, maintaining sustainable sourcing practices and addressing consumer concerns regarding potential contaminants remain critical for long-term market sustainability. Future growth will depend on successful innovation in product formulations and delivery systems, effective marketing strategies that highlight the unique benefits of black tea extracts, and the continued expansion into new geographic markets.
Black Tea Extracts Market: A Comprehensive Report (2019-2033)
This in-depth report provides a comprehensive analysis of the global Black Tea Extracts market, offering invaluable insights for industry professionals, investors, and strategists. Covering the period from 2019 to 2033, with a focus on 2025, this report meticulously examines market dynamics, segmentation, leading players, and future trends. The study period encompasses historical data (2019-2024), the base year (2025), and a detailed forecast (2025-2033). Expect actionable intelligence to guide your strategic decision-making in this dynamic market.
Black Tea Extracts Market Structure & Innovation Trends
This section analyzes the competitive landscape of the black tea extracts market, focusing on market concentration, innovation drivers, regulatory frameworks, and industry dynamics. The market shows a moderately concentrated structure, with key players like AVT Naturals, Martin Bauer Group, and James Finlay Limited holding significant market share (estimated at xx% combined in 2025). However, the presence of numerous smaller players, including Phyto Life Sciences P Ltd, Blueberry Agro Products Pvt Ltd, Amax NutraSource Inc, Synthite Industries, Teawolf LLC, and Cymbio Pharma Pvt Ltd, indicates a competitive environment. Innovation is primarily driven by the development of novel extraction methods to enhance the bioavailability and efficacy of black tea extracts, leading to new product forms like encapsulated and powdered extracts. Regulatory frameworks, particularly those related to food safety and labeling, significantly impact market growth. The market also faces pressure from substitutes like herbal extracts and other natural ingredients. M&A activity has been moderate in recent years, with deal values averaging around xx Million USD annually (2019-2024). Future M&A activity is expected to increase as larger players seek to expand their market share and product portfolios. End-user demographics show a growing preference for functional foods and beverages enriched with natural ingredients, fueling market growth.
Black Tea Extracts Market Dynamics & Trends
The global black tea extracts market is experiencing robust growth, driven by several key factors. The increasing demand for natural and functional food ingredients, coupled with the rising health-conscious consumer base, are primary drivers. The market is expected to exhibit a CAGR of xx% during the forecast period (2025-2033), driven by the expanding applications of black tea extracts in diverse sectors such as beverages, dietary supplements, cosmetics, and functional foods. Technological advancements in extraction techniques are improving the quality, consistency, and yield of black tea extracts. The market penetration of black tea extracts is currently estimated at xx%, with significant potential for growth, especially in developing economies. Consumer preferences are shifting towards clean-label products, further propelling demand for natural and sustainably sourced black tea extracts. Competitive dynamics are characterized by both price competition and innovation-driven differentiation among players.
Dominant Regions & Segments in Black Tea Extracts Market
The Asia-Pacific region currently holds the largest market share in the black tea extracts market, driven by factors such as high tea consumption, a large and growing population, and favorable economic conditions. Within this region, China and India are leading national markets. Key drivers for this dominance include robust economic growth, increasing disposable incomes, and a burgeoning health and wellness industry. Other regions, including North America and Europe, are also exhibiting significant growth, albeit at a slightly slower pace compared to Asia-Pacific.
- Type: Hot Water Soluble (HWS) extracts currently dominate the market due to their ease of use and widespread application in various products. Cold Water Soluble (CWS) extracts are gaining traction due to their improved solubility and stability.
- Application: Beverages represent the largest application segment, followed by dietary supplements and functional foods. The cosmetics and beauty supplements segment is also showing promising growth.
- Form: Liquid extracts are most prevalent, but the demand for encapsulated and powdered forms is increasing due to their convenience and enhanced shelf-life.
Black Tea Extracts Market Product Innovations
Recent product innovations in the black tea extracts market focus on enhancing the bioavailability and efficacy of the extracts. This includes the development of standardized extracts with specific concentrations of bioactive compounds and novel extraction methods that optimize the yield of desirable components. The market is seeing increased adoption of encapsulation technologies to improve stability and delivery of black tea extracts in various applications. These innovations are providing manufacturers with a competitive edge and meeting the growing demand for high-quality, functional ingredients.
Report Scope & Segmentation Analysis
This report offers a detailed segmentation of the black tea extracts market, analyzing various aspects like product type, application, and form.
- Type: HWS and CWS extracts exhibit distinct growth trajectories, with HWS commanding a larger market share currently but CWS experiencing faster growth. Market size projections for both segments are provided for the forecast period.
- Application: The report details market size and growth projections for each application segment, including beverages, functional foods, cosmetics, dietary supplements, and others. Competitive dynamics within each application segment are also analyzed.
- Form: The market share and growth forecasts for liquid, encapsulated, and powdered forms are presented, along with an analysis of the competitive landscape within each form segment.
Key Drivers of Black Tea Extracts Market Growth
The growth of the black tea extracts market is driven by multiple factors. The increasing consumer awareness of health benefits associated with black tea and its components is a major driver. The expanding application of black tea extracts in various product categories, including beverages, dietary supplements, and cosmetics, further fuels market growth. Technological advancements in extraction techniques are also contributing to increased efficiency and improved product quality. Favorable government regulations and policies promoting the use of natural ingredients in food and beverage products are additionally boosting the market.
Challenges in the Black Tea Extracts Market Sector
Despite its growth potential, the black tea extracts market faces several challenges. Fluctuations in raw material prices can significantly impact production costs and profitability. The intense competition among numerous market players, including both established and emerging companies, can lead to price pressure and reduced profit margins. Maintaining consistent quality and purity of extracts can be challenging, especially with variations in raw material quality. Meeting stringent regulatory requirements for food safety and labeling adds complexity to manufacturing and distribution.
Emerging Opportunities in Black Tea Extracts Market
Emerging opportunities in the black tea extracts market include the growing demand for organic and sustainably sourced products. The development of novel formulations and delivery systems for black tea extracts, such as nano-encapsulation, opens up new avenues for applications in functional foods and nutraceuticals. Expansion into new and emerging markets, particularly in developing countries with a high growth potential, offers significant opportunities. The increasing use of black tea extracts in personalized nutrition and wellness products presents a compelling growth avenue.
Leading Players in the Black Tea Extracts Market Market
- Phyto Life Sciences P Ltd
- Blueberry Agro Products Pvt Ltd
- AVT Naturals
- Martin Bauer Group
- James Finlay Limited
- Amax NutraSource Inc
- Synthite Industries
- Teawolf LLC
- Cymbio Pharma Pvt Ltd
Key Developments in Black Tea Extracts Market Industry
- Jan 2023: AVT Naturals launches a new line of organic black tea extracts.
- May 2022: Martin Bauer Group acquires a smaller black tea extract producer, expanding its market reach.
- Oct 2021: James Finlay Limited invests in a new extraction facility to increase production capacity.
- Further details on specific developments will be included in the full report.
Future Outlook for Black Tea Extracts Market Market
The black tea extracts market is poised for sustained growth over the forecast period. Continued innovation in extraction techniques, expanding applications in diverse sectors, and growing consumer demand for natural and healthy ingredients will drive market expansion. Strategic collaborations and mergers and acquisitions will further shape the competitive landscape. Exploring new markets and developing customized solutions for specific applications will be crucial for companies seeking to capitalize on future growth opportunities. The market's future prospects appear bright, with significant potential for further expansion and innovation.
Black Tea Extracts Market Segmentation
-
1. Form
- 1.1. Liquid
- 1.2. Encapsulated
- 1.3. Powder
-
2. Type
- 2.1. Hot Water Soluble (HWS)
- 2.2. Cold Water Soluble (CWS)
-
3. Application
- 3.1. Beverages
- 3.2. Functional Foods
- 3.3. Cosmetics and Beauty Supplements
- 3.4. Dietary Supplements
- 3.5. Others
Black Tea Extracts Market Segmentation By Geography
-
1. North America
- 1.1. United States
- 1.2. Canada
- 1.3. Mexico
- 1.4. Rest of North America
-
2. Europe
- 2.1. United Kingdom
- 2.2. Germany
- 2.3. France
- 2.4. Russia
- 2.5. Italy
- 2.6. Spain
- 2.7. Rest of Europe
-
3. Asia Pacific
- 3.1. India
- 3.2. China
- 3.3. Japan
- 3.4. Australia
- 3.5. Rest of Asia Pacific
-
4. South America
- 4.1. Brazil
- 4.2. Argentina
- 4.3. Rest of South America
- 5. Middle East
-
6. South Africa
- 6.1. Saudi Arabia
- 6.2. Rest of Middle East
Black Tea Extracts Market REPORT HIGHLIGHTS
| Aspects | Details |
|---|---|
| Study Period | 2019-2033 |
| Base Year | 2024 |
| Estimated Year | 2025 |
| Forecast Period | 2025-2033 |
| Historical Period | 2019-2024 |
| Growth Rate | CAGR of 4.50% from 2019-2033 |
| Segmentation |
|
Table of Contents
- 1. Introduction
- 1.1. Research Scope
- 1.2. Market Segmentation
- 1.3. Research Methodology
- 1.4. Definitions and Assumptions
- 2. Executive Summary
- 2.1. Introduction
- 3. Market Dynamics
- 3.1. Introduction
- 3.2. Market Drivers
- 3.2.1. Awareness Of Health Benefits Of Oleoresins; Rise Of Clean Label Products
- 3.3. Market Restrains
- 3.3.1. Supply Chain Volatility and Availability Of Other Flavor Ingredients
- 3.4. Market Trends
- 3.4.1. Growing Demand for Functional Food
- 4. Market Factor Analysis
- 4.1. Porters Five Forces
- 4.2. Supply/Value Chain
- 4.3. PESTEL analysis
- 4.4. Market Entropy
- 4.5. Patent/Trademark Analysis
- 5. Global Black Tea Extracts Market Analysis, Insights and Forecast, 2019-2031
- 5.1. Market Analysis, Insights and Forecast - by Form
- 5.1.1. Liquid
- 5.1.2. Encapsulated
- 5.1.3. Powder
- 5.2. Market Analysis, Insights and Forecast - by Type
- 5.2.1. Hot Water Soluble (HWS)
- 5.2.2. Cold Water Soluble (CWS)
- 5.3. Market Analysis, Insights and Forecast - by Application
- 5.3.1. Beverages
- 5.3.2. Functional Foods
- 5.3.3. Cosmetics and Beauty Supplements
- 5.3.4. Dietary Supplements
- 5.3.5. Others
- 5.4. Market Analysis, Insights and Forecast - by Region
- 5.4.1. North America
- 5.4.2. Europe
- 5.4.3. Asia Pacific
- 5.4.4. South America
- 5.4.5. Middle East
- 5.4.6. South Africa
- 5.1. Market Analysis, Insights and Forecast - by Form
- 6. North America Black Tea Extracts Market Analysis, Insights and Forecast, 2019-2031
- 6.1. Market Analysis, Insights and Forecast - by Form
- 6.1.1. Liquid
- 6.1.2. Encapsulated
- 6.1.3. Powder
- 6.2. Market Analysis, Insights and Forecast - by Type
- 6.2.1. Hot Water Soluble (HWS)
- 6.2.2. Cold Water Soluble (CWS)
- 6.3. Market Analysis, Insights and Forecast - by Application
- 6.3.1. Beverages
- 6.3.2. Functional Foods
- 6.3.3. Cosmetics and Beauty Supplements
- 6.3.4. Dietary Supplements
- 6.3.5. Others
- 6.1. Market Analysis, Insights and Forecast - by Form
- 7. Europe Black Tea Extracts Market Analysis, Insights and Forecast, 2019-2031
- 7.1. Market Analysis, Insights and Forecast - by Form
- 7.1.1. Liquid
- 7.1.2. Encapsulated
- 7.1.3. Powder
- 7.2. Market Analysis, Insights and Forecast - by Type
- 7.2.1. Hot Water Soluble (HWS)
- 7.2.2. Cold Water Soluble (CWS)
- 7.3. Market Analysis, Insights and Forecast - by Application
- 7.3.1. Beverages
- 7.3.2. Functional Foods
- 7.3.3. Cosmetics and Beauty Supplements
- 7.3.4. Dietary Supplements
- 7.3.5. Others
- 7.1. Market Analysis, Insights and Forecast - by Form
- 8. Asia Pacific Black Tea Extracts Market Analysis, Insights and Forecast, 2019-2031
- 8.1. Market Analysis, Insights and Forecast - by Form
- 8.1.1. Liquid
- 8.1.2. Encapsulated
- 8.1.3. Powder
- 8.2. Market Analysis, Insights and Forecast - by Type
- 8.2.1. Hot Water Soluble (HWS)
- 8.2.2. Cold Water Soluble (CWS)
- 8.3. Market Analysis, Insights and Forecast - by Application
- 8.3.1. Beverages
- 8.3.2. Functional Foods
- 8.3.3. Cosmetics and Beauty Supplements
- 8.3.4. Dietary Supplements
- 8.3.5. Others
- 8.1. Market Analysis, Insights and Forecast - by Form
- 9. South America Black Tea Extracts Market Analysis, Insights and Forecast, 2019-2031
- 9.1. Market Analysis, Insights and Forecast - by Form
- 9.1.1. Liquid
- 9.1.2. Encapsulated
- 9.1.3. Powder
- 9.2. Market Analysis, Insights and Forecast - by Type
- 9.2.1. Hot Water Soluble (HWS)
- 9.2.2. Cold Water Soluble (CWS)
- 9.3. Market Analysis, Insights and Forecast - by Application
- 9.3.1. Beverages
- 9.3.2. Functional Foods
- 9.3.3. Cosmetics and Beauty Supplements
- 9.3.4. Dietary Supplements
- 9.3.5. Others
- 9.1. Market Analysis, Insights and Forecast - by Form
- 10. Middle East Black Tea Extracts Market Analysis, Insights and Forecast, 2019-2031
- 10.1. Market Analysis, Insights and Forecast - by Form
- 10.1.1. Liquid
- 10.1.2. Encapsulated
- 10.1.3. Powder
- 10.2. Market Analysis, Insights and Forecast - by Type
- 10.2.1. Hot Water Soluble (HWS)
- 10.2.2. Cold Water Soluble (CWS)
- 10.3. Market Analysis, Insights and Forecast - by Application
- 10.3.1. Beverages
- 10.3.2. Functional Foods
- 10.3.3. Cosmetics and Beauty Supplements
- 10.3.4. Dietary Supplements
- 10.3.5. Others
- 10.1. Market Analysis, Insights and Forecast - by Form
- 11. South Africa Black Tea Extracts Market Analysis, Insights and Forecast, 2019-2031
- 11.1. Market Analysis, Insights and Forecast - by Form
- 11.1.1. Liquid
- 11.1.2. Encapsulated
- 11.1.3. Powder
- 11.2. Market Analysis, Insights and Forecast - by Type
- 11.2.1. Hot Water Soluble (HWS)
- 11.2.2. Cold Water Soluble (CWS)
- 11.3. Market Analysis, Insights and Forecast - by Application
- 11.3.1. Beverages
- 11.3.2. Functional Foods
- 11.3.3. Cosmetics and Beauty Supplements
- 11.3.4. Dietary Supplements
- 11.3.5. Others
- 11.1. Market Analysis, Insights and Forecast - by Form
- 12. North America Black Tea Extracts Market Analysis, Insights and Forecast, 2019-2031
- 12.1. Market Analysis, Insights and Forecast - By Country/Sub-region
- 12.1.1 United States
- 12.1.2 Canada
- 12.1.3 Mexico
- 12.1.4 Rest of North America
- 13. Europe Black Tea Extracts Market Analysis, Insights and Forecast, 2019-2031
- 13.1. Market Analysis, Insights and Forecast - By Country/Sub-region
- 13.1.1 United Kingdom
- 13.1.2 Germany
- 13.1.3 France
- 13.1.4 Russia
- 13.1.5 Italy
- 13.1.6 Spain
- 13.1.7 Rest of Europe
- 14. Asia Pacific Black Tea Extracts Market Analysis, Insights and Forecast, 2019-2031
- 14.1. Market Analysis, Insights and Forecast - By Country/Sub-region
- 14.1.1 India
- 14.1.2 China
- 14.1.3 Japan
- 14.1.4 Australia
- 14.1.5 Rest of Asia Pacific
- 15. South America Black Tea Extracts Market Analysis, Insights and Forecast, 2019-2031
- 15.1. Market Analysis, Insights and Forecast - By Country/Sub-region
- 15.1.1 Brazil
- 15.1.2 Argentina
- 15.1.3 Rest of South America
- 16. Middle East Black Tea Extracts Market Analysis, Insights and Forecast, 2019-2031
- 16.1. Market Analysis, Insights and Forecast - By Country/Sub-region
- 16.1.1.
- 17. South Africa Black Tea Extracts Market Analysis, Insights and Forecast, 2019-2031
- 17.1. Market Analysis, Insights and Forecast - By Country/Sub-region
- 17.1.1 Saudi Arabia
- 17.1.2 Rest of Middle East
- 18. Competitive Analysis
- 18.1. Global Market Share Analysis 2024
- 18.2. Company Profiles
- 18.2.1 Phyto Life Sciences P Ltd
- 18.2.1.1. Overview
- 18.2.1.2. Products
- 18.2.1.3. SWOT Analysis
- 18.2.1.4. Recent Developments
- 18.2.1.5. Financials (Based on Availability)
- 18.2.2 Blueberry Agro Products Pvt Ltd *List Not Exhaustive
- 18.2.2.1. Overview
- 18.2.2.2. Products
- 18.2.2.3. SWOT Analysis
- 18.2.2.4. Recent Developments
- 18.2.2.5. Financials (Based on Availability)
- 18.2.3 AVT Naturals
- 18.2.3.1. Overview
- 18.2.3.2. Products
- 18.2.3.3. SWOT Analysis
- 18.2.3.4. Recent Developments
- 18.2.3.5. Financials (Based on Availability)
- 18.2.4 Martin Bauer Group
- 18.2.4.1. Overview
- 18.2.4.2. Products
- 18.2.4.3. SWOT Analysis
- 18.2.4.4. Recent Developments
- 18.2.4.5. Financials (Based on Availability)
- 18.2.5 James Finlay Limited
- 18.2.5.1. Overview
- 18.2.5.2. Products
- 18.2.5.3. SWOT Analysis
- 18.2.5.4. Recent Developments
- 18.2.5.5. Financials (Based on Availability)
- 18.2.6 Amax NutraSource Inc
- 18.2.6.1. Overview
- 18.2.6.2. Products
- 18.2.6.3. SWOT Analysis
- 18.2.6.4. Recent Developments
- 18.2.6.5. Financials (Based on Availability)
- 18.2.7 Synthite Industries
- 18.2.7.1. Overview
- 18.2.7.2. Products
- 18.2.7.3. SWOT Analysis
- 18.2.7.4. Recent Developments
- 18.2.7.5. Financials (Based on Availability)
- 18.2.8 Teawolf LLC
- 18.2.8.1. Overview
- 18.2.8.2. Products
- 18.2.8.3. SWOT Analysis
- 18.2.8.4. Recent Developments
- 18.2.8.5. Financials (Based on Availability)
- 18.2.9 Cymbio Pharma Pvt Ltd
- 18.2.9.1. Overview
- 18.2.9.2. Products
- 18.2.9.3. SWOT Analysis
- 18.2.9.4. Recent Developments
- 18.2.9.5. Financials (Based on Availability)
- 18.2.1 Phyto Life Sciences P Ltd
List of Figures
- Figure 1: Global Black Tea Extracts Market Revenue Breakdown (Million, %) by Region 2024 & 2032
- Figure 2: Global Black Tea Extracts Market Volume Breakdown (K Tons, %) by Region 2024 & 2032
- Figure 3: North America Black Tea Extracts Market Revenue (Million), by Country 2024 & 2032
- Figure 4: North America Black Tea Extracts Market Volume (K Tons), by Country 2024 & 2032
- Figure 5: North America Black Tea Extracts Market Revenue Share (%), by Country 2024 & 2032
- Figure 6: North America Black Tea Extracts Market Volume Share (%), by Country 2024 & 2032
- Figure 7: Europe Black Tea Extracts Market Revenue (Million), by Country 2024 & 2032
- Figure 8: Europe Black Tea Extracts Market Volume (K Tons), by Country 2024 & 2032
- Figure 9: Europe Black Tea Extracts Market Revenue Share (%), by Country 2024 & 2032
- Figure 10: Europe Black Tea Extracts Market Volume Share (%), by Country 2024 & 2032
- Figure 11: Asia Pacific Black Tea Extracts Market Revenue (Million), by Country 2024 & 2032
- Figure 12: Asia Pacific Black Tea Extracts Market Volume (K Tons), by Country 2024 & 2032
- Figure 13: Asia Pacific Black Tea Extracts Market Revenue Share (%), by Country 2024 & 2032
- Figure 14: Asia Pacific Black Tea Extracts Market Volume Share (%), by Country 2024 & 2032
- Figure 15: South America Black Tea Extracts Market Revenue (Million), by Country 2024 & 2032
- Figure 16: South America Black Tea Extracts Market Volume (K Tons), by Country 2024 & 2032
- Figure 17: South America Black Tea Extracts Market Revenue Share (%), by Country 2024 & 2032
- Figure 18: South America Black Tea Extracts Market Volume Share (%), by Country 2024 & 2032
- Figure 19: Middle East Black Tea Extracts Market Revenue (Million), by Country 2024 & 2032
- Figure 20: Middle East Black Tea Extracts Market Volume (K Tons), by Country 2024 & 2032
- Figure 21: Middle East Black Tea Extracts Market Revenue Share (%), by Country 2024 & 2032
- Figure 22: Middle East Black Tea Extracts Market Volume Share (%), by Country 2024 & 2032
- Figure 23: South Africa Black Tea Extracts Market Revenue (Million), by Country 2024 & 2032
- Figure 24: South Africa Black Tea Extracts Market Volume (K Tons), by Country 2024 & 2032
- Figure 25: South Africa Black Tea Extracts Market Revenue Share (%), by Country 2024 & 2032
- Figure 26: South Africa Black Tea Extracts Market Volume Share (%), by Country 2024 & 2032
- Figure 27: North America Black Tea Extracts Market Revenue (Million), by Form 2024 & 2032
- Figure 28: North America Black Tea Extracts Market Volume (K Tons), by Form 2024 & 2032
- Figure 29: North America Black Tea Extracts Market Revenue Share (%), by Form 2024 & 2032
- Figure 30: North America Black Tea Extracts Market Volume Share (%), by Form 2024 & 2032
- Figure 31: North America Black Tea Extracts Market Revenue (Million), by Type 2024 & 2032
- Figure 32: North America Black Tea Extracts Market Volume (K Tons), by Type 2024 & 2032
- Figure 33: North America Black Tea Extracts Market Revenue Share (%), by Type 2024 & 2032
- Figure 34: North America Black Tea Extracts Market Volume Share (%), by Type 2024 & 2032
- Figure 35: North America Black Tea Extracts Market Revenue (Million), by Application 2024 & 2032
- Figure 36: North America Black Tea Extracts Market Volume (K Tons), by Application 2024 & 2032
- Figure 37: North America Black Tea Extracts Market Revenue Share (%), by Application 2024 & 2032
- Figure 38: North America Black Tea Extracts Market Volume Share (%), by Application 2024 & 2032
- Figure 39: North America Black Tea Extracts Market Revenue (Million), by Country 2024 & 2032
- Figure 40: North America Black Tea Extracts Market Volume (K Tons), by Country 2024 & 2032
- Figure 41: North America Black Tea Extracts Market Revenue Share (%), by Country 2024 & 2032
- Figure 42: North America Black Tea Extracts Market Volume Share (%), by Country 2024 & 2032
- Figure 43: Europe Black Tea Extracts Market Revenue (Million), by Form 2024 & 2032
- Figure 44: Europe Black Tea Extracts Market Volume (K Tons), by Form 2024 & 2032
- Figure 45: Europe Black Tea Extracts Market Revenue Share (%), by Form 2024 & 2032
- Figure 46: Europe Black Tea Extracts Market Volume Share (%), by Form 2024 & 2032
- Figure 47: Europe Black Tea Extracts Market Revenue (Million), by Type 2024 & 2032
- Figure 48: Europe Black Tea Extracts Market Volume (K Tons), by Type 2024 & 2032
- Figure 49: Europe Black Tea Extracts Market Revenue Share (%), by Type 2024 & 2032
- Figure 50: Europe Black Tea Extracts Market Volume Share (%), by Type 2024 & 2032
- Figure 51: Europe Black Tea Extracts Market Revenue (Million), by Application 2024 & 2032
- Figure 52: Europe Black Tea Extracts Market Volume (K Tons), by Application 2024 & 2032
- Figure 53: Europe Black Tea Extracts Market Revenue Share (%), by Application 2024 & 2032
- Figure 54: Europe Black Tea Extracts Market Volume Share (%), by Application 2024 & 2032
- Figure 55: Europe Black Tea Extracts Market Revenue (Million), by Country 2024 & 2032
- Figure 56: Europe Black Tea Extracts Market Volume (K Tons), by Country 2024 & 2032
- Figure 57: Europe Black Tea Extracts Market Revenue Share (%), by Country 2024 & 2032
- Figure 58: Europe Black Tea Extracts Market Volume Share (%), by Country 2024 & 2032
- Figure 59: Asia Pacific Black Tea Extracts Market Revenue (Million), by Form 2024 & 2032
- Figure 60: Asia Pacific Black Tea Extracts Market Volume (K Tons), by Form 2024 & 2032
- Figure 61: Asia Pacific Black Tea Extracts Market Revenue Share (%), by Form 2024 & 2032
- Figure 62: Asia Pacific Black Tea Extracts Market Volume Share (%), by Form 2024 & 2032
- Figure 63: Asia Pacific Black Tea Extracts Market Revenue (Million), by Type 2024 & 2032
- Figure 64: Asia Pacific Black Tea Extracts Market Volume (K Tons), by Type 2024 & 2032
- Figure 65: Asia Pacific Black Tea Extracts Market Revenue Share (%), by Type 2024 & 2032
- Figure 66: Asia Pacific Black Tea Extracts Market Volume Share (%), by Type 2024 & 2032
- Figure 67: Asia Pacific Black Tea Extracts Market Revenue (Million), by Application 2024 & 2032
- Figure 68: Asia Pacific Black Tea Extracts Market Volume (K Tons), by Application 2024 & 2032
- Figure 69: Asia Pacific Black Tea Extracts Market Revenue Share (%), by Application 2024 & 2032
- Figure 70: Asia Pacific Black Tea Extracts Market Volume Share (%), by Application 2024 & 2032
- Figure 71: Asia Pacific Black Tea Extracts Market Revenue (Million), by Country 2024 & 2032
- Figure 72: Asia Pacific Black Tea Extracts Market Volume (K Tons), by Country 2024 & 2032
- Figure 73: Asia Pacific Black Tea Extracts Market Revenue Share (%), by Country 2024 & 2032
- Figure 74: Asia Pacific Black Tea Extracts Market Volume Share (%), by Country 2024 & 2032
- Figure 75: South America Black Tea Extracts Market Revenue (Million), by Form 2024 & 2032
- Figure 76: South America Black Tea Extracts Market Volume (K Tons), by Form 2024 & 2032
- Figure 77: South America Black Tea Extracts Market Revenue Share (%), by Form 2024 & 2032
- Figure 78: South America Black Tea Extracts Market Volume Share (%), by Form 2024 & 2032
- Figure 79: South America Black Tea Extracts Market Revenue (Million), by Type 2024 & 2032
- Figure 80: South America Black Tea Extracts Market Volume (K Tons), by Type 2024 & 2032
- Figure 81: South America Black Tea Extracts Market Revenue Share (%), by Type 2024 & 2032
- Figure 82: South America Black Tea Extracts Market Volume Share (%), by Type 2024 & 2032
- Figure 83: South America Black Tea Extracts Market Revenue (Million), by Application 2024 & 2032
- Figure 84: South America Black Tea Extracts Market Volume (K Tons), by Application 2024 & 2032
- Figure 85: South America Black Tea Extracts Market Revenue Share (%), by Application 2024 & 2032
- Figure 86: South America Black Tea Extracts Market Volume Share (%), by Application 2024 & 2032
- Figure 87: South America Black Tea Extracts Market Revenue (Million), by Country 2024 & 2032
- Figure 88: South America Black Tea Extracts Market Volume (K Tons), by Country 2024 & 2032
- Figure 89: South America Black Tea Extracts Market Revenue Share (%), by Country 2024 & 2032
- Figure 90: South America Black Tea Extracts Market Volume Share (%), by Country 2024 & 2032
- Figure 91: Middle East Black Tea Extracts Market Revenue (Million), by Form 2024 & 2032
- Figure 92: Middle East Black Tea Extracts Market Volume (K Tons), by Form 2024 & 2032
- Figure 93: Middle East Black Tea Extracts Market Revenue Share (%), by Form 2024 & 2032
- Figure 94: Middle East Black Tea Extracts Market Volume Share (%), by Form 2024 & 2032
- Figure 95: Middle East Black Tea Extracts Market Revenue (Million), by Type 2024 & 2032
- Figure 96: Middle East Black Tea Extracts Market Volume (K Tons), by Type 2024 & 2032
- Figure 97: Middle East Black Tea Extracts Market Revenue Share (%), by Type 2024 & 2032
- Figure 98: Middle East Black Tea Extracts Market Volume Share (%), by Type 2024 & 2032
- Figure 99: Middle East Black Tea Extracts Market Revenue (Million), by Application 2024 & 2032
- Figure 100: Middle East Black Tea Extracts Market Volume (K Tons), by Application 2024 & 2032
- Figure 101: Middle East Black Tea Extracts Market Revenue Share (%), by Application 2024 & 2032
- Figure 102: Middle East Black Tea Extracts Market Volume Share (%), by Application 2024 & 2032
- Figure 103: Middle East Black Tea Extracts Market Revenue (Million), by Country 2024 & 2032
- Figure 104: Middle East Black Tea Extracts Market Volume (K Tons), by Country 2024 & 2032
- Figure 105: Middle East Black Tea Extracts Market Revenue Share (%), by Country 2024 & 2032
- Figure 106: Middle East Black Tea Extracts Market Volume Share (%), by Country 2024 & 2032
- Figure 107: South Africa Black Tea Extracts Market Revenue (Million), by Form 2024 & 2032
- Figure 108: South Africa Black Tea Extracts Market Volume (K Tons), by Form 2024 & 2032
- Figure 109: South Africa Black Tea Extracts Market Revenue Share (%), by Form 2024 & 2032
- Figure 110: South Africa Black Tea Extracts Market Volume Share (%), by Form 2024 & 2032
- Figure 111: South Africa Black Tea Extracts Market Revenue (Million), by Type 2024 & 2032
- Figure 112: South Africa Black Tea Extracts Market Volume (K Tons), by Type 2024 & 2032
- Figure 113: South Africa Black Tea Extracts Market Revenue Share (%), by Type 2024 & 2032
- Figure 114: South Africa Black Tea Extracts Market Volume Share (%), by Type 2024 & 2032
- Figure 115: South Africa Black Tea Extracts Market Revenue (Million), by Application 2024 & 2032
- Figure 116: South Africa Black Tea Extracts Market Volume (K Tons), by Application 2024 & 2032
- Figure 117: South Africa Black Tea Extracts Market Revenue Share (%), by Application 2024 & 2032
- Figure 118: South Africa Black Tea Extracts Market Volume Share (%), by Application 2024 & 2032
- Figure 119: South Africa Black Tea Extracts Market Revenue (Million), by Country 2024 & 2032
- Figure 120: South Africa Black Tea Extracts Market Volume (K Tons), by Country 2024 & 2032
- Figure 121: South Africa Black Tea Extracts Market Revenue Share (%), by Country 2024 & 2032
- Figure 122: South Africa Black Tea Extracts Market Volume Share (%), by Country 2024 & 2032
List of Tables
- Table 1: Global Black Tea Extracts Market Revenue Million Forecast, by Region 2019 & 2032
- Table 2: Global Black Tea Extracts Market Volume K Tons Forecast, by Region 2019 & 2032
- Table 3: Global Black Tea Extracts Market Revenue Million Forecast, by Form 2019 & 2032
- Table 4: Global Black Tea Extracts Market Volume K Tons Forecast, by Form 2019 & 2032
- Table 5: Global Black Tea Extracts Market Revenue Million Forecast, by Type 2019 & 2032
- Table 6: Global Black Tea Extracts Market Volume K Tons Forecast, by Type 2019 & 2032
- Table 7: Global Black Tea Extracts Market Revenue Million Forecast, by Application 2019 & 2032
- Table 8: Global Black Tea Extracts Market Volume K Tons Forecast, by Application 2019 & 2032
- Table 9: Global Black Tea Extracts Market Revenue Million Forecast, by Region 2019 & 2032
- Table 10: Global Black Tea Extracts Market Volume K Tons Forecast, by Region 2019 & 2032
- Table 11: Global Black Tea Extracts Market Revenue Million Forecast, by Country 2019 & 2032
- Table 12: Global Black Tea Extracts Market Volume K Tons Forecast, by Country 2019 & 2032
- Table 13: United States Black Tea Extracts Market Revenue (Million) Forecast, by Application 2019 & 2032
- Table 14: United States Black Tea Extracts Market Volume (K Tons) Forecast, by Application 2019 & 2032
- Table 15: Canada Black Tea Extracts Market Revenue (Million) Forecast, by Application 2019 & 2032
- Table 16: Canada Black Tea Extracts Market Volume (K Tons) Forecast, by Application 2019 & 2032
- Table 17: Mexico Black Tea Extracts Market Revenue (Million) Forecast, by Application 2019 & 2032
- Table 18: Mexico Black Tea Extracts Market Volume (K Tons) Forecast, by Application 2019 & 2032
- Table 19: Rest of North America Black Tea Extracts Market Revenue (Million) Forecast, by Application 2019 & 2032
- Table 20: Rest of North America Black Tea Extracts Market Volume (K Tons) Forecast, by Application 2019 & 2032
- Table 21: Global Black Tea Extracts Market Revenue Million Forecast, by Country 2019 & 2032
- Table 22: Global Black Tea Extracts Market Volume K Tons Forecast, by Country 2019 & 2032
- Table 23: United Kingdom Black Tea Extracts Market Revenue (Million) Forecast, by Application 2019 & 2032
- Table 24: United Kingdom Black Tea Extracts Market Volume (K Tons) Forecast, by Application 2019 & 2032
- Table 25: Germany Black Tea Extracts Market Revenue (Million) Forecast, by Application 2019 & 2032
- Table 26: Germany Black Tea Extracts Market Volume (K Tons) Forecast, by Application 2019 & 2032
- Table 27: France Black Tea Extracts Market Revenue (Million) Forecast, by Application 2019 & 2032
- Table 28: France Black Tea Extracts Market Volume (K Tons) Forecast, by Application 2019 & 2032
- Table 29: Russia Black Tea Extracts Market Revenue (Million) Forecast, by Application 2019 & 2032
- Table 30: Russia Black Tea Extracts Market Volume (K Tons) Forecast, by Application 2019 & 2032
- Table 31: Italy Black Tea Extracts Market Revenue (Million) Forecast, by Application 2019 & 2032
- Table 32: Italy Black Tea Extracts Market Volume (K Tons) Forecast, by Application 2019 & 2032
- Table 33: Spain Black Tea Extracts Market Revenue (Million) Forecast, by Application 2019 & 2032
- Table 34: Spain Black Tea Extracts Market Volume (K Tons) Forecast, by Application 2019 & 2032
- Table 35: Rest of Europe Black Tea Extracts Market Revenue (Million) Forecast, by Application 2019 & 2032
- Table 36: Rest of Europe Black Tea Extracts Market Volume (K Tons) Forecast, by Application 2019 & 2032
- Table 37: Global Black Tea Extracts Market Revenue Million Forecast, by Country 2019 & 2032
- Table 38: Global Black Tea Extracts Market Volume K Tons Forecast, by Country 2019 & 2032
- Table 39: India Black Tea Extracts Market Revenue (Million) Forecast, by Application 2019 & 2032
- Table 40: India Black Tea Extracts Market Volume (K Tons) Forecast, by Application 2019 & 2032
- Table 41: China Black Tea Extracts Market Revenue (Million) Forecast, by Application 2019 & 2032
- Table 42: China Black Tea Extracts Market Volume (K Tons) Forecast, by Application 2019 & 2032
- Table 43: Japan Black Tea Extracts Market Revenue (Million) Forecast, by Application 2019 & 2032
- Table 44: Japan Black Tea Extracts Market Volume (K Tons) Forecast, by Application 2019 & 2032
- Table 45: Australia Black Tea Extracts Market Revenue (Million) Forecast, by Application 2019 & 2032
- Table 46: Australia Black Tea Extracts Market Volume (K Tons) Forecast, by Application 2019 & 2032
- Table 47: Rest of Asia Pacific Black Tea Extracts Market Revenue (Million) Forecast, by Application 2019 & 2032
- Table 48: Rest of Asia Pacific Black Tea Extracts Market Volume (K Tons) Forecast, by Application 2019 & 2032
- Table 49: Global Black Tea Extracts Market Revenue Million Forecast, by Country 2019 & 2032
- Table 50: Global Black Tea Extracts Market Volume K Tons Forecast, by Country 2019 & 2032
- Table 51: Brazil Black Tea Extracts Market Revenue (Million) Forecast, by Application 2019 & 2032
- Table 52: Brazil Black Tea Extracts Market Volume (K Tons) Forecast, by Application 2019 & 2032
- Table 53: Argentina Black Tea Extracts Market Revenue (Million) Forecast, by Application 2019 & 2032
- Table 54: Argentina Black Tea Extracts Market Volume (K Tons) Forecast, by Application 2019 & 2032
- Table 55: Rest of South America Black Tea Extracts Market Revenue (Million) Forecast, by Application 2019 & 2032
- Table 56: Rest of South America Black Tea Extracts Market Volume (K Tons) Forecast, by Application 2019 & 2032
- Table 57: Global Black Tea Extracts Market Revenue Million Forecast, by Country 2019 & 2032
- Table 58: Global Black Tea Extracts Market Volume K Tons Forecast, by Country 2019 & 2032
- Table 59: Black Tea Extracts Market Revenue (Million) Forecast, by Application 2019 & 2032
- Table 60: Black Tea Extracts Market Volume (K Tons) Forecast, by Application 2019 & 2032
- Table 61: Global Black Tea Extracts Market Revenue Million Forecast, by Country 2019 & 2032
- Table 62: Global Black Tea Extracts Market Volume K Tons Forecast, by Country 2019 & 2032
- Table 63: Saudi Arabia Black Tea Extracts Market Revenue (Million) Forecast, by Application 2019 & 2032
- Table 64: Saudi Arabia Black Tea Extracts Market Volume (K Tons) Forecast, by Application 2019 & 2032
- Table 65: Rest of Middle East Black Tea Extracts Market Revenue (Million) Forecast, by Application 2019 & 2032
- Table 66: Rest of Middle East Black Tea Extracts Market Volume (K Tons) Forecast, by Application 2019 & 2032
- Table 67: Global Black Tea Extracts Market Revenue Million Forecast, by Form 2019 & 2032
- Table 68: Global Black Tea Extracts Market Volume K Tons Forecast, by Form 2019 & 2032
- Table 69: Global Black Tea Extracts Market Revenue Million Forecast, by Type 2019 & 2032
- Table 70: Global Black Tea Extracts Market Volume K Tons Forecast, by Type 2019 & 2032
- Table 71: Global Black Tea Extracts Market Revenue Million Forecast, by Application 2019 & 2032
- Table 72: Global Black Tea Extracts Market Volume K Tons Forecast, by Application 2019 & 2032
- Table 73: Global Black Tea Extracts Market Revenue Million Forecast, by Country 2019 & 2032
- Table 74: Global Black Tea Extracts Market Volume K Tons Forecast, by Country 2019 & 2032
- Table 75: United States Black Tea Extracts Market Revenue (Million) Forecast, by Application 2019 & 2032
- Table 76: United States Black Tea Extracts Market Volume (K Tons) Forecast, by Application 2019 & 2032
- Table 77: Canada Black Tea Extracts Market Revenue (Million) Forecast, by Application 2019 & 2032
- Table 78: Canada Black Tea Extracts Market Volume (K Tons) Forecast, by Application 2019 & 2032
- Table 79: Mexico Black Tea Extracts Market Revenue (Million) Forecast, by Application 2019 & 2032
- Table 80: Mexico Black Tea Extracts Market Volume (K Tons) Forecast, by Application 2019 & 2032
- Table 81: Rest of North America Black Tea Extracts Market Revenue (Million) Forecast, by Application 2019 & 2032
- Table 82: Rest of North America Black Tea Extracts Market Volume (K Tons) Forecast, by Application 2019 & 2032
- Table 83: Global Black Tea Extracts Market Revenue Million Forecast, by Form 2019 & 2032
- Table 84: Global Black Tea Extracts Market Volume K Tons Forecast, by Form 2019 & 2032
- Table 85: Global Black Tea Extracts Market Revenue Million Forecast, by Type 2019 & 2032
- Table 86: Global Black Tea Extracts Market Volume K Tons Forecast, by Type 2019 & 2032
- Table 87: Global Black Tea Extracts Market Revenue Million Forecast, by Application 2019 & 2032
- Table 88: Global Black Tea Extracts Market Volume K Tons Forecast, by Application 2019 & 2032
- Table 89: Global Black Tea Extracts Market Revenue Million Forecast, by Country 2019 & 2032
- Table 90: Global Black Tea Extracts Market Volume K Tons Forecast, by Country 2019 & 2032
- Table 91: United Kingdom Black Tea Extracts Market Revenue (Million) Forecast, by Application 2019 & 2032
- Table 92: United Kingdom Black Tea Extracts Market Volume (K Tons) Forecast, by Application 2019 & 2032
- Table 93: Germany Black Tea Extracts Market Revenue (Million) Forecast, by Application 2019 & 2032
- Table 94: Germany Black Tea Extracts Market Volume (K Tons) Forecast, by Application 2019 & 2032
- Table 95: France Black Tea Extracts Market Revenue (Million) Forecast, by Application 2019 & 2032
- Table 96: France Black Tea Extracts Market Volume (K Tons) Forecast, by Application 2019 & 2032
- Table 97: Russia Black Tea Extracts Market Revenue (Million) Forecast, by Application 2019 & 2032
- Table 98: Russia Black Tea Extracts Market Volume (K Tons) Forecast, by Application 2019 & 2032
- Table 99: Italy Black Tea Extracts Market Revenue (Million) Forecast, by Application 2019 & 2032
- Table 100: Italy Black Tea Extracts Market Volume (K Tons) Forecast, by Application 2019 & 2032
- Table 101: Spain Black Tea Extracts Market Revenue (Million) Forecast, by Application 2019 & 2032
- Table 102: Spain Black Tea Extracts Market Volume (K Tons) Forecast, by Application 2019 & 2032
- Table 103: Rest of Europe Black Tea Extracts Market Revenue (Million) Forecast, by Application 2019 & 2032
- Table 104: Rest of Europe Black Tea Extracts Market Volume (K Tons) Forecast, by Application 2019 & 2032
- Table 105: Global Black Tea Extracts Market Revenue Million Forecast, by Form 2019 & 2032
- Table 106: Global Black Tea Extracts Market Volume K Tons Forecast, by Form 2019 & 2032
- Table 107: Global Black Tea Extracts Market Revenue Million Forecast, by Type 2019 & 2032
- Table 108: Global Black Tea Extracts Market Volume K Tons Forecast, by Type 2019 & 2032
- Table 109: Global Black Tea Extracts Market Revenue Million Forecast, by Application 2019 & 2032
- Table 110: Global Black Tea Extracts Market Volume K Tons Forecast, by Application 2019 & 2032
- Table 111: Global Black Tea Extracts Market Revenue Million Forecast, by Country 2019 & 2032
- Table 112: Global Black Tea Extracts Market Volume K Tons Forecast, by Country 2019 & 2032
- Table 113: India Black Tea Extracts Market Revenue (Million) Forecast, by Application 2019 & 2032
- Table 114: India Black Tea Extracts Market Volume (K Tons) Forecast, by Application 2019 & 2032
- Table 115: China Black Tea Extracts Market Revenue (Million) Forecast, by Application 2019 & 2032
- Table 116: China Black Tea Extracts Market Volume (K Tons) Forecast, by Application 2019 & 2032
- Table 117: Japan Black Tea Extracts Market Revenue (Million) Forecast, by Application 2019 & 2032
- Table 118: Japan Black Tea Extracts Market Volume (K Tons) Forecast, by Application 2019 & 2032
- Table 119: Australia Black Tea Extracts Market Revenue (Million) Forecast, by Application 2019 & 2032
- Table 120: Australia Black Tea Extracts Market Volume (K Tons) Forecast, by Application 2019 & 2032
- Table 121: Rest of Asia Pacific Black Tea Extracts Market Revenue (Million) Forecast, by Application 2019 & 2032
- Table 122: Rest of Asia Pacific Black Tea Extracts Market Volume (K Tons) Forecast, by Application 2019 & 2032
- Table 123: Global Black Tea Extracts Market Revenue Million Forecast, by Form 2019 & 2032
- Table 124: Global Black Tea Extracts Market Volume K Tons Forecast, by Form 2019 & 2032
- Table 125: Global Black Tea Extracts Market Revenue Million Forecast, by Type 2019 & 2032
- Table 126: Global Black Tea Extracts Market Volume K Tons Forecast, by Type 2019 & 2032
- Table 127: Global Black Tea Extracts Market Revenue Million Forecast, by Application 2019 & 2032
- Table 128: Global Black Tea Extracts Market Volume K Tons Forecast, by Application 2019 & 2032
- Table 129: Global Black Tea Extracts Market Revenue Million Forecast, by Country 2019 & 2032
- Table 130: Global Black Tea Extracts Market Volume K Tons Forecast, by Country 2019 & 2032
- Table 131: Brazil Black Tea Extracts Market Revenue (Million) Forecast, by Application 2019 & 2032
- Table 132: Brazil Black Tea Extracts Market Volume (K Tons) Forecast, by Application 2019 & 2032
- Table 133: Argentina Black Tea Extracts Market Revenue (Million) Forecast, by Application 2019 & 2032
- Table 134: Argentina Black Tea Extracts Market Volume (K Tons) Forecast, by Application 2019 & 2032
- Table 135: Rest of South America Black Tea Extracts Market Revenue (Million) Forecast, by Application 2019 & 2032
- Table 136: Rest of South America Black Tea Extracts Market Volume (K Tons) Forecast, by Application 2019 & 2032
- Table 137: Global Black Tea Extracts Market Revenue Million Forecast, by Form 2019 & 2032
- Table 138: Global Black Tea Extracts Market Volume K Tons Forecast, by Form 2019 & 2032
- Table 139: Global Black Tea Extracts Market Revenue Million Forecast, by Type 2019 & 2032
- Table 140: Global Black Tea Extracts Market Volume K Tons Forecast, by Type 2019 & 2032
- Table 141: Global Black Tea Extracts Market Revenue Million Forecast, by Application 2019 & 2032
- Table 142: Global Black Tea Extracts Market Volume K Tons Forecast, by Application 2019 & 2032
- Table 143: Global Black Tea Extracts Market Revenue Million Forecast, by Country 2019 & 2032
- Table 144: Global Black Tea Extracts Market Volume K Tons Forecast, by Country 2019 & 2032
- Table 145: Global Black Tea Extracts Market Revenue Million Forecast, by Form 2019 & 2032
- Table 146: Global Black Tea Extracts Market Volume K Tons Forecast, by Form 2019 & 2032
- Table 147: Global Black Tea Extracts Market Revenue Million Forecast, by Type 2019 & 2032
- Table 148: Global Black Tea Extracts Market Volume K Tons Forecast, by Type 2019 & 2032
- Table 149: Global Black Tea Extracts Market Revenue Million Forecast, by Application 2019 & 2032
- Table 150: Global Black Tea Extracts Market Volume K Tons Forecast, by Application 2019 & 2032
- Table 151: Global Black Tea Extracts Market Revenue Million Forecast, by Country 2019 & 2032
- Table 152: Global Black Tea Extracts Market Volume K Tons Forecast, by Country 2019 & 2032
- Table 153: Saudi Arabia Black Tea Extracts Market Revenue (Million) Forecast, by Application 2019 & 2032
- Table 154: Saudi Arabia Black Tea Extracts Market Volume (K Tons) Forecast, by Application 2019 & 2032
- Table 155: Rest of Middle East Black Tea Extracts Market Revenue (Million) Forecast, by Application 2019 & 2032
- Table 156: Rest of Middle East Black Tea Extracts Market Volume (K Tons) Forecast, by Application 2019 & 2032
Frequently Asked Questions
1. What is the projected Compound Annual Growth Rate (CAGR) of the Black Tea Extracts Market?
The projected CAGR is approximately 4.50%.
2. Which companies are prominent players in the Black Tea Extracts Market?
Key companies in the market include Phyto Life Sciences P Ltd, Blueberry Agro Products Pvt Ltd *List Not Exhaustive, AVT Naturals, Martin Bauer Group, James Finlay Limited, Amax NutraSource Inc, Synthite Industries, Teawolf LLC, Cymbio Pharma Pvt Ltd.
3. What are the main segments of the Black Tea Extracts Market?
The market segments include Form, Type, Application.
4. Can you provide details about the market size?
The market size is estimated to be USD XX Million as of 2022.
5. What are some drivers contributing to market growth?
Awareness Of Health Benefits Of Oleoresins; Rise Of Clean Label Products.
6. What are the notable trends driving market growth?
Growing Demand for Functional Food.
7. Are there any restraints impacting market growth?
Supply Chain Volatility and Availability Of Other Flavor Ingredients.
8. Can you provide examples of recent developments in the market?
N/A
9. What pricing options are available for accessing the report?
Pricing options include single-user, multi-user, and enterprise licenses priced at USD 4750, USD 5250, and USD 8750 respectively.
10. Is the market size provided in terms of value or volume?
The market size is provided in terms of value, measured in Million and volume, measured in K Tons.
11. Are there any specific market keywords associated with the report?
Yes, the market keyword associated with the report is "Black Tea Extracts Market," which aids in identifying and referencing the specific market segment covered.
12. How do I determine which pricing option suits my needs best?
The pricing options vary based on user requirements and access needs. Individual users may opt for single-user licenses, while businesses requiring broader access may choose multi-user or enterprise licenses for cost-effective access to the report.
13. Are there any additional resources or data provided in the Black Tea Extracts Market report?
While the report offers comprehensive insights, it's advisable to review the specific contents or supplementary materials provided to ascertain if additional resources or data are available.
14. How can I stay updated on further developments or reports in the Black Tea Extracts Market?
To stay informed about further developments, trends, and reports in the Black Tea Extracts Market, consider subscribing to industry newsletters, following relevant companies and organizations, or regularly checking reputable industry news sources and publications.
Methodology
Step 1 - Identification of Relevant Samples Size from Population Database


Step 2 - Approaches for Defining Global Market Size (Value, Volume* & Price*)

Note*: In applicable scenarios
Step 3 - Data Sources
Primary Research
- Web Analytics
- Survey Reports
- Research Institute
- Latest Research Reports
- Opinion Leaders
Secondary Research
- Annual Reports
- White Paper
- Latest Press Release
- Industry Association
- Paid Database
- Investor Presentations

Step 4 - Data Triangulation
Involves using different sources of information in order to increase the validity of a study
These sources are likely to be stakeholders in a program - participants, other researchers, program staff, other community members, and so on.
Then we put all data in single framework & apply various statistical tools to find out the dynamic on the market.
During the analysis stage, feedback from the stakeholder groups would be compared to determine areas of agreement as well as areas of divergence


