

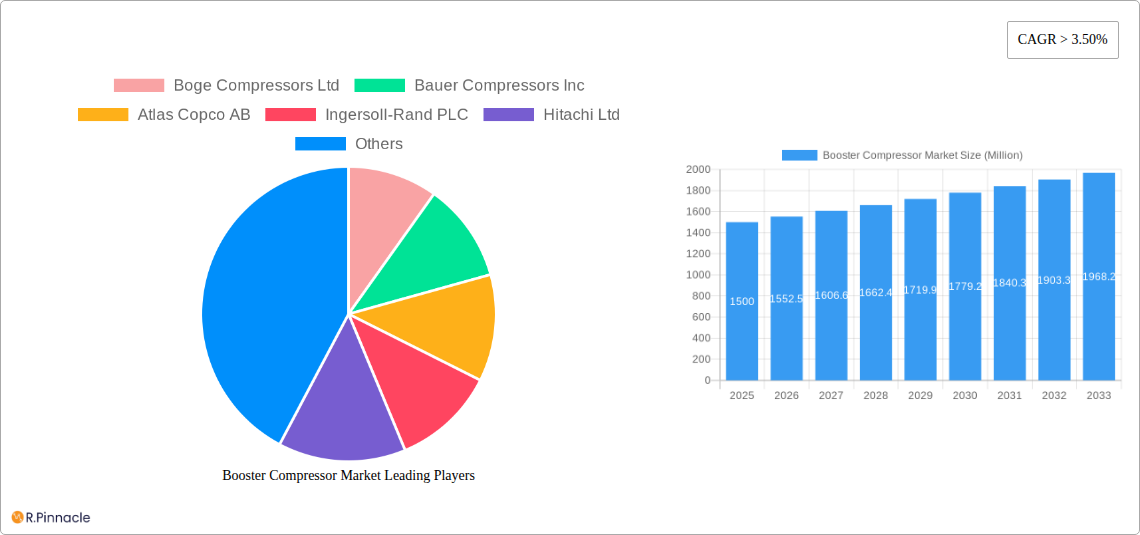
Key Insights
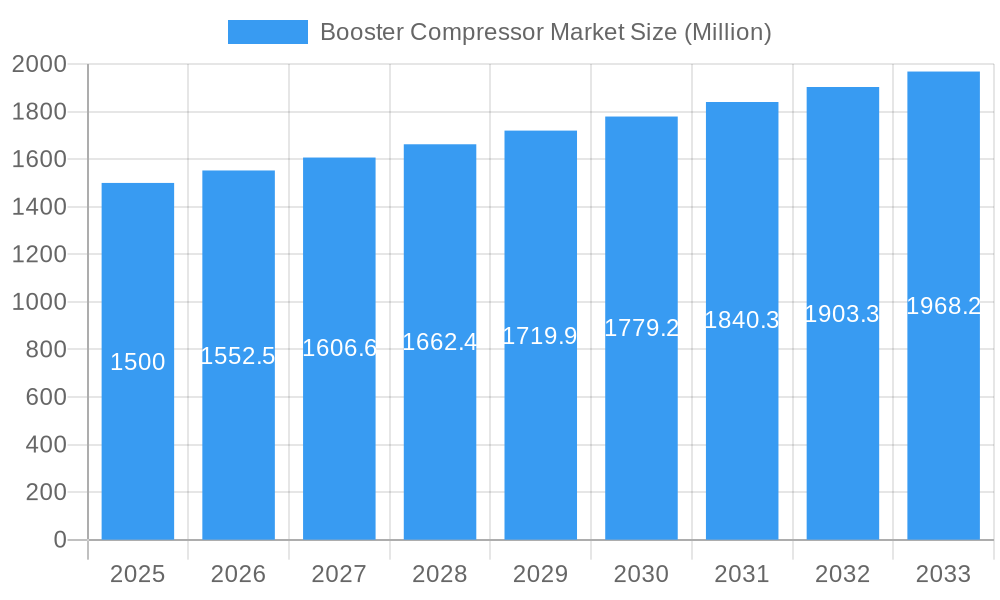
The global booster compressor market is poised for significant expansion, driven by escalating demand across key industrial sectors. With an estimated market size of $3.92 billion in the base year 2025, the market is projected to grow at a robust compound annual growth rate (CAGR) of 4.8% from 2025 to 2033. This growth is primarily attributed to the oil and gas industry's reliance on booster compressors for optimizing pipeline operations and processing. The chemical sector's increasing requirement for high-pressure gas compression is another major growth driver. Technological advancements, including the development of more energy-efficient air-cooled and water-cooled compressors, are further accelerating adoption. Additionally, the expanding power generation sector, particularly in rapidly industrializing developing economies, contributes to market momentum.
Booster Compressor Market Market Size (In Billion)
Market expansion is subject to certain constraints, including volatility in raw material prices and the growing complexity of regulatory compliance. Intense competition among leading manufacturers such as Atlas Copco, Ingersoll-Rand, and Kaeser Compressors also influences profit margins. Despite these challenges, the long-term market outlook is positive, with substantial growth opportunities anticipated in the Asia-Pacific region, fueled by infrastructure development and industrial expansion in China and India. Market segmentation by cooling type (air-cooled, water-cooled) and end-user (oil and gas, chemical, power generation, others) provides detailed insights into specific dynamics and growth prospects across North America, Europe, Asia-Pacific, South America, and the Middle East & Africa.
Booster Compressor Market Company Market Share
Booster Compressor Market Report: 2019-2033 Forecast
This comprehensive report provides a detailed analysis of the global Booster Compressor Market, offering invaluable insights for industry professionals, investors, and strategic decision-makers. Covering the period from 2019 to 2033, with a focus on 2025, this report unveils the market's structure, dynamics, dominant segments, and future outlook. The report leverages extensive data and expert analysis to provide actionable intelligence and growth opportunities within the booster compressor landscape.
Booster Compressor Market Structure & Innovation Trends
This section analyzes the competitive landscape, innovation drivers, regulatory influences, and market dynamics within the booster compressor industry. The study period (2019-2033) allows for a thorough understanding of historical trends and future projections.
- Market Concentration: The market exhibits a [xx]% concentration ratio, with [xx] major players holding a significant market share. This concentration is influenced by [mention factors impacting concentration, e.g., economies of scale, technological barriers].
- Innovation Drivers: Key innovation drivers include advancements in compressor design (e.g., higher efficiency, reduced emissions), the integration of smart technologies (e.g., predictive maintenance, remote monitoring), and the increasing demand for energy-efficient solutions.
- Regulatory Frameworks: Government regulations concerning emissions and energy efficiency significantly shape the market, driving the adoption of more environmentally friendly technologies.
- Product Substitutes: While direct substitutes are limited, [mention potential substitute technologies and their impact on market share].
- End-User Demographics: The primary end-users include Oil and Gas, Chemical, Power Generation, and Other End Users. [Discuss the market share breakdown across these end-user segments].
- M&A Activities: The market has witnessed [xx] significant M&A activities during the historical period (2019-2024), with a total deal value of approximately $xx Million. These mergers and acquisitions reflect the consolidation efforts within the industry and the pursuit of synergy and market expansion. Examples include [mention specific M&A deals, if available, and their impact].
Booster Compressor Market Dynamics & Trends
This section delves into the factors driving market growth, technological disruptions, and competitive dynamics within the booster compressor market. The report utilizes a 600-word analysis to provide a comprehensive overview, including key metrics such as CAGR and market penetration. The study period of 2019-2033 provides a historical and future perspective on market trends.
[Insert 600-word analysis of market growth drivers, technological disruptions, consumer preferences, and competitive dynamics, incorporating CAGR and market penetration data. For example, discuss the impact of increasing demand for natural gas, the adoption of renewable energy sources, or advancements in compressor technology.]
Dominant Regions & Segments in Booster Compressor Market
This section identifies the leading regions and segments within the booster compressor market, providing a detailed analysis of their dominance.
Leading Regions: [Identify the leading region and provide detailed analysis. For example, discuss regional growth drivers such as economic development, industrial expansion, and government policies.]
Leading Segments:
- Cooling Type: [Analyze market share and growth projections for Air-cooled and Water-cooled compressors. Explain which segment is dominant and why.]
- End User: [Analyze market share and growth projections for Oil and Gas, Chemical, Power Generation, and Other End Users. Highlight the dominant segment and the reasons behind its success. For example, the oil and gas sector's dominance may be attributed to extensive pipeline networks and rising energy demands.]
[Insert detailed analysis explaining the dominance of the key regions and segments using bullet points for drivers and paragraphs for analysis]
Booster Compressor Market Product Innovations
Recent product developments focus on enhancing efficiency, reliability, and reducing environmental impact. New designs emphasize energy savings, quieter operation, and integration of smart technologies for predictive maintenance. These innovations are directly addressing market demands for sustainable and cost-effective solutions, improving the market fit and gaining competitive advantages.
Report Scope & Segmentation Analysis
This report segments the booster compressor market based on cooling type (Air-cooled, Water-cooled) and end-user (Oil and Gas, Chemical, Power Generation, Other End Users). Each segment's growth projection, market size, and competitive dynamics are analyzed individually, providing granular insights into the market's structure and dynamics.
Key Drivers of Booster Compressor Market Growth
Growth in the booster compressor market is driven by several factors, including increasing demand from the Oil & Gas sector for pipeline infrastructure development, growth in the chemical industry, and the rising adoption of compressed natural gas (CNG) in transportation and power generation. Further, government regulations promoting energy efficiency and reduced emissions are propelling the adoption of advanced compressor technologies.
Challenges in the Booster Compressor Market Sector
Challenges include fluctuating raw material prices, intense competition among manufacturers, and stringent environmental regulations. Supply chain disruptions, particularly related to crucial components, can also impact production and timelines. The overall impact of these challenges on market growth needs to be carefully assessed for strategic planning.
Emerging Opportunities in Booster Compressor Market
Emerging opportunities lie in expanding into new geographic markets, particularly in developing economies with growing industrial sectors. The development of innovative compressor designs with enhanced energy efficiency and reduced emissions offers significant growth potential. Furthermore, the increasing adoption of digital technologies like IoT and predictive maintenance presents new avenues for revenue generation and improved customer service.
Leading Players in the Booster Compressor Market Market
- Boge Compressors Ltd
- Bauer Compressors Inc
- Atlas Copco AB
- Ingersoll-Rand PLC
- Hitachi Ltd
- Aircomp Enterprises
- Gardner Denver Inc
- Kaeser Compressors Inc
- IDEX India Private Ltd
- General Electric Company
Key Developments in Booster Compressor Market Industry
- July 2021: Pakistan and Russia agreed to construct a 1,100-km gas pipeline, boosting demand for booster compressors.
- 2021: HPOil Gas Private Limited issued a tender for 400SCMH booster compressors for a city gas distribution project in Kolhapur, India.
Future Outlook for Booster Compressor Market Market
The booster compressor market is poised for significant growth, driven by expanding industrial sectors, rising energy demands, and increasing investments in infrastructure projects globally. The adoption of advanced technologies, coupled with favorable regulatory policies, will further fuel market expansion in the coming years. Strategic partnerships and collaborations are expected to play a key role in driving market consolidation and shaping future innovation within the sector.
Booster Compressor Market Segmentation
-
1. Cooling Type
- 1.1. Air-cooled
- 1.2. Water-cooled
-
2. End User
- 2.1. Oil and Gas
- 2.2. Chemical
- 2.3. Power Generation
- 2.4. Other End Users
Booster Compressor Market Segmentation By Geography
- 1. North America
- 2. Europe
- 3. Asia Pacific
- 4. South America
- 5. Middle East and Africa
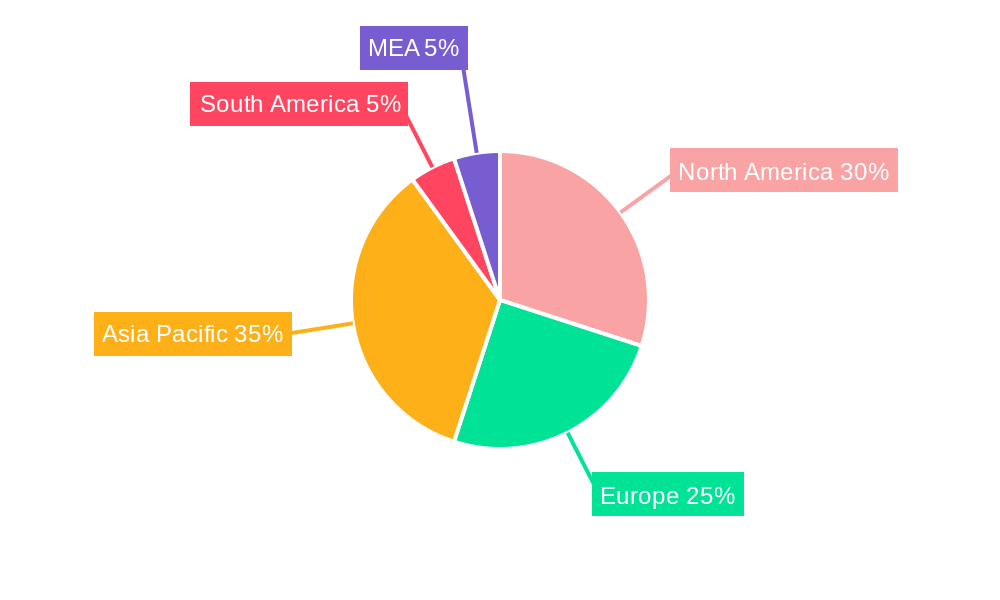
Booster Compressor Market Regional Market Share
Geographic Coverage of Booster Compressor Market
Booster Compressor Market REPORT HIGHLIGHTS
| Aspects | Details |
|---|---|
| Study Period | 2020-2034 |
| Base Year | 2025 |
| Estimated Year | 2026 |
| Forecast Period | 2026-2034 |
| Historical Period | 2020-2025 |
| Growth Rate | CAGR of 4.8% from 2020-2034 |
| Segmentation |
|
Table of Contents
- 1. Introduction
- 1.1. Research Scope
- 1.2. Market Segmentation
- 1.3. Research Objective
- 1.4. Definitions and Assumptions
- 2. Executive Summary
- 2.1. Market Snapshot
- 3. Market Dynamics
- 3.1. Market Drivers
- 3.2. Market Restrains
- 3.3. Market Trends
- 3.4. Market Opportunities
- 4. Market Factor Analysis
- 4.1. Porters Five Forces
- 4.1.1. Bargaining Power of Suppliers
- 4.1.2. Bargaining Power of Buyers
- 4.1.3. Threat of New Entrants
- 4.1.4. Threat of Substitutes
- 4.1.5. Competitive Rivalry
- 4.2. PESTEL analysis
- 4.3. BCG Analysis
- 4.3.1. Stars (High Growth, High Market Share)
- 4.3.2. Cash Cows (Low Growth, High Market Share)
- 4.3.3. Question Mark (High Growth, Low Market Share)
- 4.3.4. Dogs (Low Growth, Low Market Share)
- 4.4. Ansoff Matrix Analysis
- 4.5. Supply Chain Analysis
- 4.6. Regulatory Landscape
- 4.7. Current Market Potential and Opportunity Assessment (TAM–SAM–SOM Framework)
- 4.8. PRI Analyst Note
- 4.1. Porters Five Forces
- 5. Market Analysis, Insights and Forecast 2021-2033
- 5.1. Market Analysis, Insights and Forecast - by Cooling Type
- 5.1.1. Air-cooled
- 5.1.2. Water-cooled
- 5.2. Market Analysis, Insights and Forecast - by End User
- 5.2.1. Oil and Gas
- 5.2.2. Chemical
- 5.2.3. Power Generation
- 5.2.4. Other End Users
- 5.3. Market Analysis, Insights and Forecast - by Region
- 5.3.1. North America
- 5.3.2. Europe
- 5.3.3. Asia Pacific
- 5.3.4. South America
- 5.3.5. Middle East and Africa
- 5.1. Market Analysis, Insights and Forecast - by Cooling Type
- 6. Global Booster Compressor Market Analysis, Insights and Forecast, 2021-2033
- 6.1. Market Analysis, Insights and Forecast - by Cooling Type
- 6.1.1. Air-cooled
- 6.1.2. Water-cooled
- 6.2. Market Analysis, Insights and Forecast - by End User
- 6.2.1. Oil and Gas
- 6.2.2. Chemical
- 6.2.3. Power Generation
- 6.2.4. Other End Users
- 6.1. Market Analysis, Insights and Forecast - by Cooling Type
- 7. North America Booster Compressor Market Analysis, Insights and Forecast, 2020-2032
- 7.1. Market Analysis, Insights and Forecast - by Cooling Type
- 7.1.1. Air-cooled
- 7.1.2. Water-cooled
- 7.2. Market Analysis, Insights and Forecast - by End User
- 7.2.1. Oil and Gas
- 7.2.2. Chemical
- 7.2.3. Power Generation
- 7.2.4. Other End Users
- 7.1. Market Analysis, Insights and Forecast - by Cooling Type
- 8. Europe Booster Compressor Market Analysis, Insights and Forecast, 2020-2032
- 8.1. Market Analysis, Insights and Forecast - by Cooling Type
- 8.1.1. Air-cooled
- 8.1.2. Water-cooled
- 8.2. Market Analysis, Insights and Forecast - by End User
- 8.2.1. Oil and Gas
- 8.2.2. Chemical
- 8.2.3. Power Generation
- 8.2.4. Other End Users
- 8.1. Market Analysis, Insights and Forecast - by Cooling Type
- 9. Asia Pacific Booster Compressor Market Analysis, Insights and Forecast, 2020-2032
- 9.1. Market Analysis, Insights and Forecast - by Cooling Type
- 9.1.1. Air-cooled
- 9.1.2. Water-cooled
- 9.2. Market Analysis, Insights and Forecast - by End User
- 9.2.1. Oil and Gas
- 9.2.2. Chemical
- 9.2.3. Power Generation
- 9.2.4. Other End Users
- 9.1. Market Analysis, Insights and Forecast - by Cooling Type
- 10. South America Booster Compressor Market Analysis, Insights and Forecast, 2020-2032
- 10.1. Market Analysis, Insights and Forecast - by Cooling Type
- 10.1.1. Air-cooled
- 10.1.2. Water-cooled
- 10.2. Market Analysis, Insights and Forecast - by End User
- 10.2.1. Oil and Gas
- 10.2.2. Chemical
- 10.2.3. Power Generation
- 10.2.4. Other End Users
- 10.1. Market Analysis, Insights and Forecast - by Cooling Type
- 11. Middle East and Africa Booster Compressor Market Analysis, Insights and Forecast, 2020-2032
- 11.1. Market Analysis, Insights and Forecast - by Cooling Type
- 11.1.1. Air-cooled
- 11.1.2. Water-cooled
- 11.2. Market Analysis, Insights and Forecast - by End User
- 11.2.1. Oil and Gas
- 11.2.2. Chemical
- 11.2.3. Power Generation
- 11.2.4. Other End Users
- 11.1. Market Analysis, Insights and Forecast - by Cooling Type
- 12. Competitive Analysis
- 12.1. Company Profiles
- 12.1.1 Boge Compressors Ltd
- 12.1.1.1. Company Overview
- 12.1.1.2. Products
- 12.1.1.3. Company Financials
- 12.1.1.4. SWOT Analysis
- 12.1.2 Bauer Compressors Inc
- 12.1.2.1. Company Overview
- 12.1.2.2. Products
- 12.1.2.3. Company Financials
- 12.1.2.4. SWOT Analysis
- 12.1.3 Atlas Copco AB
- 12.1.3.1. Company Overview
- 12.1.3.2. Products
- 12.1.3.3. Company Financials
- 12.1.3.4. SWOT Analysis
- 12.1.4 Ingersoll-Rand PLC
- 12.1.4.1. Company Overview
- 12.1.4.2. Products
- 12.1.4.3. Company Financials
- 12.1.4.4. SWOT Analysis
- 12.1.5 Hitachi Ltd
- 12.1.5.1. Company Overview
- 12.1.5.2. Products
- 12.1.5.3. Company Financials
- 12.1.5.4. SWOT Analysis
- 12.1.6 Aircomp Enterprises*List Not Exhaustive
- 12.1.6.1. Company Overview
- 12.1.6.2. Products
- 12.1.6.3. Company Financials
- 12.1.6.4. SWOT Analysis
- 12.1.7 Gardner Denver Inc
- 12.1.7.1. Company Overview
- 12.1.7.2. Products
- 12.1.7.3. Company Financials
- 12.1.7.4. SWOT Analysis
- 12.1.8 Kaeser Compressors Inc
- 12.1.8.1. Company Overview
- 12.1.8.2. Products
- 12.1.8.3. Company Financials
- 12.1.8.4. SWOT Analysis
- 12.1.9 IDEX India Private Ltd
- 12.1.9.1. Company Overview
- 12.1.9.2. Products
- 12.1.9.3. Company Financials
- 12.1.9.4. SWOT Analysis
- 12.1.10 General Electric Company
- 12.1.10.1. Company Overview
- 12.1.10.2. Products
- 12.1.10.3. Company Financials
- 12.1.10.4. SWOT Analysis
- 12.1.1 Boge Compressors Ltd
- 12.2. Market Entropy
- 12.2.1 Company's Key Areas Served
- 12.2.2 Recent Developments
- 12.3. Company Market Share Analysis 2025
- 12.3.1 Top 5 Companies Market Share Analysis
- 12.3.2 Top 3 Companies Market Share Analysis
- 12.4. List of Potential Customers
- 13. Research Methodology
List of Figures
- Figure 1: Global Booster Compressor Market Revenue Breakdown (undefined, %) by Region 2025 & 2033
- Figure 2: Global Booster Compressor Market Volume Breakdown (K Unit, %) by Region 2025 & 2033
- Figure 3: North America Booster Compressor Market Revenue (undefined), by Cooling Type 2025 & 2033
- Figure 4: North America Booster Compressor Market Volume (K Unit), by Cooling Type 2025 & 2033
- Figure 5: North America Booster Compressor Market Revenue Share (%), by Cooling Type 2025 & 2033
- Figure 6: North America Booster Compressor Market Volume Share (%), by Cooling Type 2025 & 2033
- Figure 7: North America Booster Compressor Market Revenue (undefined), by End User 2025 & 2033
- Figure 8: North America Booster Compressor Market Volume (K Unit), by End User 2025 & 2033
- Figure 9: North America Booster Compressor Market Revenue Share (%), by End User 2025 & 2033
- Figure 10: North America Booster Compressor Market Volume Share (%), by End User 2025 & 2033
- Figure 11: North America Booster Compressor Market Revenue (undefined), by Country 2025 & 2033
- Figure 12: North America Booster Compressor Market Volume (K Unit), by Country 2025 & 2033
- Figure 13: North America Booster Compressor Market Revenue Share (%), by Country 2025 & 2033
- Figure 14: North America Booster Compressor Market Volume Share (%), by Country 2025 & 2033
- Figure 15: Europe Booster Compressor Market Revenue (undefined), by Cooling Type 2025 & 2033
- Figure 16: Europe Booster Compressor Market Volume (K Unit), by Cooling Type 2025 & 2033
- Figure 17: Europe Booster Compressor Market Revenue Share (%), by Cooling Type 2025 & 2033
- Figure 18: Europe Booster Compressor Market Volume Share (%), by Cooling Type 2025 & 2033
- Figure 19: Europe Booster Compressor Market Revenue (undefined), by End User 2025 & 2033
- Figure 20: Europe Booster Compressor Market Volume (K Unit), by End User 2025 & 2033
- Figure 21: Europe Booster Compressor Market Revenue Share (%), by End User 2025 & 2033
- Figure 22: Europe Booster Compressor Market Volume Share (%), by End User 2025 & 2033
- Figure 23: Europe Booster Compressor Market Revenue (undefined), by Country 2025 & 2033
- Figure 24: Europe Booster Compressor Market Volume (K Unit), by Country 2025 & 2033
- Figure 25: Europe Booster Compressor Market Revenue Share (%), by Country 2025 & 2033
- Figure 26: Europe Booster Compressor Market Volume Share (%), by Country 2025 & 2033
- Figure 27: Asia Pacific Booster Compressor Market Revenue (undefined), by Cooling Type 2025 & 2033
- Figure 28: Asia Pacific Booster Compressor Market Volume (K Unit), by Cooling Type 2025 & 2033
- Figure 29: Asia Pacific Booster Compressor Market Revenue Share (%), by Cooling Type 2025 & 2033
- Figure 30: Asia Pacific Booster Compressor Market Volume Share (%), by Cooling Type 2025 & 2033
- Figure 31: Asia Pacific Booster Compressor Market Revenue (undefined), by End User 2025 & 2033
- Figure 32: Asia Pacific Booster Compressor Market Volume (K Unit), by End User 2025 & 2033
- Figure 33: Asia Pacific Booster Compressor Market Revenue Share (%), by End User 2025 & 2033
- Figure 34: Asia Pacific Booster Compressor Market Volume Share (%), by End User 2025 & 2033
- Figure 35: Asia Pacific Booster Compressor Market Revenue (undefined), by Country 2025 & 2033
- Figure 36: Asia Pacific Booster Compressor Market Volume (K Unit), by Country 2025 & 2033
- Figure 37: Asia Pacific Booster Compressor Market Revenue Share (%), by Country 2025 & 2033
- Figure 38: Asia Pacific Booster Compressor Market Volume Share (%), by Country 2025 & 2033
- Figure 39: South America Booster Compressor Market Revenue (undefined), by Cooling Type 2025 & 2033
- Figure 40: South America Booster Compressor Market Volume (K Unit), by Cooling Type 2025 & 2033
- Figure 41: South America Booster Compressor Market Revenue Share (%), by Cooling Type 2025 & 2033
- Figure 42: South America Booster Compressor Market Volume Share (%), by Cooling Type 2025 & 2033
- Figure 43: South America Booster Compressor Market Revenue (undefined), by End User 2025 & 2033
- Figure 44: South America Booster Compressor Market Volume (K Unit), by End User 2025 & 2033
- Figure 45: South America Booster Compressor Market Revenue Share (%), by End User 2025 & 2033
- Figure 46: South America Booster Compressor Market Volume Share (%), by End User 2025 & 2033
- Figure 47: South America Booster Compressor Market Revenue (undefined), by Country 2025 & 2033
- Figure 48: South America Booster Compressor Market Volume (K Unit), by Country 2025 & 2033
- Figure 49: South America Booster Compressor Market Revenue Share (%), by Country 2025 & 2033
- Figure 50: South America Booster Compressor Market Volume Share (%), by Country 2025 & 2033
- Figure 51: Middle East and Africa Booster Compressor Market Revenue (undefined), by Cooling Type 2025 & 2033
- Figure 52: Middle East and Africa Booster Compressor Market Volume (K Unit), by Cooling Type 2025 & 2033
- Figure 53: Middle East and Africa Booster Compressor Market Revenue Share (%), by Cooling Type 2025 & 2033
- Figure 54: Middle East and Africa Booster Compressor Market Volume Share (%), by Cooling Type 2025 & 2033
- Figure 55: Middle East and Africa Booster Compressor Market Revenue (undefined), by End User 2025 & 2033
- Figure 56: Middle East and Africa Booster Compressor Market Volume (K Unit), by End User 2025 & 2033
- Figure 57: Middle East and Africa Booster Compressor Market Revenue Share (%), by End User 2025 & 2033
- Figure 58: Middle East and Africa Booster Compressor Market Volume Share (%), by End User 2025 & 2033
- Figure 59: Middle East and Africa Booster Compressor Market Revenue (undefined), by Country 2025 & 2033
- Figure 60: Middle East and Africa Booster Compressor Market Volume (K Unit), by Country 2025 & 2033
- Figure 61: Middle East and Africa Booster Compressor Market Revenue Share (%), by Country 2025 & 2033
- Figure 62: Middle East and Africa Booster Compressor Market Volume Share (%), by Country 2025 & 2033
List of Tables
- Table 1: Global Booster Compressor Market Revenue undefined Forecast, by Cooling Type 2020 & 2033
- Table 2: Global Booster Compressor Market Volume K Unit Forecast, by Cooling Type 2020 & 2033
- Table 3: Global Booster Compressor Market Revenue undefined Forecast, by End User 2020 & 2033
- Table 4: Global Booster Compressor Market Volume K Unit Forecast, by End User 2020 & 2033
- Table 5: Global Booster Compressor Market Revenue undefined Forecast, by Region 2020 & 2033
- Table 6: Global Booster Compressor Market Volume K Unit Forecast, by Region 2020 & 2033
- Table 7: Global Booster Compressor Market Revenue undefined Forecast, by Cooling Type 2020 & 2033
- Table 8: Global Booster Compressor Market Volume K Unit Forecast, by Cooling Type 2020 & 2033
- Table 9: Global Booster Compressor Market Revenue undefined Forecast, by End User 2020 & 2033
- Table 10: Global Booster Compressor Market Volume K Unit Forecast, by End User 2020 & 2033
- Table 11: Global Booster Compressor Market Revenue undefined Forecast, by Country 2020 & 2033
- Table 12: Global Booster Compressor Market Volume K Unit Forecast, by Country 2020 & 2033
- Table 13: Global Booster Compressor Market Revenue undefined Forecast, by Cooling Type 2020 & 2033
- Table 14: Global Booster Compressor Market Volume K Unit Forecast, by Cooling Type 2020 & 2033
- Table 15: Global Booster Compressor Market Revenue undefined Forecast, by End User 2020 & 2033
- Table 16: Global Booster Compressor Market Volume K Unit Forecast, by End User 2020 & 2033
- Table 17: Global Booster Compressor Market Revenue undefined Forecast, by Country 2020 & 2033
- Table 18: Global Booster Compressor Market Volume K Unit Forecast, by Country 2020 & 2033
- Table 19: Global Booster Compressor Market Revenue undefined Forecast, by Cooling Type 2020 & 2033
- Table 20: Global Booster Compressor Market Volume K Unit Forecast, by Cooling Type 2020 & 2033
- Table 21: Global Booster Compressor Market Revenue undefined Forecast, by End User 2020 & 2033
- Table 22: Global Booster Compressor Market Volume K Unit Forecast, by End User 2020 & 2033
- Table 23: Global Booster Compressor Market Revenue undefined Forecast, by Country 2020 & 2033
- Table 24: Global Booster Compressor Market Volume K Unit Forecast, by Country 2020 & 2033
- Table 25: Global Booster Compressor Market Revenue undefined Forecast, by Cooling Type 2020 & 2033
- Table 26: Global Booster Compressor Market Volume K Unit Forecast, by Cooling Type 2020 & 2033
- Table 27: Global Booster Compressor Market Revenue undefined Forecast, by End User 2020 & 2033
- Table 28: Global Booster Compressor Market Volume K Unit Forecast, by End User 2020 & 2033
- Table 29: Global Booster Compressor Market Revenue undefined Forecast, by Country 2020 & 2033
- Table 30: Global Booster Compressor Market Volume K Unit Forecast, by Country 2020 & 2033
- Table 31: Global Booster Compressor Market Revenue undefined Forecast, by Cooling Type 2020 & 2033
- Table 32: Global Booster Compressor Market Volume K Unit Forecast, by Cooling Type 2020 & 2033
- Table 33: Global Booster Compressor Market Revenue undefined Forecast, by End User 2020 & 2033
- Table 34: Global Booster Compressor Market Volume K Unit Forecast, by End User 2020 & 2033
- Table 35: Global Booster Compressor Market Revenue undefined Forecast, by Country 2020 & 2033
- Table 36: Global Booster Compressor Market Volume K Unit Forecast, by Country 2020 & 2033
Frequently Asked Questions
1. What is the projected Compound Annual Growth Rate (CAGR) of the Booster Compressor Market?
The projected CAGR is approximately 4.8%.
2. Which companies are prominent players in the Booster Compressor Market?
Key companies in the market include Boge Compressors Ltd, Bauer Compressors Inc, Atlas Copco AB, Ingersoll-Rand PLC, Hitachi Ltd, Aircomp Enterprises*List Not Exhaustive, Gardner Denver Inc, Kaeser Compressors Inc, IDEX India Private Ltd, General Electric Company.
3. What are the main segments of the Booster Compressor Market?
The market segments include Cooling Type, End User.
4. Can you provide details about the market size?
The market size is estimated to be USD XXX N/A as of 2022.
5. What are some drivers contributing to market growth?
4.; Replacement of Existing Grids and the Expansion of Distribution Networks.
6. What are the notable trends driving market growth?
The Oil and Gas Segment Expected to Dominate the Market.
7. Are there any restraints impacting market growth?
4.; High Installation Costs.
8. Can you provide examples of recent developments in the market?
In 2021, the HPOil Gas Private Limited (HOGPL), the joint venture between HPCL and OIL, issued a tender for the supply and installation of 400SCMH booster compressors for the city gas distribution project of Kolhapur district, Maharashtra, India. The successful bidder will have to provide the services like supply (including transportation, transit insurance, and loading and unloading), installation, commissioning, and field performance test of CNG Booster compressors.
9. What pricing options are available for accessing the report?
Pricing options include single-user, multi-user, and enterprise licenses priced at USD 4750, USD 5250, and USD 8750 respectively.
10. Is the market size provided in terms of value or volume?
The market size is provided in terms of value, measured in N/A and volume, measured in K Unit.
11. Are there any specific market keywords associated with the report?
Yes, the market keyword associated with the report is "Booster Compressor Market," which aids in identifying and referencing the specific market segment covered.
12. How do I determine which pricing option suits my needs best?
The pricing options vary based on user requirements and access needs. Individual users may opt for single-user licenses, while businesses requiring broader access may choose multi-user or enterprise licenses for cost-effective access to the report.
13. Are there any additional resources or data provided in the Booster Compressor Market report?
While the report offers comprehensive insights, it's advisable to review the specific contents or supplementary materials provided to ascertain if additional resources or data are available.
14. How can I stay updated on further developments or reports in the Booster Compressor Market?
To stay informed about further developments, trends, and reports in the Booster Compressor Market, consider subscribing to industry newsletters, following relevant companies and organizations, or regularly checking reputable industry news sources and publications.
Methodology
Step 1 - Identification of Relevant Samples Size from Population Database


Step 2 - Approaches for Defining Global Market Size (Value, Volume* & Price*)

Note*: In applicable scenarios
Step 3 - Data Sources
Primary Research
- Web Analytics
- Survey Reports
- Research Institute
- Latest Research Reports
- Opinion Leaders
Secondary Research
- Annual Reports
- White Paper
- Latest Press Release
- Industry Association
- Paid Database
- Investor Presentations

Step 4 - Data Triangulation
Involves using different sources of information in order to increase the validity of a study
These sources are likely to be stakeholders in a program - participants, other researchers, program staff, other community members, and so on.
Then we put all data in single framework & apply various statistical tools to find out the dynamic on the market.
During the analysis stage, feedback from the stakeholder groups would be compared to determine areas of agreement as well as areas of divergence