
Key Insights
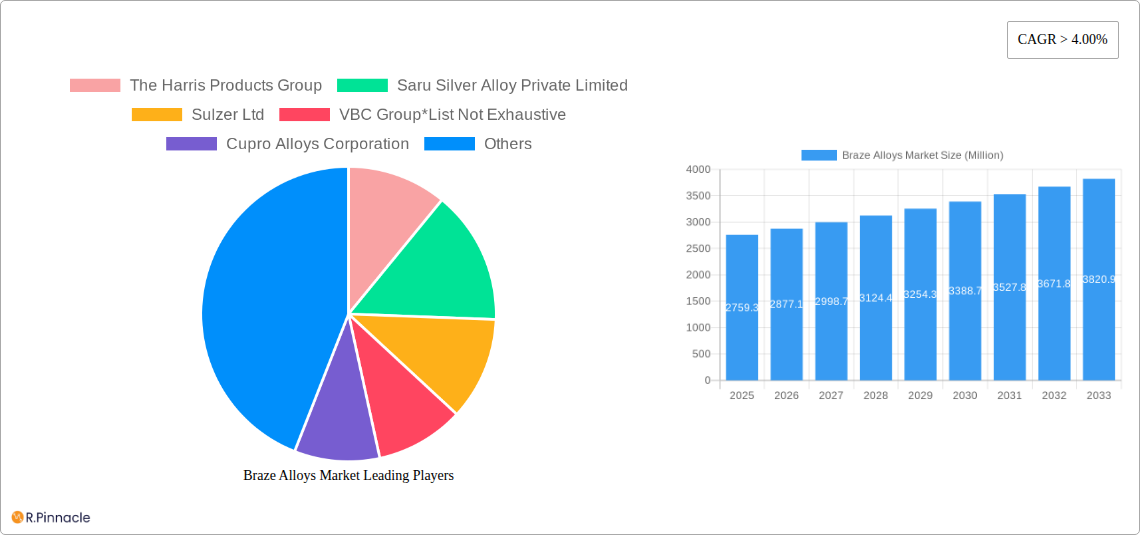
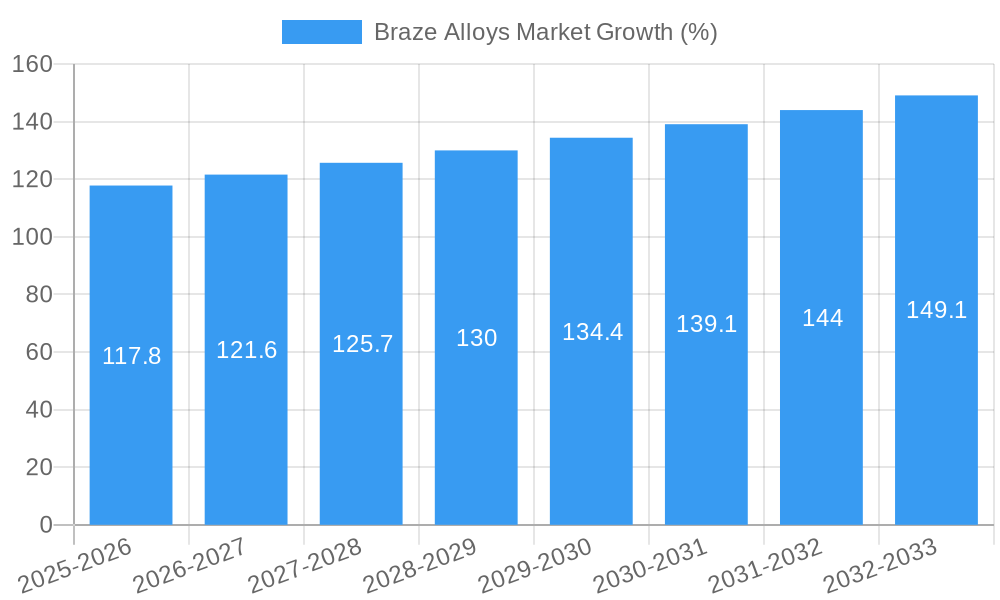
The global braze alloys market, valued at $2759.3 million in 2025, is projected to experience robust growth, driven by a compound annual growth rate (CAGR) exceeding 4.00% from 2025 to 2033. This expansion is fueled by several key factors. The increasing demand for lightweight yet high-strength materials in the automotive and aerospace industries is a significant driver, pushing the adoption of braze alloys for joining dissimilar metals and enhancing component durability. The burgeoning electronics sector, with its need for miniaturized and high-performance devices, further fuels market growth. Advancements in brazing technologies, such as laser brazing and automated brazing systems, are also contributing to improved efficiency and reduced costs, making braze alloys a more attractive option across various applications. The construction industry's increasing use of braze alloys for joining pipes and other structural components further adds to market demand. While challenges such as fluctuating raw material prices and potential environmental concerns related to certain alloy compositions exist, the overall market outlook remains positive, indicating substantial growth potential throughout the forecast period.
Significant regional variations in market share are anticipated. Asia Pacific, particularly China and India, is expected to dominate due to rapid industrialization and substantial manufacturing activity. North America and Europe will maintain significant market presence driven by their established automotive, aerospace, and electronics sectors. However, developing economies in South America and the Middle East and Africa are poised for considerable growth, driven by infrastructure development and industrial expansion. The competitive landscape is characterized by a mix of established multinational corporations and specialized regional players. Continuous innovation in alloy formulations, focused on enhancing specific properties such as strength, thermal conductivity, and corrosion resistance, will be crucial for maintaining a competitive edge in this dynamic market. The market is segmented by base metal (copper, gold, silver, aluminum, and other base metals) and end-user industry (automotive, aerospace and defense, electrical and electronics, construction, and other end-user industries), providing detailed insights into specific application trends and growth patterns.
Braze Alloys Market Report: 2019-2033 Forecast
This comprehensive report provides an in-depth analysis of the global Braze Alloys market, offering actionable insights for industry professionals and investors. Covering the period from 2019 to 2033, with a focus on 2025, this report meticulously examines market dynamics, segmentation, key players, and future growth potential. The market is projected to reach xx Million by 2033.
Braze Alloys Market Structure & Innovation Trends
This section analyzes the competitive landscape of the Braze Alloys market, focusing on market concentration, innovation drivers, and regulatory impacts. The report examines the market share held by key players such as The Harris Products Group, Saru Silver Alloy Private Limited, Sulzer Ltd, VBC Group, Cupro Alloys Corporation, Morgan Advanced Materials, OC Oerlikon Management AG (Oerlikon Metco), Johnson Matthey, Aimtek Inc, Prince Izant Company (Bellman-Melcor), Indian Solder and Brazing Alloys, and Lucas-Milhaupt Inc. The report further investigates the impact of mergers and acquisitions (M&A) activities on market structure, providing analysis of deal values and their influence on market consolidation. Innovation drivers such as the increasing demand for lead-free brazing materials and the adoption of robotic brazing are discussed. The regulatory framework surrounding braze alloy production and usage is also detailed, including an assessment of its effect on market growth. Finally, an in-depth analysis of product substitutes and their competitive impact is provided. The analysis includes an assessment of end-user demographics and their effect on market demand.
Braze Alloys Market Dynamics & Trends
This section delves into the market's growth drivers, technological disruptions, consumer preferences, and competitive dynamics. A detailed examination of the Compound Annual Growth Rate (CAGR) and market penetration rates across different segments is provided. Specific market trends such as the increasing adoption of copper-based brazing materials are analyzed. The report also explores how technological advancements, including robotic brazing, are transforming the market and influencing consumer preferences. Finally, it assesses the competitive dynamics within the industry, providing insights into strategies employed by major players.
Dominant Regions & Segments in Braze Alloys Market
This section identifies the leading regions and segments within the Braze Alloys market. Detailed analysis is provided for the dominant segments by base metal (Copper, Gold, Silver, Aluminum, Other Base Metals) and end-user industry (Automotive, Aerospace and Defense, Electrical and Electronics, Construction, Other End-user Industries).
- Dominant Region: [Insert Dominant Region, e.g., North America]
- Key Drivers:
- [Specific Economic Policies driving growth in the dominant region, e.g., government incentives for green technologies]
- [Infrastructure development in the dominant region contributing to market growth, e.g., expansion of automotive manufacturing facilities]
The analysis includes a thorough examination of market size, growth projections, and competitive landscapes for each segment.
Braze Alloys Market Product Innovations
The Braze Alloys market has witnessed notable product developments driven by technological advancements, focusing on enhanced material properties and improved brazing processes. This section examines leading innovations, their applications, and the competitive advantages they offer. The emphasis is placed on technological trends like the development of lead-free brazing materials and their impact on market fit and adoption.
Report Scope & Segmentation Analysis
This report provides a comprehensive segmentation analysis of the Braze Alloys market based on base metal and end-user industry.
- Base Metal Segmentation: The market is segmented into Copper, Gold, Silver, Aluminum, and Other Base Metals, each with individual growth projections, market sizes, and competitive analyses.
- End-User Industry Segmentation: The market is segmented into Automotive, Aerospace and Defense, Electrical and Electronics, Construction, and Other End-user Industries, each with individual growth projections, market sizes, and competitive analyses.
Key Drivers of Braze Alloys Market Growth
The growth of the Braze Alloys market is propelled by several key factors. These include the rising demand for advanced electronic devices, the increasing adoption of lead-free brazing materials driven by environmental regulations, and the growth of the automotive and aerospace industries. Technological advancements in brazing techniques, such as robotic brazing, are also contributing to market expansion.
Challenges in the Braze Alloys Market Sector
The Braze Alloys market faces several challenges, including the fluctuating prices of raw materials, stringent environmental regulations, and intense competition from substitute materials. Supply chain disruptions can also impact market stability. These factors can influence market growth and profitability. The exact quantifiable impact of these challenges will vary depending on specific market conditions and individual companies.
Emerging Opportunities in Braze Alloys Market
Emerging opportunities lie in the development of novel braze alloys with enhanced properties, such as higher strength and improved corrosion resistance. The increasing demand for miniaturized electronic components and the growth of electric vehicles present significant growth potential. Furthermore, exploration into new applications across various industries opens further avenues for market expansion.
Leading Players in the Braze Alloys Market Market
- The Harris Products Group
- Saru Silver Alloy Private Limited
- Sulzer Ltd
- VBC Group
- Cupro Alloys Corporation
- Morgan Advanced Materials
- OC Oerlikon Management AG (Oerlikon Metco)
- Johnson Matthey
- Aimtek Inc
- Prince Izant Company (Bellman-Melcor)
- Indian Solder and Brazing Alloys
- Lucas-Milhaupt Inc
Key Developments in Braze Alloys Market Industry
- [Month, Year]: Launch of a new lead-free brazing alloy by [Company Name], significantly impacting the market share of lead-based alternatives.
- [Month, Year]: Acquisition of [Company A] by [Company B], leading to increased market consolidation and enhanced product offerings.
- [Month, Year]: Introduction of a robotic brazing system by [Company Name], improving efficiency and reducing production costs.
Future Outlook for Braze Alloys Market Market
The Braze Alloys market is poised for continued growth, driven by increasing demand across various sectors. Technological advancements and the adoption of sustainable materials will be key accelerators. Strategic partnerships and expansion into new markets will further contribute to the market's future potential. The market is expected to experience significant growth over the forecast period due to the increasing demand for technologically advanced and sustainable brazing materials.
Braze Alloys Market Segmentation
-
1. Base Metal
- 1.1. Copper
- 1.2. Gold
- 1.3. Silver
- 1.4. Aluminum
- 1.5. Other Base Metals
-
2. End-user Industry
- 2.1. Automotive
- 2.2. Aerospace and Defense
- 2.3. Electrical and Electronics
- 2.4. Construction
- 2.5. Other End-user Industries
Braze Alloys Market Segmentation By Geography
-
1. Asia Pacific
- 1.1. China
- 1.2. India
- 1.3. Japan
- 1.4. South Korea
- 1.5. Rest of Asia Pacific
-
2. North America
- 2.1. United States
- 2.2. Canada
- 2.3. Mexico
-
3. Europe
- 3.1. Germany
- 3.2. United Kingdom
- 3.3. Italy
- 3.4. France
- 3.5. Spain
- 3.6. Rest of Europe
-
4. South America
- 4.1. Brazil
- 4.2. Argentina
- 4.3. Rest of South America
-
5. Middle East and Africa
- 5.1. Saudi Arabia
- 5.2. South Africa
- 5.3. Rest of Middle East and Africa

Braze Alloys Market REPORT HIGHLIGHTS
| Aspects | Details |
|---|---|
| Study Period | 2019-2033 |
| Base Year | 2024 |
| Estimated Year | 2025 |
| Forecast Period | 2025-2033 |
| Historical Period | 2019-2024 |
| Growth Rate | CAGR of > 4.00% from 2019-2033 |
| Segmentation |
|
Table of Contents
- 1. Introduction
- 1.1. Research Scope
- 1.2. Market Segmentation
- 1.3. Research Methodology
- 1.4. Definitions and Assumptions
- 2. Executive Summary
- 2.1. Introduction
- 3. Market Dynamics
- 3.1. Introduction
- 3.2. Market Drivers
- 3.2.1. Increasing Adoption Rate of Brazing Process Over Processes like Welding and Soldering; Increasing Demand for Aluminum Brazing Alloys from the Automotive Industry
- 3.3. Market Restrains
- 3.3.1. Fluctuating Prices of Base Metals; Other Restraints
- 3.4. Market Trends
- 3.4.1. The Automotive Segment is Expected to Dominate the Market
- 4. Market Factor Analysis
- 4.1. Porters Five Forces
- 4.2. Supply/Value Chain
- 4.3. PESTEL analysis
- 4.4. Market Entropy
- 4.5. Patent/Trademark Analysis
- 5. Global Braze Alloys Market Analysis, Insights and Forecast, 2019-2031
- 5.1. Market Analysis, Insights and Forecast - by Base Metal
- 5.1.1. Copper
- 5.1.2. Gold
- 5.1.3. Silver
- 5.1.4. Aluminum
- 5.1.5. Other Base Metals
- 5.2. Market Analysis, Insights and Forecast - by End-user Industry
- 5.2.1. Automotive
- 5.2.2. Aerospace and Defense
- 5.2.3. Electrical and Electronics
- 5.2.4. Construction
- 5.2.5. Other End-user Industries
- 5.3. Market Analysis, Insights and Forecast - by Region
- 5.3.1. Asia Pacific
- 5.3.2. North America
- 5.3.3. Europe
- 5.3.4. South America
- 5.3.5. Middle East and Africa
- 5.1. Market Analysis, Insights and Forecast - by Base Metal
- 6. Asia Pacific Braze Alloys Market Analysis, Insights and Forecast, 2019-2031
- 6.1. Market Analysis, Insights and Forecast - by Base Metal
- 6.1.1. Copper
- 6.1.2. Gold
- 6.1.3. Silver
- 6.1.4. Aluminum
- 6.1.5. Other Base Metals
- 6.2. Market Analysis, Insights and Forecast - by End-user Industry
- 6.2.1. Automotive
- 6.2.2. Aerospace and Defense
- 6.2.3. Electrical and Electronics
- 6.2.4. Construction
- 6.2.5. Other End-user Industries
- 6.1. Market Analysis, Insights and Forecast - by Base Metal
- 7. North America Braze Alloys Market Analysis, Insights and Forecast, 2019-2031
- 7.1. Market Analysis, Insights and Forecast - by Base Metal
- 7.1.1. Copper
- 7.1.2. Gold
- 7.1.3. Silver
- 7.1.4. Aluminum
- 7.1.5. Other Base Metals
- 7.2. Market Analysis, Insights and Forecast - by End-user Industry
- 7.2.1. Automotive
- 7.2.2. Aerospace and Defense
- 7.2.3. Electrical and Electronics
- 7.2.4. Construction
- 7.2.5. Other End-user Industries
- 7.1. Market Analysis, Insights and Forecast - by Base Metal
- 8. Europe Braze Alloys Market Analysis, Insights and Forecast, 2019-2031
- 8.1. Market Analysis, Insights and Forecast - by Base Metal
- 8.1.1. Copper
- 8.1.2. Gold
- 8.1.3. Silver
- 8.1.4. Aluminum
- 8.1.5. Other Base Metals
- 8.2. Market Analysis, Insights and Forecast - by End-user Industry
- 8.2.1. Automotive
- 8.2.2. Aerospace and Defense
- 8.2.3. Electrical and Electronics
- 8.2.4. Construction
- 8.2.5. Other End-user Industries
- 8.1. Market Analysis, Insights and Forecast - by Base Metal
- 9. South America Braze Alloys Market Analysis, Insights and Forecast, 2019-2031
- 9.1. Market Analysis, Insights and Forecast - by Base Metal
- 9.1.1. Copper
- 9.1.2. Gold
- 9.1.3. Silver
- 9.1.4. Aluminum
- 9.1.5. Other Base Metals
- 9.2. Market Analysis, Insights and Forecast - by End-user Industry
- 9.2.1. Automotive
- 9.2.2. Aerospace and Defense
- 9.2.3. Electrical and Electronics
- 9.2.4. Construction
- 9.2.5. Other End-user Industries
- 9.1. Market Analysis, Insights and Forecast - by Base Metal
- 10. Middle East and Africa Braze Alloys Market Analysis, Insights and Forecast, 2019-2031
- 10.1. Market Analysis, Insights and Forecast - by Base Metal
- 10.1.1. Copper
- 10.1.2. Gold
- 10.1.3. Silver
- 10.1.4. Aluminum
- 10.1.5. Other Base Metals
- 10.2. Market Analysis, Insights and Forecast - by End-user Industry
- 10.2.1. Automotive
- 10.2.2. Aerospace and Defense
- 10.2.3. Electrical and Electronics
- 10.2.4. Construction
- 10.2.5. Other End-user Industries
- 10.1. Market Analysis, Insights and Forecast - by Base Metal
- 11. Asia Pacific Braze Alloys Market Analysis, Insights and Forecast, 2019-2031
- 11.1. Market Analysis, Insights and Forecast - By Country/Sub-region
- 11.1.1 China
- 11.1.2 India
- 11.1.3 Japan
- 11.1.4 South Korea
- 11.1.5 Rest of Asia Pacific
- 12. North America Braze Alloys Market Analysis, Insights and Forecast, 2019-2031
- 12.1. Market Analysis, Insights and Forecast - By Country/Sub-region
- 12.1.1 United States
- 12.1.2 Canada
- 12.1.3 Mexico
- 13. Europe Braze Alloys Market Analysis, Insights and Forecast, 2019-2031
- 13.1. Market Analysis, Insights and Forecast - By Country/Sub-region
- 13.1.1 Germany
- 13.1.2 United Kingdom
- 13.1.3 Italy
- 13.1.4 France
- 13.1.5 Spain
- 13.1.6 Rest of Europe
- 14. South America Braze Alloys Market Analysis, Insights and Forecast, 2019-2031
- 14.1. Market Analysis, Insights and Forecast - By Country/Sub-region
- 14.1.1 Brazil
- 14.1.2 Argentina
- 14.1.3 Rest of South America
- 15. Middle East and Africa Braze Alloys Market Analysis, Insights and Forecast, 2019-2031
- 15.1. Market Analysis, Insights and Forecast - By Country/Sub-region
- 15.1.1 Saudi Arabia
- 15.1.2 South Africa
- 15.1.3 Rest of Middle East and Africa
- 16. Competitive Analysis
- 16.1. Global Market Share Analysis 2024
- 16.2. Company Profiles
- 16.2.1 The Harris Products Group
- 16.2.1.1. Overview
- 16.2.1.2. Products
- 16.2.1.3. SWOT Analysis
- 16.2.1.4. Recent Developments
- 16.2.1.5. Financials (Based on Availability)
- 16.2.2 Saru Silver Alloy Private Limited
- 16.2.2.1. Overview
- 16.2.2.2. Products
- 16.2.2.3. SWOT Analysis
- 16.2.2.4. Recent Developments
- 16.2.2.5. Financials (Based on Availability)
- 16.2.3 Sulzer Ltd
- 16.2.3.1. Overview
- 16.2.3.2. Products
- 16.2.3.3. SWOT Analysis
- 16.2.3.4. Recent Developments
- 16.2.3.5. Financials (Based on Availability)
- 16.2.4 VBC Group*List Not Exhaustive
- 16.2.4.1. Overview
- 16.2.4.2. Products
- 16.2.4.3. SWOT Analysis
- 16.2.4.4. Recent Developments
- 16.2.4.5. Financials (Based on Availability)
- 16.2.5 Cupro Alloys Corporation
- 16.2.5.1. Overview
- 16.2.5.2. Products
- 16.2.5.3. SWOT Analysis
- 16.2.5.4. Recent Developments
- 16.2.5.5. Financials (Based on Availability)
- 16.2.6 Morgan Advanced Materials
- 16.2.6.1. Overview
- 16.2.6.2. Products
- 16.2.6.3. SWOT Analysis
- 16.2.6.4. Recent Developments
- 16.2.6.5. Financials (Based on Availability)
- 16.2.7 OC Oerlikon Management AG (Oerlikon Metco)
- 16.2.7.1. Overview
- 16.2.7.2. Products
- 16.2.7.3. SWOT Analysis
- 16.2.7.4. Recent Developments
- 16.2.7.5. Financials (Based on Availability)
- 16.2.8 Johnson Matthey
- 16.2.8.1. Overview
- 16.2.8.2. Products
- 16.2.8.3. SWOT Analysis
- 16.2.8.4. Recent Developments
- 16.2.8.5. Financials (Based on Availability)
- 16.2.9 Aimtek Inc
- 16.2.9.1. Overview
- 16.2.9.2. Products
- 16.2.9.3. SWOT Analysis
- 16.2.9.4. Recent Developments
- 16.2.9.5. Financials (Based on Availability)
- 16.2.10 Prince Izant Company (Bellman-Melcor)
- 16.2.10.1. Overview
- 16.2.10.2. Products
- 16.2.10.3. SWOT Analysis
- 16.2.10.4. Recent Developments
- 16.2.10.5. Financials (Based on Availability)
- 16.2.11 Indian Solder and Brazing Alloys
- 16.2.11.1. Overview
- 16.2.11.2. Products
- 16.2.11.3. SWOT Analysis
- 16.2.11.4. Recent Developments
- 16.2.11.5. Financials (Based on Availability)
- 16.2.12 Lucas-Milhaupt Inc
- 16.2.12.1. Overview
- 16.2.12.2. Products
- 16.2.12.3. SWOT Analysis
- 16.2.12.4. Recent Developments
- 16.2.12.5. Financials (Based on Availability)
- 16.2.1 The Harris Products Group
List of Figures
- Figure 1: Global Braze Alloys Market Revenue Breakdown (Million, %) by Region 2024 & 2032
- Figure 2: Global Braze Alloys Market Volume Breakdown (K Tons, %) by Region 2024 & 2032
- Figure 3: Asia Pacific Braze Alloys Market Revenue (Million), by Country 2024 & 2032
- Figure 4: Asia Pacific Braze Alloys Market Volume (K Tons), by Country 2024 & 2032
- Figure 5: Asia Pacific Braze Alloys Market Revenue Share (%), by Country 2024 & 2032
- Figure 6: Asia Pacific Braze Alloys Market Volume Share (%), by Country 2024 & 2032
- Figure 7: North America Braze Alloys Market Revenue (Million), by Country 2024 & 2032
- Figure 8: North America Braze Alloys Market Volume (K Tons), by Country 2024 & 2032
- Figure 9: North America Braze Alloys Market Revenue Share (%), by Country 2024 & 2032
- Figure 10: North America Braze Alloys Market Volume Share (%), by Country 2024 & 2032
- Figure 11: Europe Braze Alloys Market Revenue (Million), by Country 2024 & 2032
- Figure 12: Europe Braze Alloys Market Volume (K Tons), by Country 2024 & 2032
- Figure 13: Europe Braze Alloys Market Revenue Share (%), by Country 2024 & 2032
- Figure 14: Europe Braze Alloys Market Volume Share (%), by Country 2024 & 2032
- Figure 15: South America Braze Alloys Market Revenue (Million), by Country 2024 & 2032
- Figure 16: South America Braze Alloys Market Volume (K Tons), by Country 2024 & 2032
- Figure 17: South America Braze Alloys Market Revenue Share (%), by Country 2024 & 2032
- Figure 18: South America Braze Alloys Market Volume Share (%), by Country 2024 & 2032
- Figure 19: Middle East and Africa Braze Alloys Market Revenue (Million), by Country 2024 & 2032
- Figure 20: Middle East and Africa Braze Alloys Market Volume (K Tons), by Country 2024 & 2032
- Figure 21: Middle East and Africa Braze Alloys Market Revenue Share (%), by Country 2024 & 2032
- Figure 22: Middle East and Africa Braze Alloys Market Volume Share (%), by Country 2024 & 2032
- Figure 23: Asia Pacific Braze Alloys Market Revenue (Million), by Base Metal 2024 & 2032
- Figure 24: Asia Pacific Braze Alloys Market Volume (K Tons), by Base Metal 2024 & 2032
- Figure 25: Asia Pacific Braze Alloys Market Revenue Share (%), by Base Metal 2024 & 2032
- Figure 26: Asia Pacific Braze Alloys Market Volume Share (%), by Base Metal 2024 & 2032
- Figure 27: Asia Pacific Braze Alloys Market Revenue (Million), by End-user Industry 2024 & 2032
- Figure 28: Asia Pacific Braze Alloys Market Volume (K Tons), by End-user Industry 2024 & 2032
- Figure 29: Asia Pacific Braze Alloys Market Revenue Share (%), by End-user Industry 2024 & 2032
- Figure 30: Asia Pacific Braze Alloys Market Volume Share (%), by End-user Industry 2024 & 2032
- Figure 31: Asia Pacific Braze Alloys Market Revenue (Million), by Country 2024 & 2032
- Figure 32: Asia Pacific Braze Alloys Market Volume (K Tons), by Country 2024 & 2032
- Figure 33: Asia Pacific Braze Alloys Market Revenue Share (%), by Country 2024 & 2032
- Figure 34: Asia Pacific Braze Alloys Market Volume Share (%), by Country 2024 & 2032
- Figure 35: North America Braze Alloys Market Revenue (Million), by Base Metal 2024 & 2032
- Figure 36: North America Braze Alloys Market Volume (K Tons), by Base Metal 2024 & 2032
- Figure 37: North America Braze Alloys Market Revenue Share (%), by Base Metal 2024 & 2032
- Figure 38: North America Braze Alloys Market Volume Share (%), by Base Metal 2024 & 2032
- Figure 39: North America Braze Alloys Market Revenue (Million), by End-user Industry 2024 & 2032
- Figure 40: North America Braze Alloys Market Volume (K Tons), by End-user Industry 2024 & 2032
- Figure 41: North America Braze Alloys Market Revenue Share (%), by End-user Industry 2024 & 2032
- Figure 42: North America Braze Alloys Market Volume Share (%), by End-user Industry 2024 & 2032
- Figure 43: North America Braze Alloys Market Revenue (Million), by Country 2024 & 2032
- Figure 44: North America Braze Alloys Market Volume (K Tons), by Country 2024 & 2032
- Figure 45: North America Braze Alloys Market Revenue Share (%), by Country 2024 & 2032
- Figure 46: North America Braze Alloys Market Volume Share (%), by Country 2024 & 2032
- Figure 47: Europe Braze Alloys Market Revenue (Million), by Base Metal 2024 & 2032
- Figure 48: Europe Braze Alloys Market Volume (K Tons), by Base Metal 2024 & 2032
- Figure 49: Europe Braze Alloys Market Revenue Share (%), by Base Metal 2024 & 2032
- Figure 50: Europe Braze Alloys Market Volume Share (%), by Base Metal 2024 & 2032
- Figure 51: Europe Braze Alloys Market Revenue (Million), by End-user Industry 2024 & 2032
- Figure 52: Europe Braze Alloys Market Volume (K Tons), by End-user Industry 2024 & 2032
- Figure 53: Europe Braze Alloys Market Revenue Share (%), by End-user Industry 2024 & 2032
- Figure 54: Europe Braze Alloys Market Volume Share (%), by End-user Industry 2024 & 2032
- Figure 55: Europe Braze Alloys Market Revenue (Million), by Country 2024 & 2032
- Figure 56: Europe Braze Alloys Market Volume (K Tons), by Country 2024 & 2032
- Figure 57: Europe Braze Alloys Market Revenue Share (%), by Country 2024 & 2032
- Figure 58: Europe Braze Alloys Market Volume Share (%), by Country 2024 & 2032
- Figure 59: South America Braze Alloys Market Revenue (Million), by Base Metal 2024 & 2032
- Figure 60: South America Braze Alloys Market Volume (K Tons), by Base Metal 2024 & 2032
- Figure 61: South America Braze Alloys Market Revenue Share (%), by Base Metal 2024 & 2032
- Figure 62: South America Braze Alloys Market Volume Share (%), by Base Metal 2024 & 2032
- Figure 63: South America Braze Alloys Market Revenue (Million), by End-user Industry 2024 & 2032
- Figure 64: South America Braze Alloys Market Volume (K Tons), by End-user Industry 2024 & 2032
- Figure 65: South America Braze Alloys Market Revenue Share (%), by End-user Industry 2024 & 2032
- Figure 66: South America Braze Alloys Market Volume Share (%), by End-user Industry 2024 & 2032
- Figure 67: South America Braze Alloys Market Revenue (Million), by Country 2024 & 2032
- Figure 68: South America Braze Alloys Market Volume (K Tons), by Country 2024 & 2032
- Figure 69: South America Braze Alloys Market Revenue Share (%), by Country 2024 & 2032
- Figure 70: South America Braze Alloys Market Volume Share (%), by Country 2024 & 2032
- Figure 71: Middle East and Africa Braze Alloys Market Revenue (Million), by Base Metal 2024 & 2032
- Figure 72: Middle East and Africa Braze Alloys Market Volume (K Tons), by Base Metal 2024 & 2032
- Figure 73: Middle East and Africa Braze Alloys Market Revenue Share (%), by Base Metal 2024 & 2032
- Figure 74: Middle East and Africa Braze Alloys Market Volume Share (%), by Base Metal 2024 & 2032
- Figure 75: Middle East and Africa Braze Alloys Market Revenue (Million), by End-user Industry 2024 & 2032
- Figure 76: Middle East and Africa Braze Alloys Market Volume (K Tons), by End-user Industry 2024 & 2032
- Figure 77: Middle East and Africa Braze Alloys Market Revenue Share (%), by End-user Industry 2024 & 2032
- Figure 78: Middle East and Africa Braze Alloys Market Volume Share (%), by End-user Industry 2024 & 2032
- Figure 79: Middle East and Africa Braze Alloys Market Revenue (Million), by Country 2024 & 2032
- Figure 80: Middle East and Africa Braze Alloys Market Volume (K Tons), by Country 2024 & 2032
- Figure 81: Middle East and Africa Braze Alloys Market Revenue Share (%), by Country 2024 & 2032
- Figure 82: Middle East and Africa Braze Alloys Market Volume Share (%), by Country 2024 & 2032
List of Tables
- Table 1: Global Braze Alloys Market Revenue Million Forecast, by Region 2019 & 2032
- Table 2: Global Braze Alloys Market Volume K Tons Forecast, by Region 2019 & 2032
- Table 3: Global Braze Alloys Market Revenue Million Forecast, by Base Metal 2019 & 2032
- Table 4: Global Braze Alloys Market Volume K Tons Forecast, by Base Metal 2019 & 2032
- Table 5: Global Braze Alloys Market Revenue Million Forecast, by End-user Industry 2019 & 2032
- Table 6: Global Braze Alloys Market Volume K Tons Forecast, by End-user Industry 2019 & 2032
- Table 7: Global Braze Alloys Market Revenue Million Forecast, by Region 2019 & 2032
- Table 8: Global Braze Alloys Market Volume K Tons Forecast, by Region 2019 & 2032
- Table 9: Global Braze Alloys Market Revenue Million Forecast, by Country 2019 & 2032
- Table 10: Global Braze Alloys Market Volume K Tons Forecast, by Country 2019 & 2032
- Table 11: China Braze Alloys Market Revenue (Million) Forecast, by Application 2019 & 2032
- Table 12: China Braze Alloys Market Volume (K Tons) Forecast, by Application 2019 & 2032
- Table 13: India Braze Alloys Market Revenue (Million) Forecast, by Application 2019 & 2032
- Table 14: India Braze Alloys Market Volume (K Tons) Forecast, by Application 2019 & 2032
- Table 15: Japan Braze Alloys Market Revenue (Million) Forecast, by Application 2019 & 2032
- Table 16: Japan Braze Alloys Market Volume (K Tons) Forecast, by Application 2019 & 2032
- Table 17: South Korea Braze Alloys Market Revenue (Million) Forecast, by Application 2019 & 2032
- Table 18: South Korea Braze Alloys Market Volume (K Tons) Forecast, by Application 2019 & 2032
- Table 19: Rest of Asia Pacific Braze Alloys Market Revenue (Million) Forecast, by Application 2019 & 2032
- Table 20: Rest of Asia Pacific Braze Alloys Market Volume (K Tons) Forecast, by Application 2019 & 2032
- Table 21: Global Braze Alloys Market Revenue Million Forecast, by Country 2019 & 2032
- Table 22: Global Braze Alloys Market Volume K Tons Forecast, by Country 2019 & 2032
- Table 23: United States Braze Alloys Market Revenue (Million) Forecast, by Application 2019 & 2032
- Table 24: United States Braze Alloys Market Volume (K Tons) Forecast, by Application 2019 & 2032
- Table 25: Canada Braze Alloys Market Revenue (Million) Forecast, by Application 2019 & 2032
- Table 26: Canada Braze Alloys Market Volume (K Tons) Forecast, by Application 2019 & 2032
- Table 27: Mexico Braze Alloys Market Revenue (Million) Forecast, by Application 2019 & 2032
- Table 28: Mexico Braze Alloys Market Volume (K Tons) Forecast, by Application 2019 & 2032
- Table 29: Global Braze Alloys Market Revenue Million Forecast, by Country 2019 & 2032
- Table 30: Global Braze Alloys Market Volume K Tons Forecast, by Country 2019 & 2032
- Table 31: Germany Braze Alloys Market Revenue (Million) Forecast, by Application 2019 & 2032
- Table 32: Germany Braze Alloys Market Volume (K Tons) Forecast, by Application 2019 & 2032
- Table 33: United Kingdom Braze Alloys Market Revenue (Million) Forecast, by Application 2019 & 2032
- Table 34: United Kingdom Braze Alloys Market Volume (K Tons) Forecast, by Application 2019 & 2032
- Table 35: Italy Braze Alloys Market Revenue (Million) Forecast, by Application 2019 & 2032
- Table 36: Italy Braze Alloys Market Volume (K Tons) Forecast, by Application 2019 & 2032
- Table 37: France Braze Alloys Market Revenue (Million) Forecast, by Application 2019 & 2032
- Table 38: France Braze Alloys Market Volume (K Tons) Forecast, by Application 2019 & 2032
- Table 39: Spain Braze Alloys Market Revenue (Million) Forecast, by Application 2019 & 2032
- Table 40: Spain Braze Alloys Market Volume (K Tons) Forecast, by Application 2019 & 2032
- Table 41: Rest of Europe Braze Alloys Market Revenue (Million) Forecast, by Application 2019 & 2032
- Table 42: Rest of Europe Braze Alloys Market Volume (K Tons) Forecast, by Application 2019 & 2032
- Table 43: Global Braze Alloys Market Revenue Million Forecast, by Country 2019 & 2032
- Table 44: Global Braze Alloys Market Volume K Tons Forecast, by Country 2019 & 2032
- Table 45: Brazil Braze Alloys Market Revenue (Million) Forecast, by Application 2019 & 2032
- Table 46: Brazil Braze Alloys Market Volume (K Tons) Forecast, by Application 2019 & 2032
- Table 47: Argentina Braze Alloys Market Revenue (Million) Forecast, by Application 2019 & 2032
- Table 48: Argentina Braze Alloys Market Volume (K Tons) Forecast, by Application 2019 & 2032
- Table 49: Rest of South America Braze Alloys Market Revenue (Million) Forecast, by Application 2019 & 2032
- Table 50: Rest of South America Braze Alloys Market Volume (K Tons) Forecast, by Application 2019 & 2032
- Table 51: Global Braze Alloys Market Revenue Million Forecast, by Country 2019 & 2032
- Table 52: Global Braze Alloys Market Volume K Tons Forecast, by Country 2019 & 2032
- Table 53: Saudi Arabia Braze Alloys Market Revenue (Million) Forecast, by Application 2019 & 2032
- Table 54: Saudi Arabia Braze Alloys Market Volume (K Tons) Forecast, by Application 2019 & 2032
- Table 55: South Africa Braze Alloys Market Revenue (Million) Forecast, by Application 2019 & 2032
- Table 56: South Africa Braze Alloys Market Volume (K Tons) Forecast, by Application 2019 & 2032
- Table 57: Rest of Middle East and Africa Braze Alloys Market Revenue (Million) Forecast, by Application 2019 & 2032
- Table 58: Rest of Middle East and Africa Braze Alloys Market Volume (K Tons) Forecast, by Application 2019 & 2032
- Table 59: Global Braze Alloys Market Revenue Million Forecast, by Base Metal 2019 & 2032
- Table 60: Global Braze Alloys Market Volume K Tons Forecast, by Base Metal 2019 & 2032
- Table 61: Global Braze Alloys Market Revenue Million Forecast, by End-user Industry 2019 & 2032
- Table 62: Global Braze Alloys Market Volume K Tons Forecast, by End-user Industry 2019 & 2032
- Table 63: Global Braze Alloys Market Revenue Million Forecast, by Country 2019 & 2032
- Table 64: Global Braze Alloys Market Volume K Tons Forecast, by Country 2019 & 2032
- Table 65: China Braze Alloys Market Revenue (Million) Forecast, by Application 2019 & 2032
- Table 66: China Braze Alloys Market Volume (K Tons) Forecast, by Application 2019 & 2032
- Table 67: India Braze Alloys Market Revenue (Million) Forecast, by Application 2019 & 2032
- Table 68: India Braze Alloys Market Volume (K Tons) Forecast, by Application 2019 & 2032
- Table 69: Japan Braze Alloys Market Revenue (Million) Forecast, by Application 2019 & 2032
- Table 70: Japan Braze Alloys Market Volume (K Tons) Forecast, by Application 2019 & 2032
- Table 71: South Korea Braze Alloys Market Revenue (Million) Forecast, by Application 2019 & 2032
- Table 72: South Korea Braze Alloys Market Volume (K Tons) Forecast, by Application 2019 & 2032
- Table 73: Rest of Asia Pacific Braze Alloys Market Revenue (Million) Forecast, by Application 2019 & 2032
- Table 74: Rest of Asia Pacific Braze Alloys Market Volume (K Tons) Forecast, by Application 2019 & 2032
- Table 75: Global Braze Alloys Market Revenue Million Forecast, by Base Metal 2019 & 2032
- Table 76: Global Braze Alloys Market Volume K Tons Forecast, by Base Metal 2019 & 2032
- Table 77: Global Braze Alloys Market Revenue Million Forecast, by End-user Industry 2019 & 2032
- Table 78: Global Braze Alloys Market Volume K Tons Forecast, by End-user Industry 2019 & 2032
- Table 79: Global Braze Alloys Market Revenue Million Forecast, by Country 2019 & 2032
- Table 80: Global Braze Alloys Market Volume K Tons Forecast, by Country 2019 & 2032
- Table 81: United States Braze Alloys Market Revenue (Million) Forecast, by Application 2019 & 2032
- Table 82: United States Braze Alloys Market Volume (K Tons) Forecast, by Application 2019 & 2032
- Table 83: Canada Braze Alloys Market Revenue (Million) Forecast, by Application 2019 & 2032
- Table 84: Canada Braze Alloys Market Volume (K Tons) Forecast, by Application 2019 & 2032
- Table 85: Mexico Braze Alloys Market Revenue (Million) Forecast, by Application 2019 & 2032
- Table 86: Mexico Braze Alloys Market Volume (K Tons) Forecast, by Application 2019 & 2032
- Table 87: Global Braze Alloys Market Revenue Million Forecast, by Base Metal 2019 & 2032
- Table 88: Global Braze Alloys Market Volume K Tons Forecast, by Base Metal 2019 & 2032
- Table 89: Global Braze Alloys Market Revenue Million Forecast, by End-user Industry 2019 & 2032
- Table 90: Global Braze Alloys Market Volume K Tons Forecast, by End-user Industry 2019 & 2032
- Table 91: Global Braze Alloys Market Revenue Million Forecast, by Country 2019 & 2032
- Table 92: Global Braze Alloys Market Volume K Tons Forecast, by Country 2019 & 2032
- Table 93: Germany Braze Alloys Market Revenue (Million) Forecast, by Application 2019 & 2032
- Table 94: Germany Braze Alloys Market Volume (K Tons) Forecast, by Application 2019 & 2032
- Table 95: United Kingdom Braze Alloys Market Revenue (Million) Forecast, by Application 2019 & 2032
- Table 96: United Kingdom Braze Alloys Market Volume (K Tons) Forecast, by Application 2019 & 2032
- Table 97: Italy Braze Alloys Market Revenue (Million) Forecast, by Application 2019 & 2032
- Table 98: Italy Braze Alloys Market Volume (K Tons) Forecast, by Application 2019 & 2032
- Table 99: France Braze Alloys Market Revenue (Million) Forecast, by Application 2019 & 2032
- Table 100: France Braze Alloys Market Volume (K Tons) Forecast, by Application 2019 & 2032
- Table 101: Spain Braze Alloys Market Revenue (Million) Forecast, by Application 2019 & 2032
- Table 102: Spain Braze Alloys Market Volume (K Tons) Forecast, by Application 2019 & 2032
- Table 103: Rest of Europe Braze Alloys Market Revenue (Million) Forecast, by Application 2019 & 2032
- Table 104: Rest of Europe Braze Alloys Market Volume (K Tons) Forecast, by Application 2019 & 2032
- Table 105: Global Braze Alloys Market Revenue Million Forecast, by Base Metal 2019 & 2032
- Table 106: Global Braze Alloys Market Volume K Tons Forecast, by Base Metal 2019 & 2032
- Table 107: Global Braze Alloys Market Revenue Million Forecast, by End-user Industry 2019 & 2032
- Table 108: Global Braze Alloys Market Volume K Tons Forecast, by End-user Industry 2019 & 2032
- Table 109: Global Braze Alloys Market Revenue Million Forecast, by Country 2019 & 2032
- Table 110: Global Braze Alloys Market Volume K Tons Forecast, by Country 2019 & 2032
- Table 111: Brazil Braze Alloys Market Revenue (Million) Forecast, by Application 2019 & 2032
- Table 112: Brazil Braze Alloys Market Volume (K Tons) Forecast, by Application 2019 & 2032
- Table 113: Argentina Braze Alloys Market Revenue (Million) Forecast, by Application 2019 & 2032
- Table 114: Argentina Braze Alloys Market Volume (K Tons) Forecast, by Application 2019 & 2032
- Table 115: Rest of South America Braze Alloys Market Revenue (Million) Forecast, by Application 2019 & 2032
- Table 116: Rest of South America Braze Alloys Market Volume (K Tons) Forecast, by Application 2019 & 2032
- Table 117: Global Braze Alloys Market Revenue Million Forecast, by Base Metal 2019 & 2032
- Table 118: Global Braze Alloys Market Volume K Tons Forecast, by Base Metal 2019 & 2032
- Table 119: Global Braze Alloys Market Revenue Million Forecast, by End-user Industry 2019 & 2032
- Table 120: Global Braze Alloys Market Volume K Tons Forecast, by End-user Industry 2019 & 2032
- Table 121: Global Braze Alloys Market Revenue Million Forecast, by Country 2019 & 2032
- Table 122: Global Braze Alloys Market Volume K Tons Forecast, by Country 2019 & 2032
- Table 123: Saudi Arabia Braze Alloys Market Revenue (Million) Forecast, by Application 2019 & 2032
- Table 124: Saudi Arabia Braze Alloys Market Volume (K Tons) Forecast, by Application 2019 & 2032
- Table 125: South Africa Braze Alloys Market Revenue (Million) Forecast, by Application 2019 & 2032
- Table 126: South Africa Braze Alloys Market Volume (K Tons) Forecast, by Application 2019 & 2032
- Table 127: Rest of Middle East and Africa Braze Alloys Market Revenue (Million) Forecast, by Application 2019 & 2032
- Table 128: Rest of Middle East and Africa Braze Alloys Market Volume (K Tons) Forecast, by Application 2019 & 2032
Frequently Asked Questions
1. What is the projected Compound Annual Growth Rate (CAGR) of the Braze Alloys Market?
The projected CAGR is approximately > 4.00%.
2. Which companies are prominent players in the Braze Alloys Market?
Key companies in the market include The Harris Products Group, Saru Silver Alloy Private Limited, Sulzer Ltd, VBC Group*List Not Exhaustive, Cupro Alloys Corporation, Morgan Advanced Materials, OC Oerlikon Management AG (Oerlikon Metco), Johnson Matthey, Aimtek Inc, Prince Izant Company (Bellman-Melcor), Indian Solder and Brazing Alloys, Lucas-Milhaupt Inc.
3. What are the main segments of the Braze Alloys Market?
The market segments include Base Metal, End-user Industry.
4. Can you provide details about the market size?
The market size is estimated to be USD 2759.3 Million as of 2022.
5. What are some drivers contributing to market growth?
Increasing Adoption Rate of Brazing Process Over Processes like Welding and Soldering; Increasing Demand for Aluminum Brazing Alloys from the Automotive Industry.
6. What are the notable trends driving market growth?
The Automotive Segment is Expected to Dominate the Market.
7. Are there any restraints impacting market growth?
Fluctuating Prices of Base Metals; Other Restraints.
8. Can you provide examples of recent developments in the market?
The Braze Alloys sector has experienced several significant developments in recent years. The major developments include the increasing demand for lead-free brazing materials, the growing popularity of robotic brazing, and the increasing demand for copper-based brazing materials.
9. What pricing options are available for accessing the report?
Pricing options include single-user, multi-user, and enterprise licenses priced at USD 4750, USD 5250, and USD 8750 respectively.
10. Is the market size provided in terms of value or volume?
The market size is provided in terms of value, measured in Million and volume, measured in K Tons.
11. Are there any specific market keywords associated with the report?
Yes, the market keyword associated with the report is "Braze Alloys Market," which aids in identifying and referencing the specific market segment covered.
12. How do I determine which pricing option suits my needs best?
The pricing options vary based on user requirements and access needs. Individual users may opt for single-user licenses, while businesses requiring broader access may choose multi-user or enterprise licenses for cost-effective access to the report.
13. Are there any additional resources or data provided in the Braze Alloys Market report?
While the report offers comprehensive insights, it's advisable to review the specific contents or supplementary materials provided to ascertain if additional resources or data are available.
14. How can I stay updated on further developments or reports in the Braze Alloys Market?
To stay informed about further developments, trends, and reports in the Braze Alloys Market, consider subscribing to industry newsletters, following relevant companies and organizations, or regularly checking reputable industry news sources and publications.
Methodology
Step 1 - Identification of Relevant Samples Size from Population Database


Step 2 - Approaches for Defining Global Market Size (Value, Volume* & Price*)

Note*: In applicable scenarios
Step 3 - Data Sources
Primary Research
- Web Analytics
- Survey Reports
- Research Institute
- Latest Research Reports
- Opinion Leaders
Secondary Research
- Annual Reports
- White Paper
- Latest Press Release
- Industry Association
- Paid Database
- Investor Presentations

Step 4 - Data Triangulation
Involves using different sources of information in order to increase the validity of a study
These sources are likely to be stakeholders in a program - participants, other researchers, program staff, other community members, and so on.
Then we put all data in single framework & apply various statistical tools to find out the dynamic on the market.
During the analysis stage, feedback from the stakeholder groups would be compared to determine areas of agreement as well as areas of divergence


