

Key Insights
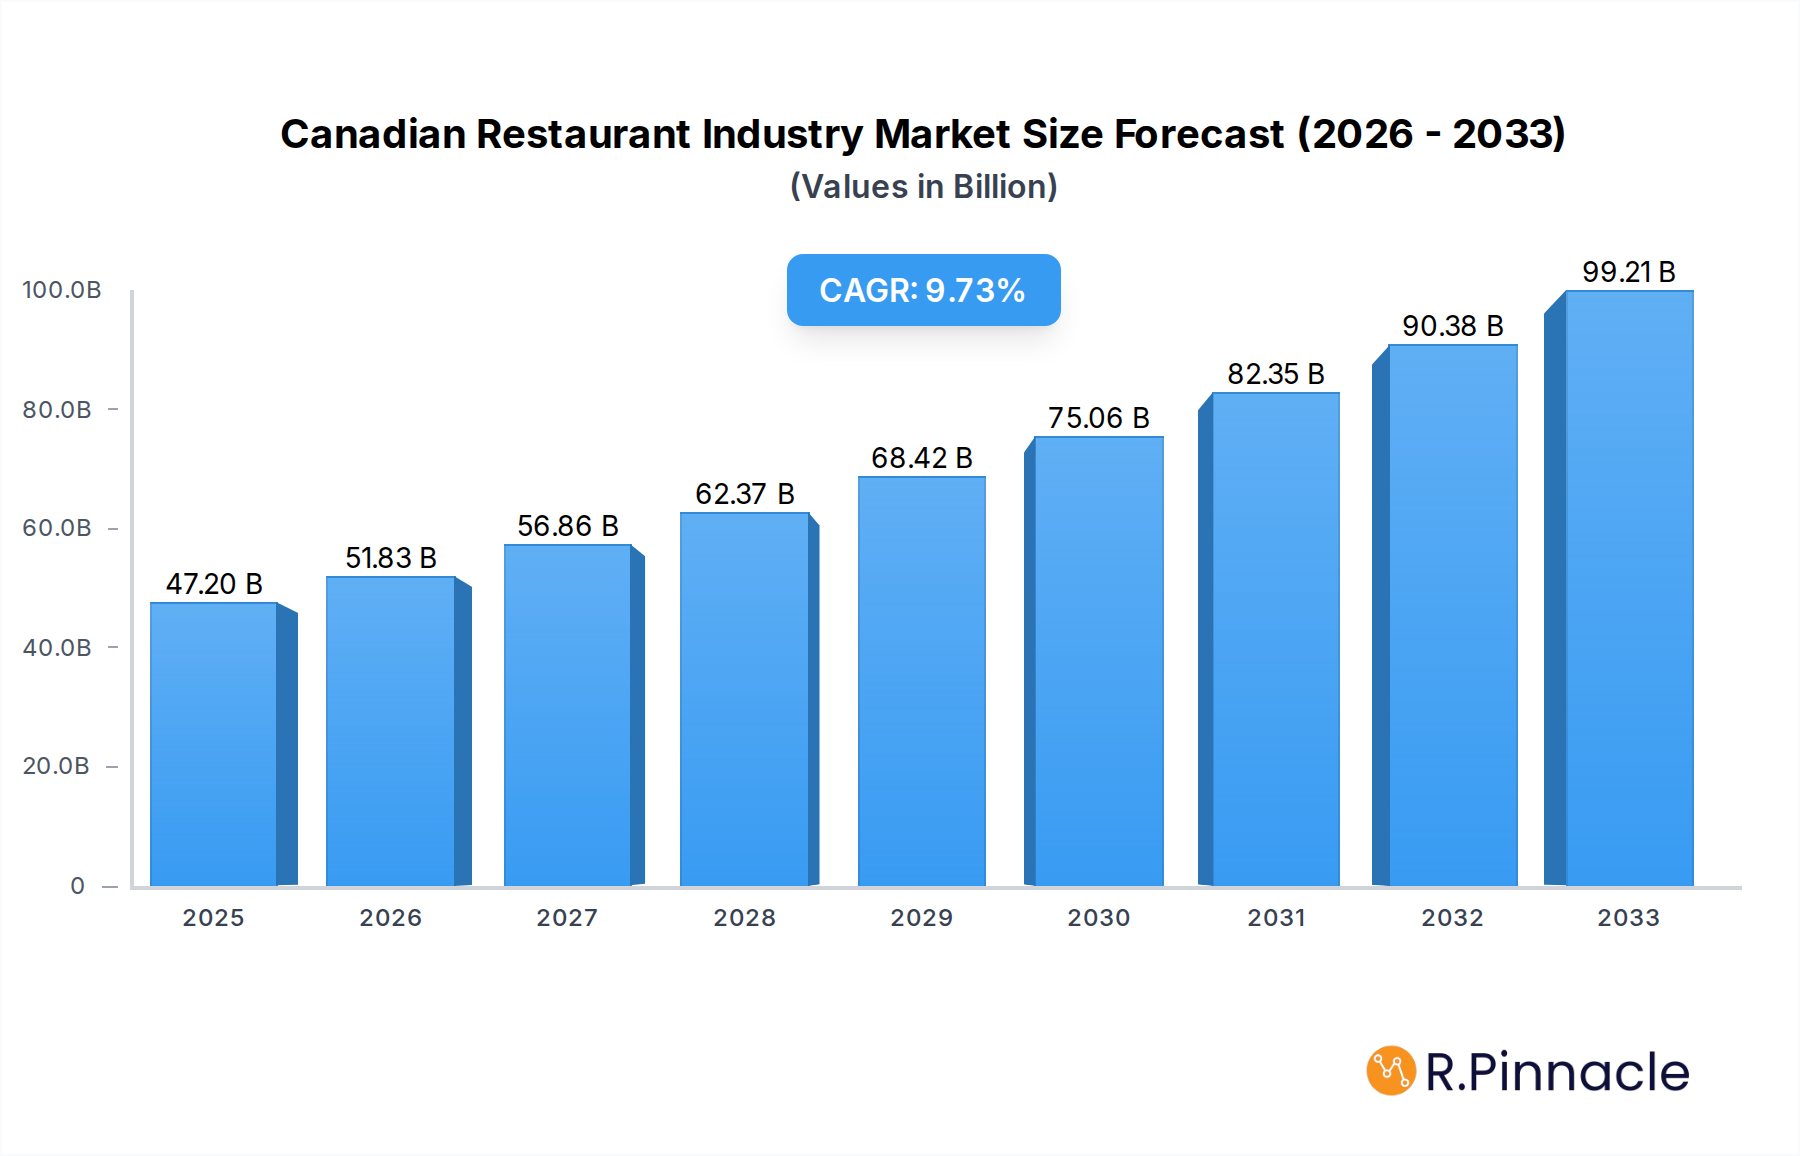
The Canadian Restaurant Industry is poised for significant expansion, with a projected market size of $47.2 billion in 2025. This robust growth is underpinned by an impressive compound annual growth rate (CAGR) of 9.8% anticipated over the forecast period. This upward trajectory is primarily fueled by evolving consumer preferences for convenience and diverse culinary experiences, leading to the rapid adoption of cloud kitchens and a surge in demand for quick-service restaurants (QSRs) specializing in popular cuisines like burgers and pizza. The expansion of chained outlets also plays a crucial role, offering consistent brand experiences and efficient service models that resonate with a broad consumer base. Furthermore, the increasing presence of diverse dining options within leisure and travel locations is attracting a larger share of consumer spending, indicating a dynamic and adaptive industry landscape.

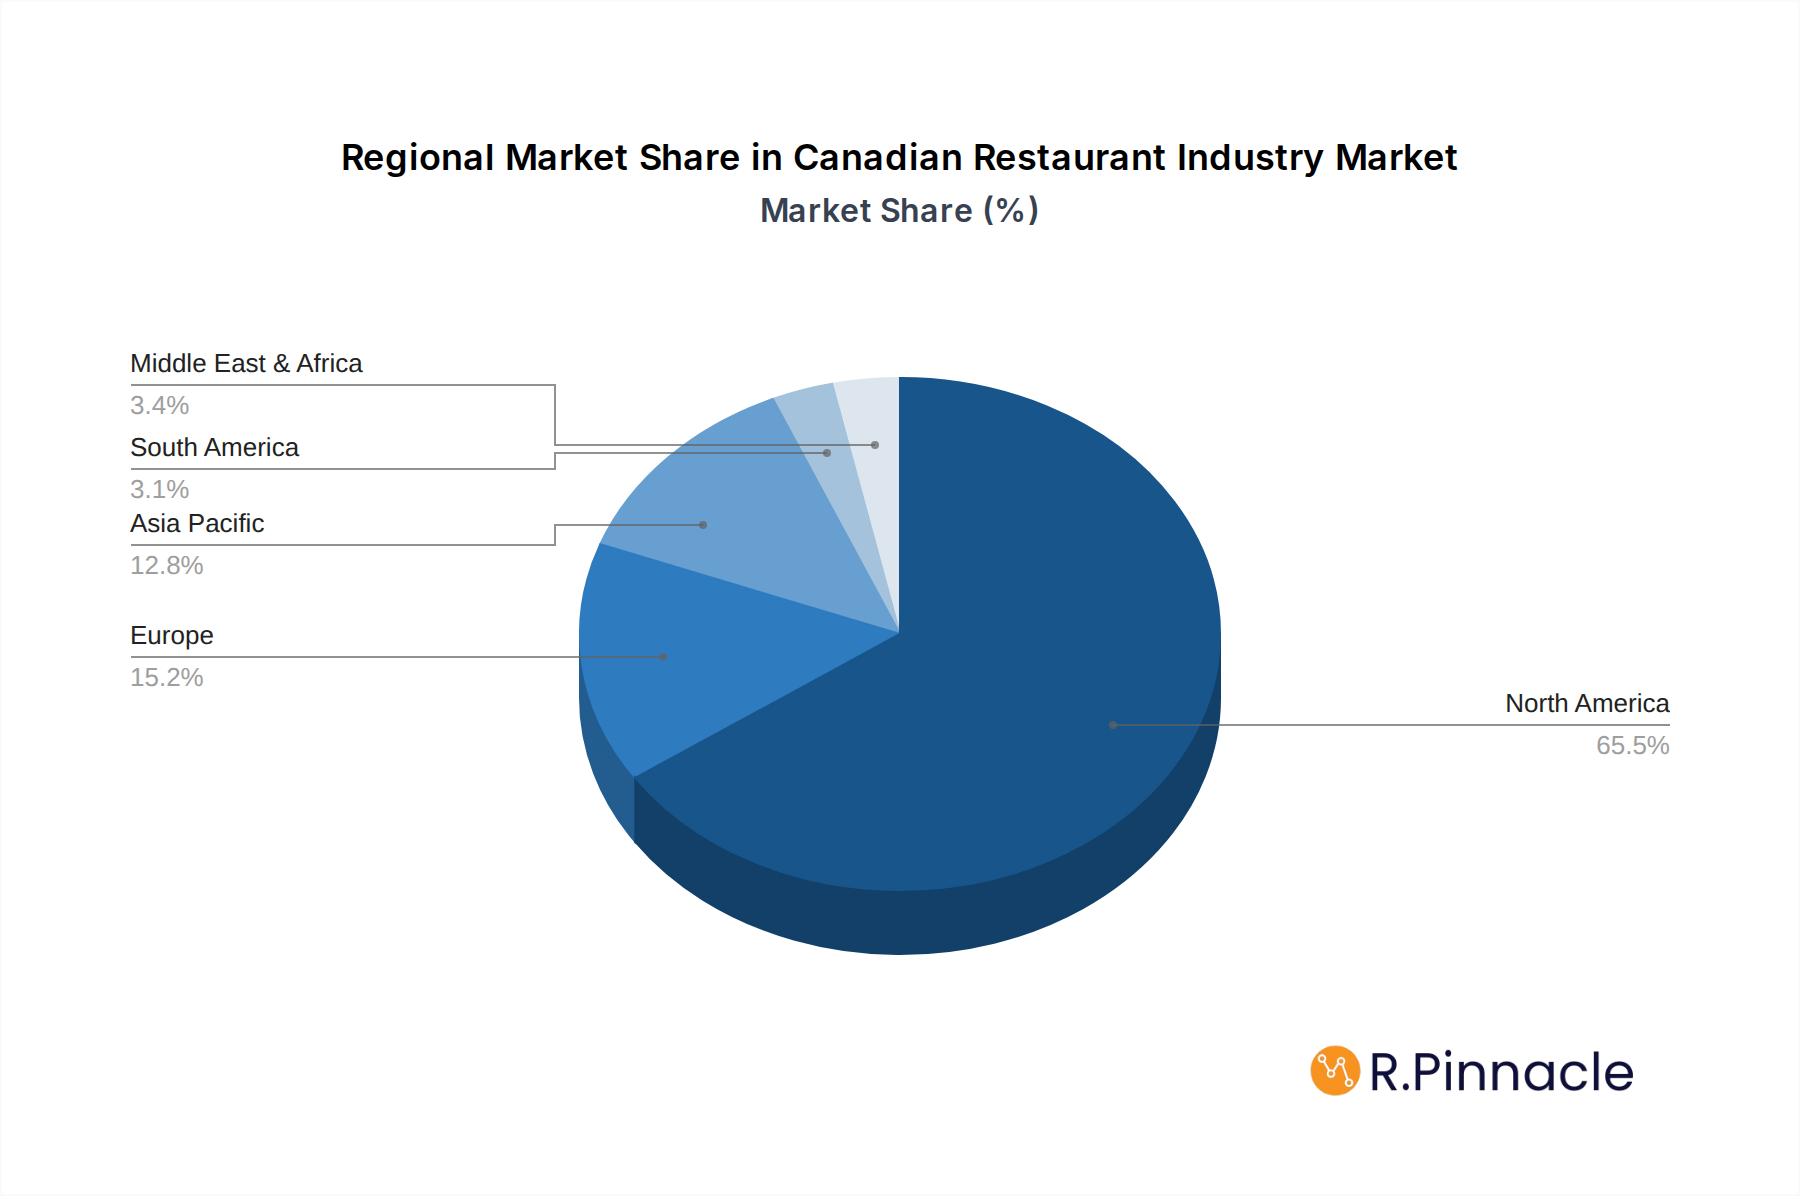
Canadian Restaurant Industry Market Size (In Billion)
Despite strong growth, certain factors could temper this expansion. Intense competition among a growing number of establishments, coupled with rising operational costs including labor and ingredient prices, presents a significant challenge. Additionally, evolving regulatory landscapes and a growing consumer consciousness around health and sustainability can influence menu development and operational practices, requiring adaptation from industry players. However, the industry's resilience, demonstrated by its ability to innovate and cater to shifting consumer demands, suggests these challenges are likely to be navigated successfully. The dominance of North America in market share, with the United States, Canada, and Mexico as key contributors, highlights the region's established dining culture and its ongoing appetite for restaurant-based consumption.
Canadian Restaurant Industry Company Market Share
Canadian Restaurant Industry Market Outlook: Growth, Trends, and Competitive Landscape (2019-2033)
Unlock critical insights into the dynamic Canadian restaurant sector with this comprehensive market report. Covering the historical period of 2019-2024 and extending to a 2033 forecast, this analysis delves deep into market structure, innovation, consumer preferences, and growth drivers. With a base year of 2025, this report provides actionable intelligence for industry professionals seeking to navigate evolving market conditions, capitalize on emerging opportunities, and understand the competitive landscape shaped by key players and industry developments.
Canadian Restaurant Industry Market Structure & Innovation Trends
The Canadian restaurant industry exhibits a dynamic market structure characterized by a mix of large chains and independent operators. Market concentration varies across segments, with Quick Service Restaurants (QSRs) and Chained Outlets demonstrating higher consolidation. Innovation is a key driver, fueled by evolving consumer demands for convenience, health-conscious options, and unique culinary experiences. Regulatory frameworks, while supporting food safety and labor standards, also present compliance considerations for businesses. Product substitutes, ranging from meal kits to home cooking, influence market dynamics. End-user demographics, including a growing millennial and Gen Z population with distinct dining habits, significantly shape market trends. Mergers and acquisitions (M&A) activity, valued in the billions, underscores strategic consolidation and expansion efforts by major players aiming to enhance market share and diversify portfolios. For instance, recent acquisitions within the industry have reshaped competitive landscapes and expanded brand offerings.
Canadian Restaurant Industry Market Dynamics & Trends
The Canadian restaurant industry is poised for significant growth, projected to expand at a Compound Annual Growth Rate (CAGR) of approximately 4.5% over the forecast period. This expansion is driven by several key factors, including a rising disposable income, increasing urbanization, and a cultural shift towards dining out as a social and convenient activity. Technological disruptions are playing a pivotal role, with the proliferation of online ordering platforms, delivery apps, and ghost kitchens revolutionizing service delivery and operational efficiency. This has led to an estimated market penetration increase of nearly 15% in digital ordering channels. Consumer preferences are increasingly leaning towards healthier, sustainable, and ethically sourced food options, prompting operators to adapt their menus and sourcing strategies. The competitive landscape remains robust, with both established global brands and nimble local establishments vying for market share. The rise of experiential dining and personalized customer service further intensifies competition, pushing businesses to innovate and differentiate. The industry is also experiencing a growing demand for ethnic cuisines and plant-based alternatives, reflecting a more diverse and health-conscious consumer base. Investments in automation and data analytics are becoming crucial for optimizing operations, understanding customer behavior, and personalizing marketing efforts. The industry's resilience is evident in its ability to adapt to unforeseen challenges, such as economic fluctuations and shifts in consumer behavior, demonstrating a capacity for sustained growth and evolution. The total market valuation is estimated to reach over fifty billion dollars in the coming years.
Dominant Regions & Segments in Canadian Restaurant Industry
The Canadian restaurant industry's dominance is most pronounced in urban centers and highly populated provinces, with Ontario and Quebec leading in market size and economic contribution, estimated to contribute over twenty billion dollars annually. Within the Foodservice Type, Quick Service Restaurants (QSRs) currently hold the largest market share, driven by convenience and affordability, with the Burger and Pizza segments experiencing particularly strong performance. Chained Outlets dominate the market, accounting for an estimated 70% of all restaurant operations, benefiting from brand recognition, economies of scale, and standardized operational models. Retail locations and Standalone outlets represent significant market presence, catering to impulse purchases and destination dining respectively.
Key Drivers for QSR Dominance:
- Convenience: Fast service and accessibility for busy consumers.
- Affordability: Competitive pricing appealing to a broad demographic.
- Brand Recognition: Strong marketing and widespread brand awareness.
- Technological Integration: Efficient online ordering and delivery systems.
Dominance Analysis of Key Segments:
- Quick Service Restaurants (QSRs): Expected to continue its reign due to ongoing demand for fast, convenient, and value-driven food options. Burger and Pizza sub-segments will likely see sustained growth, fueled by new product introductions and aggressive promotional strategies. The market size for QSRs is projected to exceed thirty billion dollars.
- Full Service Restaurants (FSRs): While QSRs lead, FSRs, particularly North American and Asian cuisines, are experiencing a resurgence driven by a desire for elevated dining experiences and unique culinary explorations. The market for FSRs is estimated to reach fifteen billion dollars.
- Cafes & Bars: This segment, including Specialist Coffee & Tea Shops and Bars & Pubs, is a significant contributor, driven by social trends and demand for quality beverages and light fare. Their market size is estimated at eight billion dollars.
- Cloud Kitchens: Emerging as a disruptive force, cloud kitchens are gaining traction for their cost-efficiency and ability to serve multiple brands, projecting a market size of two billion dollars and rapid growth.
- Chained Outlets: Their dominance is underpinned by strategic expansion, effective supply chain management, and substantial marketing budgets, contributing over thirty-five billion dollars to the industry.
- Independent Outlets: These outlets cater to niche markets and offer unique dining experiences, contributing approximately fifteen billion dollars, and often thrive in specific local markets.
- Location - Retail: High foot traffic and impulse purchase opportunities make retail locations crucial for many restaurant brands, contributing over ten billion dollars.
- Location - Standalone: These sites offer greater flexibility in terms of concept and branding, contributing over twelve billion dollars.
Canadian Restaurant Industry Product Innovations
Product innovation in the Canadian restaurant industry is primarily focused on convenience, health, and unique flavors. There's a surge in plant-based menu options, gluten-free alternatives, and sustainably sourced ingredients, reflecting growing consumer demand. Ghost kitchens are facilitating the rapid launch of specialized virtual brands, catering to specific dietary needs or niche cuisines. Technology integration, such as AI-powered menu recommendations and personalized offers through loyalty programs, is enhancing customer engagement. Competitive advantages are being gained through unique flavor profiles, limited-time offers, and the adoption of advanced food preparation techniques. The market is seeing a rise in customizable meal options and meal kits, further blurring the lines between at-home and away-from-home dining.
Report Scope & Segmentation Analysis
This report meticulously analyzes the Canadian restaurant industry across key segments. The Foodservice Type is segmented into Cafes & Bars (including Bars & Pubs, Juice/Smoothie/Desserts Bars, and Specialist Coffee & Tea Shops), Cloud Kitchens, Full Service Restaurants (further categorized by Asian, European, Latin American, Middle Eastern, North American, and Other FSR Cuisines), and Quick Service Restaurants (comprising Bakeries, Burger, Ice Cream, Meat-based Cuisines, Pizza, and Other QSR Cuisines). The Outlet segmentation includes Chained Outlets and Independent Outlets, while the Location analysis covers Leisure, Lodging, Retail, Standalone, and Travel. Each segment's market size, growth projections, and competitive dynamics are assessed, providing a granular view of industry performance. For instance, the QSR segment is projected to maintain a significant market share exceeding thirty billion dollars, driven by strong demand for convenience.
Key Drivers of Canadian Restaurant Industry Growth
Several key factors are propelling the growth of the Canadian restaurant industry. Economically, rising disposable incomes and a strong post-pandemic recovery continue to fuel consumer spending on dining out. Technologically, the widespread adoption of digital ordering platforms, delivery apps, and automation in kitchens enhances efficiency and customer reach, with an estimated 30% increase in digital order volume. Regulatory environments, while presenting challenges, also foster fair competition and consumer trust. Furthermore, evolving consumer preferences for diverse culinary experiences, healthier options, and convenient meal solutions are creating new market opportunities. The industry's inherent resilience and adaptability to changing consumer behaviors remain a significant underlying driver.
Challenges in the Canadian Restaurant Industry Sector
The Canadian restaurant industry faces several significant challenges that impact its growth trajectory. Regulatory hurdles, including evolving food safety standards and labor laws, can increase operational costs and complexity, estimated to add 2% to operational expenses. Supply chain disruptions, exacerbated by global events and climate change, lead to price volatility and availability issues for key ingredients, impacting profit margins by up to 3%. Intense competition from both domestic and international players, coupled with rising real estate costs in prime locations, further pressures profitability. Labor shortages and the need for competitive wages also pose a considerable challenge, with an estimated 10% vacancy rate in key operational roles. Overcoming these barriers requires strategic planning and robust operational management.
Emerging Opportunities in Canadian Restaurant Industry
Emerging opportunities in the Canadian restaurant industry are abundant, driven by evolving consumer trends and technological advancements. The burgeoning demand for plant-based and sustainable food options presents a significant avenue for menu innovation and brand differentiation, with a projected market growth of 15% annually in this niche. The expansion of cloud kitchens and virtual restaurant brands offers a low-overhead model for entering new markets and catering to specific consumer demands, potentially adding over two billion dollars in market value. Experiential dining concepts, focusing on unique ambiance, interactive elements, and curated menus, are gaining traction, attracting consumers seeking more than just a meal. The continued growth of food delivery services and the integration of AI for personalized customer experiences also represent substantial opportunities for revenue enhancement and customer loyalty.
Leading Players in the Canadian Restaurant Industry Market
- A & W Food Services of Canada Inc
- Yum! Brands Inc
- Northland Properties Corporation
- Doctor's Associates Inc
- Inspire Brands Inc
- Seven & I Holdings Co Ltd
- RECIPE Unlimited Corporation
- The Wendy's Company
- Domino's Pizza Inc
Key Developments in Canadian Restaurant Industry Industry
- December 2022: 7-Eleven announced that it started increasing its footprint in Canada by converting a number of its restaurants into authorized outlets with fine dining seating.
- December 2022: MTY Food Group Inc., one of its wholly owned subsidiaries, acquired all of the issued and outstanding shares of COP WP Parent Inc. (Wetzel’s Pretzels) from CenterOak Partners. Wetzel’s Pretzels is an American chain of fast-food restaurants specializing in pretzels and hot dogs, operating in the United States, Canada, and Central America.
- November 2022: 7-Eleven declared the launch of its three new licensed 7-Eleven outlets in Edmonton with a few newly added food items on its menu.
Future Outlook for Canadian Restaurant Industry Market
The future outlook for the Canadian restaurant industry remains robust, with sustained growth anticipated over the forecast period. Market acceleration will be driven by ongoing innovation in plant-based and sustainable offerings, further expansion of digital ordering and delivery infrastructure, and the increasing popularity of experiential dining. Strategic M&A activities will likely continue, consolidating market power and fostering diversification. Cloud kitchens and virtual brands are expected to play an increasingly significant role, offering agility and cost-efficiency. The industry's adaptability to evolving consumer preferences, coupled with technological integration, positions it for continued resilience and expansion, with total market valuation expected to surpass sixty billion dollars.
Canadian Restaurant Industry Segmentation
-
1. Foodservice Type
-
1.1. Cafes & Bars
-
1.1.1. By Cuisine
- 1.1.1.1. Bars & Pubs
- 1.1.1.2. Juice/Smoothie/Desserts Bars
- 1.1.1.3. Specialist Coffee & Tea Shops
-
1.1.1. By Cuisine
- 1.2. Cloud Kitchen
-
1.3. Full Service Restaurants
- 1.3.1. Asian
- 1.3.2. European
- 1.3.3. Latin American
- 1.3.4. Middle Eastern
- 1.3.5. North American
- 1.3.6. Other FSR Cuisines
-
1.4. Quick Service Restaurants
- 1.4.1. Bakeries
- 1.4.2. Burger
- 1.4.3. Ice Cream
- 1.4.4. Meat-based Cuisines
- 1.4.5. Pizza
- 1.4.6. Other QSR Cuisines
-
1.1. Cafes & Bars
-
2. Outlet
- 2.1. Chained Outlets
- 2.2. Independent Outlets
-
3. Location
- 3.1. Leisure
- 3.2. Lodging
- 3.3. Retail
- 3.4. Standalone
- 3.5. Travel
Canadian Restaurant Industry Segmentation By Geography
-
1. North America
- 1.1. United States
- 1.2. Canada
- 1.3. Mexico
-
2. South America
- 2.1. Brazil
- 2.2. Argentina
- 2.3. Rest of South America
-
3. Europe
- 3.1. United Kingdom
- 3.2. Germany
- 3.3. France
- 3.4. Italy
- 3.5. Spain
- 3.6. Russia
- 3.7. Benelux
- 3.8. Nordics
- 3.9. Rest of Europe
-
4. Middle East & Africa
- 4.1. Turkey
- 4.2. Israel
- 4.3. GCC
- 4.4. North Africa
- 4.5. South Africa
- 4.6. Rest of Middle East & Africa
-
5. Asia Pacific
- 5.1. China
- 5.2. India
- 5.3. Japan
- 5.4. South Korea
- 5.5. ASEAN
- 5.6. Oceania
- 5.7. Rest of Asia Pacific
Canadian Restaurant Industry Regional Market Share
Geographic Coverage of Canadian Restaurant Industry
Canadian Restaurant Industry REPORT HIGHLIGHTS
| Aspects | Details |
|---|---|
| Study Period | 2020-2034 |
| Base Year | 2025 |
| Estimated Year | 2026 |
| Forecast Period | 2026-2034 |
| Historical Period | 2020-2025 |
| Growth Rate | CAGR of 9.8% from 2020-2034 |
| Segmentation |
|
Table of Contents
- 1. Introduction
- 1.1. Research Scope
- 1.2. Market Segmentation
- 1.3. Research Objective
- 1.4. Definitions and Assumptions
- 2. Executive Summary
- 2.1. Market Snapshot
- 3. Market Dynamics
- 3.1. Market Drivers
- 3.2. Market Restrains
- 3.3. Market Trends
- 3.4. Market Opportunities
- 4. Market Factor Analysis
- 4.1. Porters Five Forces
- 4.1.1. Bargaining Power of Suppliers
- 4.1.2. Bargaining Power of Buyers
- 4.1.3. Threat of New Entrants
- 4.1.4. Threat of Substitutes
- 4.1.5. Competitive Rivalry
- 4.2. PESTEL analysis
- 4.3. BCG Analysis
- 4.3.1. Stars (High Growth, High Market Share)
- 4.3.2. Cash Cows (Low Growth, High Market Share)
- 4.3.3. Question Mark (High Growth, Low Market Share)
- 4.3.4. Dogs (Low Growth, Low Market Share)
- 4.4. Ansoff Matrix Analysis
- 4.5. Supply Chain Analysis
- 4.6. Regulatory Landscape
- 4.7. Current Market Potential and Opportunity Assessment (TAM–SAM–SOM Framework)
- 4.8. PRI Analyst Note
- 4.1. Porters Five Forces
- 5. Market Analysis, Insights and Forecast 2021-2033
- 5.1. Market Analysis, Insights and Forecast - by Foodservice Type
- 5.1.1. Cafes & Bars
- 5.1.1.1. By Cuisine
- 5.1.1.1.1. Bars & Pubs
- 5.1.1.1.2. Juice/Smoothie/Desserts Bars
- 5.1.1.1.3. Specialist Coffee & Tea Shops
- 5.1.1.1. By Cuisine
- 5.1.2. Cloud Kitchen
- 5.1.3. Full Service Restaurants
- 5.1.3.1. Asian
- 5.1.3.2. European
- 5.1.3.3. Latin American
- 5.1.3.4. Middle Eastern
- 5.1.3.5. North American
- 5.1.3.6. Other FSR Cuisines
- 5.1.4. Quick Service Restaurants
- 5.1.4.1. Bakeries
- 5.1.4.2. Burger
- 5.1.4.3. Ice Cream
- 5.1.4.4. Meat-based Cuisines
- 5.1.4.5. Pizza
- 5.1.4.6. Other QSR Cuisines
- 5.1.1. Cafes & Bars
- 5.2. Market Analysis, Insights and Forecast - by Outlet
- 5.2.1. Chained Outlets
- 5.2.2. Independent Outlets
- 5.3. Market Analysis, Insights and Forecast - by Location
- 5.3.1. Leisure
- 5.3.2. Lodging
- 5.3.3. Retail
- 5.3.4. Standalone
- 5.3.5. Travel
- 5.4. Market Analysis, Insights and Forecast - by Region
- 5.4.1. North America
- 5.4.2. South America
- 5.4.3. Europe
- 5.4.4. Middle East & Africa
- 5.4.5. Asia Pacific
- 5.1. Market Analysis, Insights and Forecast - by Foodservice Type
- 6. Global Canadian Restaurant Industry Analysis, Insights and Forecast, 2021-2033
- 6.1. Market Analysis, Insights and Forecast - by Foodservice Type
- 6.1.1. Cafes & Bars
- 6.1.1.1. By Cuisine
- 6.1.1.1.1. Bars & Pubs
- 6.1.1.1.2. Juice/Smoothie/Desserts Bars
- 6.1.1.1.3. Specialist Coffee & Tea Shops
- 6.1.1.1. By Cuisine
- 6.1.2. Cloud Kitchen
- 6.1.3. Full Service Restaurants
- 6.1.3.1. Asian
- 6.1.3.2. European
- 6.1.3.3. Latin American
- 6.1.3.4. Middle Eastern
- 6.1.3.5. North American
- 6.1.3.6. Other FSR Cuisines
- 6.1.4. Quick Service Restaurants
- 6.1.4.1. Bakeries
- 6.1.4.2. Burger
- 6.1.4.3. Ice Cream
- 6.1.4.4. Meat-based Cuisines
- 6.1.4.5. Pizza
- 6.1.4.6. Other QSR Cuisines
- 6.1.1. Cafes & Bars
- 6.2. Market Analysis, Insights and Forecast - by Outlet
- 6.2.1. Chained Outlets
- 6.2.2. Independent Outlets
- 6.3. Market Analysis, Insights and Forecast - by Location
- 6.3.1. Leisure
- 6.3.2. Lodging
- 6.3.3. Retail
- 6.3.4. Standalone
- 6.3.5. Travel
- 6.1. Market Analysis, Insights and Forecast - by Foodservice Type
- 7. North America Canadian Restaurant Industry Analysis, Insights and Forecast, 2020-2032
- 7.1. Market Analysis, Insights and Forecast - by Foodservice Type
- 7.1.1. Cafes & Bars
- 7.1.1.1. By Cuisine
- 7.1.1.1.1. Bars & Pubs
- 7.1.1.1.2. Juice/Smoothie/Desserts Bars
- 7.1.1.1.3. Specialist Coffee & Tea Shops
- 7.1.1.1. By Cuisine
- 7.1.2. Cloud Kitchen
- 7.1.3. Full Service Restaurants
- 7.1.3.1. Asian
- 7.1.3.2. European
- 7.1.3.3. Latin American
- 7.1.3.4. Middle Eastern
- 7.1.3.5. North American
- 7.1.3.6. Other FSR Cuisines
- 7.1.4. Quick Service Restaurants
- 7.1.4.1. Bakeries
- 7.1.4.2. Burger
- 7.1.4.3. Ice Cream
- 7.1.4.4. Meat-based Cuisines
- 7.1.4.5. Pizza
- 7.1.4.6. Other QSR Cuisines
- 7.1.1. Cafes & Bars
- 7.2. Market Analysis, Insights and Forecast - by Outlet
- 7.2.1. Chained Outlets
- 7.2.2. Independent Outlets
- 7.3. Market Analysis, Insights and Forecast - by Location
- 7.3.1. Leisure
- 7.3.2. Lodging
- 7.3.3. Retail
- 7.3.4. Standalone
- 7.3.5. Travel
- 7.1. Market Analysis, Insights and Forecast - by Foodservice Type
- 8. South America Canadian Restaurant Industry Analysis, Insights and Forecast, 2020-2032
- 8.1. Market Analysis, Insights and Forecast - by Foodservice Type
- 8.1.1. Cafes & Bars
- 8.1.1.1. By Cuisine
- 8.1.1.1.1. Bars & Pubs
- 8.1.1.1.2. Juice/Smoothie/Desserts Bars
- 8.1.1.1.3. Specialist Coffee & Tea Shops
- 8.1.1.1. By Cuisine
- 8.1.2. Cloud Kitchen
- 8.1.3. Full Service Restaurants
- 8.1.3.1. Asian
- 8.1.3.2. European
- 8.1.3.3. Latin American
- 8.1.3.4. Middle Eastern
- 8.1.3.5. North American
- 8.1.3.6. Other FSR Cuisines
- 8.1.4. Quick Service Restaurants
- 8.1.4.1. Bakeries
- 8.1.4.2. Burger
- 8.1.4.3. Ice Cream
- 8.1.4.4. Meat-based Cuisines
- 8.1.4.5. Pizza
- 8.1.4.6. Other QSR Cuisines
- 8.1.1. Cafes & Bars
- 8.2. Market Analysis, Insights and Forecast - by Outlet
- 8.2.1. Chained Outlets
- 8.2.2. Independent Outlets
- 8.3. Market Analysis, Insights and Forecast - by Location
- 8.3.1. Leisure
- 8.3.2. Lodging
- 8.3.3. Retail
- 8.3.4. Standalone
- 8.3.5. Travel
- 8.1. Market Analysis, Insights and Forecast - by Foodservice Type
- 9. Europe Canadian Restaurant Industry Analysis, Insights and Forecast, 2020-2032
- 9.1. Market Analysis, Insights and Forecast - by Foodservice Type
- 9.1.1. Cafes & Bars
- 9.1.1.1. By Cuisine
- 9.1.1.1.1. Bars & Pubs
- 9.1.1.1.2. Juice/Smoothie/Desserts Bars
- 9.1.1.1.3. Specialist Coffee & Tea Shops
- 9.1.1.1. By Cuisine
- 9.1.2. Cloud Kitchen
- 9.1.3. Full Service Restaurants
- 9.1.3.1. Asian
- 9.1.3.2. European
- 9.1.3.3. Latin American
- 9.1.3.4. Middle Eastern
- 9.1.3.5. North American
- 9.1.3.6. Other FSR Cuisines
- 9.1.4. Quick Service Restaurants
- 9.1.4.1. Bakeries
- 9.1.4.2. Burger
- 9.1.4.3. Ice Cream
- 9.1.4.4. Meat-based Cuisines
- 9.1.4.5. Pizza
- 9.1.4.6. Other QSR Cuisines
- 9.1.1. Cafes & Bars
- 9.2. Market Analysis, Insights and Forecast - by Outlet
- 9.2.1. Chained Outlets
- 9.2.2. Independent Outlets
- 9.3. Market Analysis, Insights and Forecast - by Location
- 9.3.1. Leisure
- 9.3.2. Lodging
- 9.3.3. Retail
- 9.3.4. Standalone
- 9.3.5. Travel
- 9.1. Market Analysis, Insights and Forecast - by Foodservice Type
- 10. Middle East & Africa Canadian Restaurant Industry Analysis, Insights and Forecast, 2020-2032
- 10.1. Market Analysis, Insights and Forecast - by Foodservice Type
- 10.1.1. Cafes & Bars
- 10.1.1.1. By Cuisine
- 10.1.1.1.1. Bars & Pubs
- 10.1.1.1.2. Juice/Smoothie/Desserts Bars
- 10.1.1.1.3. Specialist Coffee & Tea Shops
- 10.1.1.1. By Cuisine
- 10.1.2. Cloud Kitchen
- 10.1.3. Full Service Restaurants
- 10.1.3.1. Asian
- 10.1.3.2. European
- 10.1.3.3. Latin American
- 10.1.3.4. Middle Eastern
- 10.1.3.5. North American
- 10.1.3.6. Other FSR Cuisines
- 10.1.4. Quick Service Restaurants
- 10.1.4.1. Bakeries
- 10.1.4.2. Burger
- 10.1.4.3. Ice Cream
- 10.1.4.4. Meat-based Cuisines
- 10.1.4.5. Pizza
- 10.1.4.6. Other QSR Cuisines
- 10.1.1. Cafes & Bars
- 10.2. Market Analysis, Insights and Forecast - by Outlet
- 10.2.1. Chained Outlets
- 10.2.2. Independent Outlets
- 10.3. Market Analysis, Insights and Forecast - by Location
- 10.3.1. Leisure
- 10.3.2. Lodging
- 10.3.3. Retail
- 10.3.4. Standalone
- 10.3.5. Travel
- 10.1. Market Analysis, Insights and Forecast - by Foodservice Type
- 11. Asia Pacific Canadian Restaurant Industry Analysis, Insights and Forecast, 2020-2032
- 11.1. Market Analysis, Insights and Forecast - by Foodservice Type
- 11.1.1. Cafes & Bars
- 11.1.1.1. By Cuisine
- 11.1.1.1.1. Bars & Pubs
- 11.1.1.1.2. Juice/Smoothie/Desserts Bars
- 11.1.1.1.3. Specialist Coffee & Tea Shops
- 11.1.1.1. By Cuisine
- 11.1.2. Cloud Kitchen
- 11.1.3. Full Service Restaurants
- 11.1.3.1. Asian
- 11.1.3.2. European
- 11.1.3.3. Latin American
- 11.1.3.4. Middle Eastern
- 11.1.3.5. North American
- 11.1.3.6. Other FSR Cuisines
- 11.1.4. Quick Service Restaurants
- 11.1.4.1. Bakeries
- 11.1.4.2. Burger
- 11.1.4.3. Ice Cream
- 11.1.4.4. Meat-based Cuisines
- 11.1.4.5. Pizza
- 11.1.4.6. Other QSR Cuisines
- 11.1.1. Cafes & Bars
- 11.2. Market Analysis, Insights and Forecast - by Outlet
- 11.2.1. Chained Outlets
- 11.2.2. Independent Outlets
- 11.3. Market Analysis, Insights and Forecast - by Location
- 11.3.1. Leisure
- 11.3.2. Lodging
- 11.3.3. Retail
- 11.3.4. Standalone
- 11.3.5. Travel
- 11.1. Market Analysis, Insights and Forecast - by Foodservice Type
- 12. Competitive Analysis
- 12.1. Company Profiles
- 12.1.1 A & W Food Services of Canada Inc
- 12.1.1.1. Company Overview
- 12.1.1.2. Products
- 12.1.1.3. Company Financials
- 12.1.1.4. SWOT Analysis
- 12.1.2 Yum! Brands Inc
- 12.1.2.1. Company Overview
- 12.1.2.2. Products
- 12.1.2.3. Company Financials
- 12.1.2.4. SWOT Analysis
- 12.1.3 Northland Properties Corporation
- 12.1.3.1. Company Overview
- 12.1.3.2. Products
- 12.1.3.3. Company Financials
- 12.1.3.4. SWOT Analysis
- 12.1.4 Doctor's Associates Inc
- 12.1.4.1. Company Overview
- 12.1.4.2. Products
- 12.1.4.3. Company Financials
- 12.1.4.4. SWOT Analysis
- 12.1.5 Inspire Brands Inc
- 12.1.5.1. Company Overview
- 12.1.5.2. Products
- 12.1.5.3. Company Financials
- 12.1.5.4. SWOT Analysis
- 12.1.6 Seven & I Holdings Co Ltd
- 12.1.6.1. Company Overview
- 12.1.6.2. Products
- 12.1.6.3. Company Financials
- 12.1.6.4. SWOT Analysis
- 12.1.7 RECIPE Unlimited Corporation
- 12.1.7.1. Company Overview
- 12.1.7.2. Products
- 12.1.7.3. Company Financials
- 12.1.7.4. SWOT Analysis
- 12.1.8 The Wendy's Company
- 12.1.8.1. Company Overview
- 12.1.8.2. Products
- 12.1.8.3. Company Financials
- 12.1.8.4. SWOT Analysis
- 12.1.9 Domino's Pizza Inc
- 12.1.9.1. Company Overview
- 12.1.9.2. Products
- 12.1.9.3. Company Financials
- 12.1.9.4. SWOT Analysis
- 12.1.1 A & W Food Services of Canada Inc
- 12.2. Market Entropy
- 12.2.1 Company's Key Areas Served
- 12.2.2 Recent Developments
- 12.3. Company Market Share Analysis 2025
- 12.3.1 Top 5 Companies Market Share Analysis
- 12.3.2 Top 3 Companies Market Share Analysis
- 12.4. List of Potential Customers
- 13. Research Methodology
List of Figures
- Figure 1: Global Canadian Restaurant Industry Revenue Breakdown (billion, %) by Region 2025 & 2033
- Figure 2: North America Canadian Restaurant Industry Revenue (billion), by Foodservice Type 2025 & 2033
- Figure 3: North America Canadian Restaurant Industry Revenue Share (%), by Foodservice Type 2025 & 2033
- Figure 4: North America Canadian Restaurant Industry Revenue (billion), by Outlet 2025 & 2033
- Figure 5: North America Canadian Restaurant Industry Revenue Share (%), by Outlet 2025 & 2033
- Figure 6: North America Canadian Restaurant Industry Revenue (billion), by Location 2025 & 2033
- Figure 7: North America Canadian Restaurant Industry Revenue Share (%), by Location 2025 & 2033
- Figure 8: North America Canadian Restaurant Industry Revenue (billion), by Country 2025 & 2033
- Figure 9: North America Canadian Restaurant Industry Revenue Share (%), by Country 2025 & 2033
- Figure 10: South America Canadian Restaurant Industry Revenue (billion), by Foodservice Type 2025 & 2033
- Figure 11: South America Canadian Restaurant Industry Revenue Share (%), by Foodservice Type 2025 & 2033
- Figure 12: South America Canadian Restaurant Industry Revenue (billion), by Outlet 2025 & 2033
- Figure 13: South America Canadian Restaurant Industry Revenue Share (%), by Outlet 2025 & 2033
- Figure 14: South America Canadian Restaurant Industry Revenue (billion), by Location 2025 & 2033
- Figure 15: South America Canadian Restaurant Industry Revenue Share (%), by Location 2025 & 2033
- Figure 16: South America Canadian Restaurant Industry Revenue (billion), by Country 2025 & 2033
- Figure 17: South America Canadian Restaurant Industry Revenue Share (%), by Country 2025 & 2033
- Figure 18: Europe Canadian Restaurant Industry Revenue (billion), by Foodservice Type 2025 & 2033
- Figure 19: Europe Canadian Restaurant Industry Revenue Share (%), by Foodservice Type 2025 & 2033
- Figure 20: Europe Canadian Restaurant Industry Revenue (billion), by Outlet 2025 & 2033
- Figure 21: Europe Canadian Restaurant Industry Revenue Share (%), by Outlet 2025 & 2033
- Figure 22: Europe Canadian Restaurant Industry Revenue (billion), by Location 2025 & 2033
- Figure 23: Europe Canadian Restaurant Industry Revenue Share (%), by Location 2025 & 2033
- Figure 24: Europe Canadian Restaurant Industry Revenue (billion), by Country 2025 & 2033
- Figure 25: Europe Canadian Restaurant Industry Revenue Share (%), by Country 2025 & 2033
- Figure 26: Middle East & Africa Canadian Restaurant Industry Revenue (billion), by Foodservice Type 2025 & 2033
- Figure 27: Middle East & Africa Canadian Restaurant Industry Revenue Share (%), by Foodservice Type 2025 & 2033
- Figure 28: Middle East & Africa Canadian Restaurant Industry Revenue (billion), by Outlet 2025 & 2033
- Figure 29: Middle East & Africa Canadian Restaurant Industry Revenue Share (%), by Outlet 2025 & 2033
- Figure 30: Middle East & Africa Canadian Restaurant Industry Revenue (billion), by Location 2025 & 2033
- Figure 31: Middle East & Africa Canadian Restaurant Industry Revenue Share (%), by Location 2025 & 2033
- Figure 32: Middle East & Africa Canadian Restaurant Industry Revenue (billion), by Country 2025 & 2033
- Figure 33: Middle East & Africa Canadian Restaurant Industry Revenue Share (%), by Country 2025 & 2033
- Figure 34: Asia Pacific Canadian Restaurant Industry Revenue (billion), by Foodservice Type 2025 & 2033
- Figure 35: Asia Pacific Canadian Restaurant Industry Revenue Share (%), by Foodservice Type 2025 & 2033
- Figure 36: Asia Pacific Canadian Restaurant Industry Revenue (billion), by Outlet 2025 & 2033
- Figure 37: Asia Pacific Canadian Restaurant Industry Revenue Share (%), by Outlet 2025 & 2033
- Figure 38: Asia Pacific Canadian Restaurant Industry Revenue (billion), by Location 2025 & 2033
- Figure 39: Asia Pacific Canadian Restaurant Industry Revenue Share (%), by Location 2025 & 2033
- Figure 40: Asia Pacific Canadian Restaurant Industry Revenue (billion), by Country 2025 & 2033
- Figure 41: Asia Pacific Canadian Restaurant Industry Revenue Share (%), by Country 2025 & 2033
List of Tables
- Table 1: Global Canadian Restaurant Industry Revenue billion Forecast, by Foodservice Type 2020 & 2033
- Table 2: Global Canadian Restaurant Industry Revenue billion Forecast, by Outlet 2020 & 2033
- Table 3: Global Canadian Restaurant Industry Revenue billion Forecast, by Location 2020 & 2033
- Table 4: Global Canadian Restaurant Industry Revenue billion Forecast, by Region 2020 & 2033
- Table 5: Global Canadian Restaurant Industry Revenue billion Forecast, by Foodservice Type 2020 & 2033
- Table 6: Global Canadian Restaurant Industry Revenue billion Forecast, by Outlet 2020 & 2033
- Table 7: Global Canadian Restaurant Industry Revenue billion Forecast, by Location 2020 & 2033
- Table 8: Global Canadian Restaurant Industry Revenue billion Forecast, by Country 2020 & 2033
- Table 9: United States Canadian Restaurant Industry Revenue (billion) Forecast, by Application 2020 & 2033
- Table 10: Canada Canadian Restaurant Industry Revenue (billion) Forecast, by Application 2020 & 2033
- Table 11: Mexico Canadian Restaurant Industry Revenue (billion) Forecast, by Application 2020 & 2033
- Table 12: Global Canadian Restaurant Industry Revenue billion Forecast, by Foodservice Type 2020 & 2033
- Table 13: Global Canadian Restaurant Industry Revenue billion Forecast, by Outlet 2020 & 2033
- Table 14: Global Canadian Restaurant Industry Revenue billion Forecast, by Location 2020 & 2033
- Table 15: Global Canadian Restaurant Industry Revenue billion Forecast, by Country 2020 & 2033
- Table 16: Brazil Canadian Restaurant Industry Revenue (billion) Forecast, by Application 2020 & 2033
- Table 17: Argentina Canadian Restaurant Industry Revenue (billion) Forecast, by Application 2020 & 2033
- Table 18: Rest of South America Canadian Restaurant Industry Revenue (billion) Forecast, by Application 2020 & 2033
- Table 19: Global Canadian Restaurant Industry Revenue billion Forecast, by Foodservice Type 2020 & 2033
- Table 20: Global Canadian Restaurant Industry Revenue billion Forecast, by Outlet 2020 & 2033
- Table 21: Global Canadian Restaurant Industry Revenue billion Forecast, by Location 2020 & 2033
- Table 22: Global Canadian Restaurant Industry Revenue billion Forecast, by Country 2020 & 2033
- Table 23: United Kingdom Canadian Restaurant Industry Revenue (billion) Forecast, by Application 2020 & 2033
- Table 24: Germany Canadian Restaurant Industry Revenue (billion) Forecast, by Application 2020 & 2033
- Table 25: France Canadian Restaurant Industry Revenue (billion) Forecast, by Application 2020 & 2033
- Table 26: Italy Canadian Restaurant Industry Revenue (billion) Forecast, by Application 2020 & 2033
- Table 27: Spain Canadian Restaurant Industry Revenue (billion) Forecast, by Application 2020 & 2033
- Table 28: Russia Canadian Restaurant Industry Revenue (billion) Forecast, by Application 2020 & 2033
- Table 29: Benelux Canadian Restaurant Industry Revenue (billion) Forecast, by Application 2020 & 2033
- Table 30: Nordics Canadian Restaurant Industry Revenue (billion) Forecast, by Application 2020 & 2033
- Table 31: Rest of Europe Canadian Restaurant Industry Revenue (billion) Forecast, by Application 2020 & 2033
- Table 32: Global Canadian Restaurant Industry Revenue billion Forecast, by Foodservice Type 2020 & 2033
- Table 33: Global Canadian Restaurant Industry Revenue billion Forecast, by Outlet 2020 & 2033
- Table 34: Global Canadian Restaurant Industry Revenue billion Forecast, by Location 2020 & 2033
- Table 35: Global Canadian Restaurant Industry Revenue billion Forecast, by Country 2020 & 2033
- Table 36: Turkey Canadian Restaurant Industry Revenue (billion) Forecast, by Application 2020 & 2033
- Table 37: Israel Canadian Restaurant Industry Revenue (billion) Forecast, by Application 2020 & 2033
- Table 38: GCC Canadian Restaurant Industry Revenue (billion) Forecast, by Application 2020 & 2033
- Table 39: North Africa Canadian Restaurant Industry Revenue (billion) Forecast, by Application 2020 & 2033
- Table 40: South Africa Canadian Restaurant Industry Revenue (billion) Forecast, by Application 2020 & 2033
- Table 41: Rest of Middle East & Africa Canadian Restaurant Industry Revenue (billion) Forecast, by Application 2020 & 2033
- Table 42: Global Canadian Restaurant Industry Revenue billion Forecast, by Foodservice Type 2020 & 2033
- Table 43: Global Canadian Restaurant Industry Revenue billion Forecast, by Outlet 2020 & 2033
- Table 44: Global Canadian Restaurant Industry Revenue billion Forecast, by Location 2020 & 2033
- Table 45: Global Canadian Restaurant Industry Revenue billion Forecast, by Country 2020 & 2033
- Table 46: China Canadian Restaurant Industry Revenue (billion) Forecast, by Application 2020 & 2033
- Table 47: India Canadian Restaurant Industry Revenue (billion) Forecast, by Application 2020 & 2033
- Table 48: Japan Canadian Restaurant Industry Revenue (billion) Forecast, by Application 2020 & 2033
- Table 49: South Korea Canadian Restaurant Industry Revenue (billion) Forecast, by Application 2020 & 2033
- Table 50: ASEAN Canadian Restaurant Industry Revenue (billion) Forecast, by Application 2020 & 2033
- Table 51: Oceania Canadian Restaurant Industry Revenue (billion) Forecast, by Application 2020 & 2033
- Table 52: Rest of Asia Pacific Canadian Restaurant Industry Revenue (billion) Forecast, by Application 2020 & 2033
Frequently Asked Questions
1. What is the projected Compound Annual Growth Rate (CAGR) of the Canadian Restaurant Industry?
The projected CAGR is approximately 9.8%.
2. Which companies are prominent players in the Canadian Restaurant Industry?
Key companies in the market include A & W Food Services of Canada Inc, Yum! Brands Inc, Northland Properties Corporation, Doctor's Associates Inc, Inspire Brands Inc, Seven & I Holdings Co Ltd, RECIPE Unlimited Corporation, The Wendy's Company, Domino's Pizza Inc.
3. What are the main segments of the Canadian Restaurant Industry?
The market segments include Foodservice Type, Outlet, Location.
4. Can you provide details about the market size?
The market size is estimated to be USD 47.2 billion as of 2022.
5. What are some drivers contributing to market growth?
Increasing Urbanization; Growing Disposable Income.
6. What are the notable trends driving market growth?
Increase in number of QSRs and street food vendors owing to the rise in popularity of on-the-go meals.
7. Are there any restraints impacting market growth?
High-price and additional delivery charges.
8. Can you provide examples of recent developments in the market?
December 2022: 7-Eleven announced that it started increasing its footprint in Canada by converting a number of its restaurants into authorized outlets with fine dining seating.December 2022: MTY Food Group Inc., one of its wholly owned subsidiaries, acquired all of the issued and outstanding shares of COP WP Parent Inc. (Wetzel’s Pretzels) from CenterOak Partners. Wetzel’s Pretzels is an American chain of fast-food restaurants specializing in pretzels and hot dogs, operating in the United States, Canada, and Central America.November 2022: 7-Eleven declared the launch of its three new licensed 7-Eleven outlets in Edmonton with a few newly added food items on its menu.
9. What pricing options are available for accessing the report?
Pricing options include single-user, multi-user, and enterprise licenses priced at USD 3800, USD 4500, and USD 5800 respectively.
10. Is the market size provided in terms of value or volume?
The market size is provided in terms of value, measured in billion.
11. Are there any specific market keywords associated with the report?
Yes, the market keyword associated with the report is "Canadian Restaurant Industry," which aids in identifying and referencing the specific market segment covered.
12. How do I determine which pricing option suits my needs best?
The pricing options vary based on user requirements and access needs. Individual users may opt for single-user licenses, while businesses requiring broader access may choose multi-user or enterprise licenses for cost-effective access to the report.
13. Are there any additional resources or data provided in the Canadian Restaurant Industry report?
While the report offers comprehensive insights, it's advisable to review the specific contents or supplementary materials provided to ascertain if additional resources or data are available.
14. How can I stay updated on further developments or reports in the Canadian Restaurant Industry?
To stay informed about further developments, trends, and reports in the Canadian Restaurant Industry, consider subscribing to industry newsletters, following relevant companies and organizations, or regularly checking reputable industry news sources and publications.
Methodology
Step 1 - Identification of Relevant Samples Size from Population Database


Step 2 - Approaches for Defining Global Market Size (Value, Volume* & Price*)

Note*: In applicable scenarios
Step 3 - Data Sources
Primary Research
- Web Analytics
- Survey Reports
- Research Institute
- Latest Research Reports
- Opinion Leaders
Secondary Research
- Annual Reports
- White Paper
- Latest Press Release
- Industry Association
- Paid Database
- Investor Presentations

Step 4 - Data Triangulation
Involves using different sources of information in order to increase the validity of a study
These sources are likely to be stakeholders in a program - participants, other researchers, program staff, other community members, and so on.
Then we put all data in single framework & apply various statistical tools to find out the dynamic on the market.
During the analysis stage, feedback from the stakeholder groups would be compared to determine areas of agreement as well as areas of divergence