

Key Insights
The global Clean Label Ingredients market is poised for substantial growth, estimated at $42.76 million in 2025, with a projected Compound Annual Growth Rate (CAGR) of 6.51% through 2033. This robust expansion is driven by an escalating consumer demand for natural, minimally processed, and transparently sourced food ingredients. Key market drivers include the increasing awareness of health and wellness, the desire to avoid artificial additives, and stringent regulatory landscapes that favor cleaner formulations. The market is segmented into various product types, including Food Preservatives, Food Sweeteners, Food Colorants, Food Hydrocolloids, and Food Flavors and Enhancers. The Bakery and Confectionery, Dairy and Frozen Desserts, Beverages, and Meat and Meat Products sectors are anticipated to be the leading application areas, reflecting the widespread integration of clean label solutions across the food industry. Trends such as the rise of plant-based ingredients, demand for traceable supply chains, and innovation in natural preservation techniques are shaping the market's trajectory.
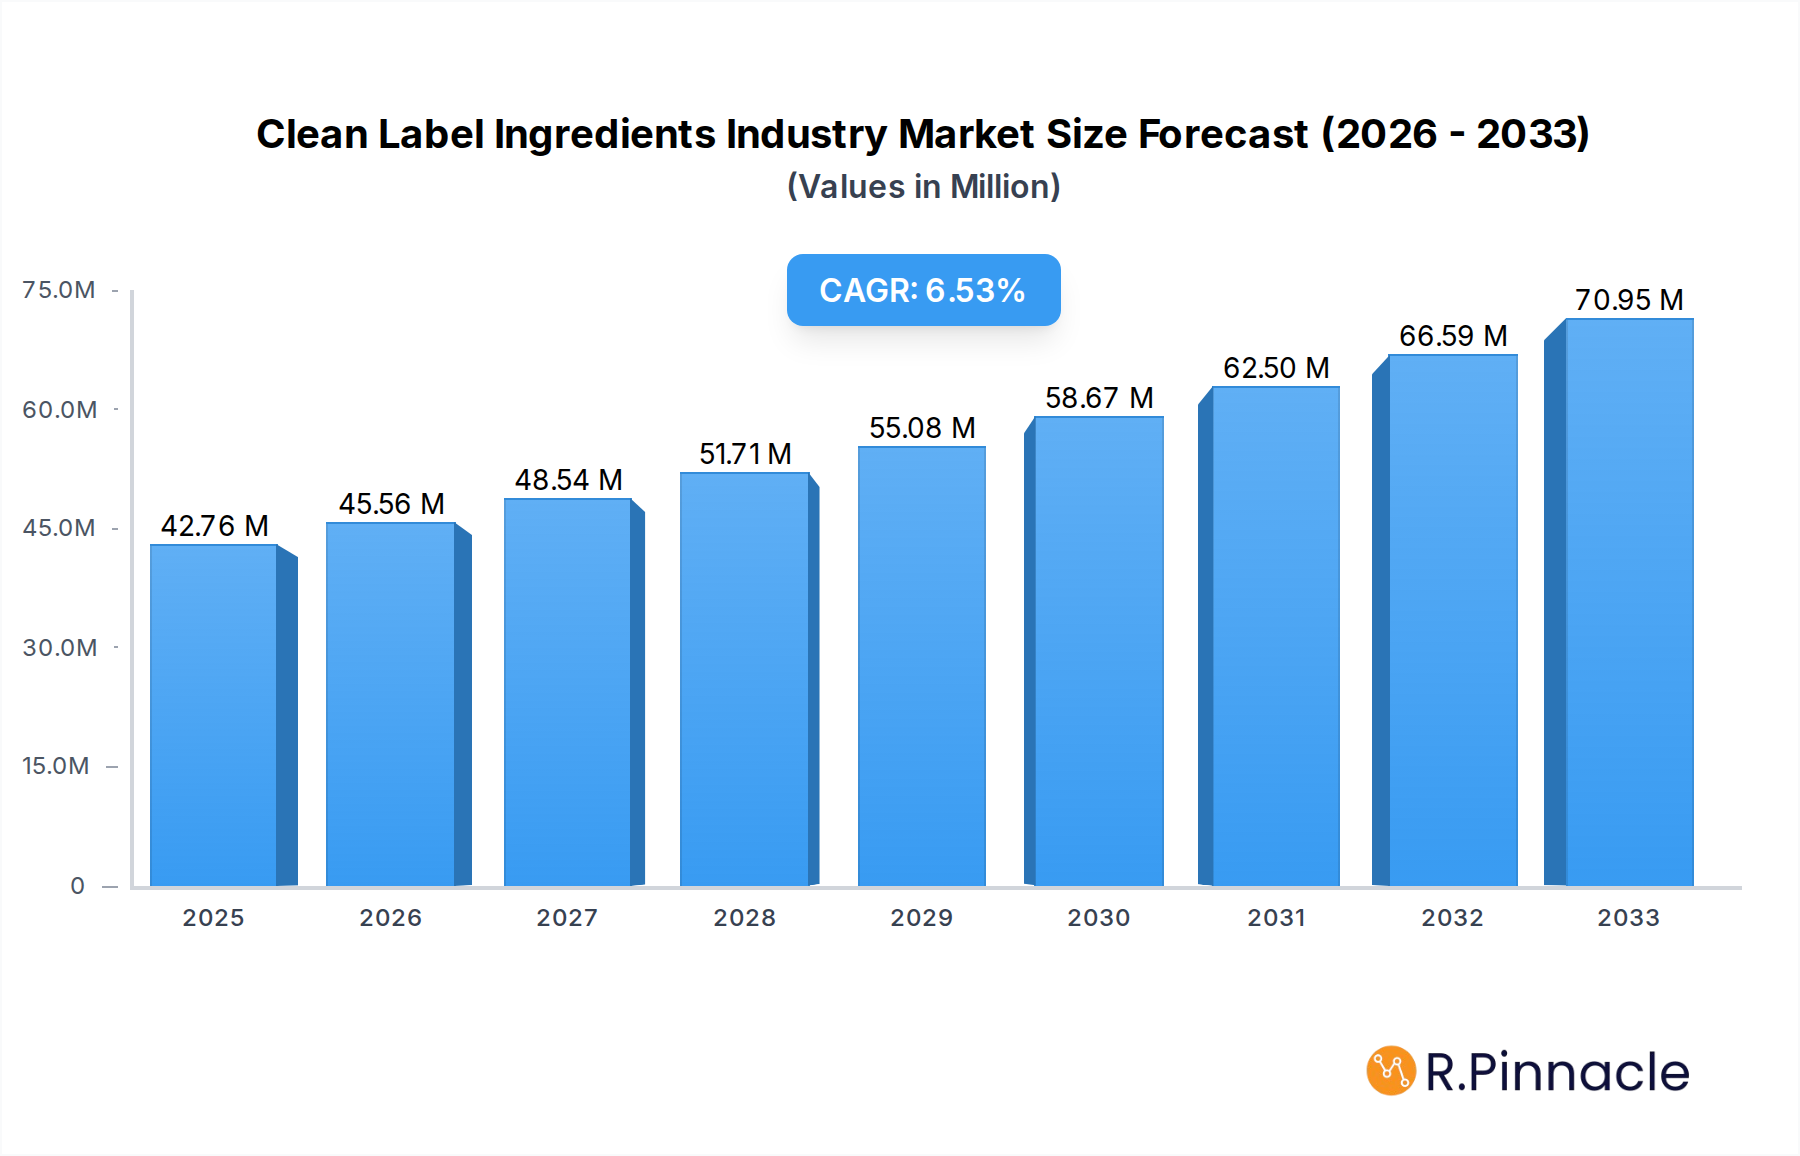
Clean Label Ingredients Industry Market Size (In Million)
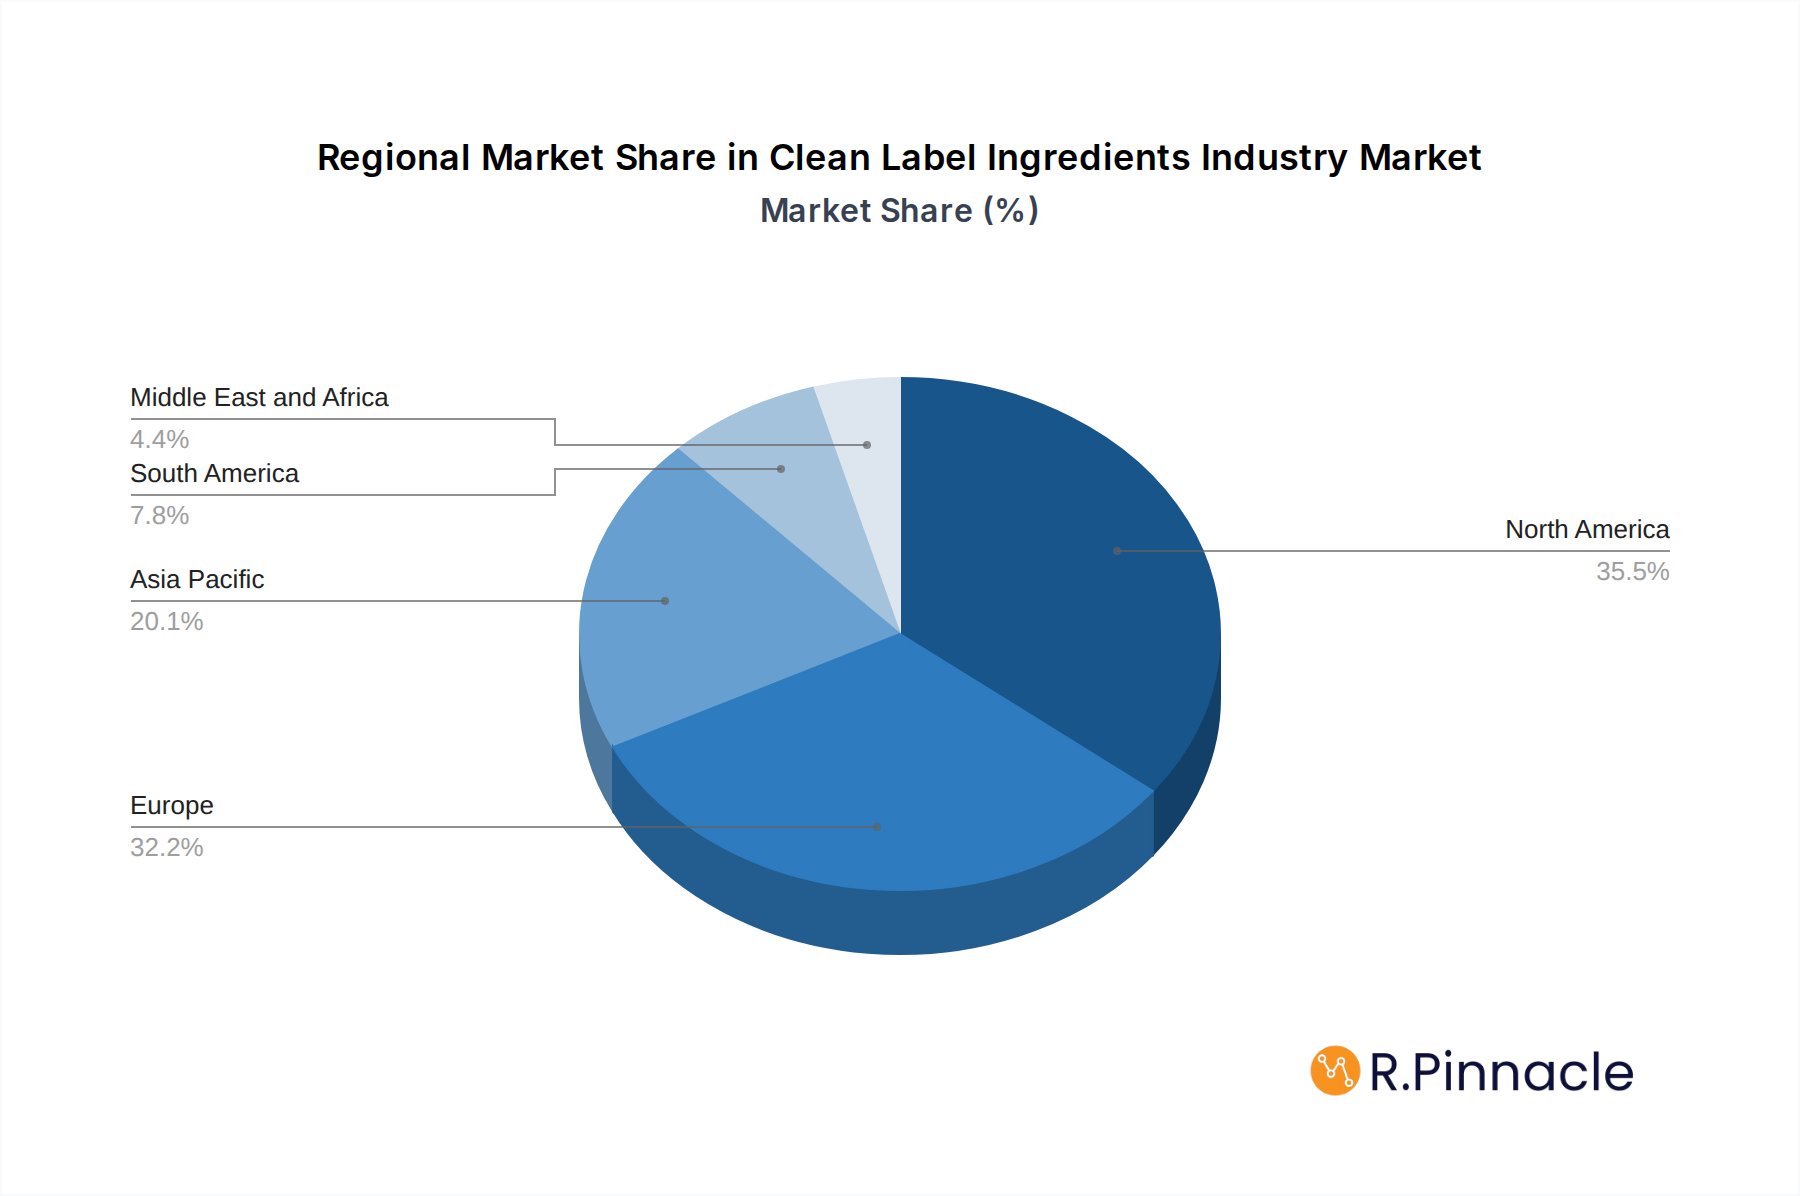
Despite the promising growth, the Clean Label Ingredients market faces certain restraints. High raw material costs, potential supply chain complexities for natural ingredients, and the technical challenges associated with reformulating products to maintain taste, texture, and shelf-life without artificial additives can pose hurdles. However, ongoing research and development, coupled with strategic collaborations among key players like Sensient Technologies Corporation, Cargill Incorporated, International Flavors & Fragrances Inc., DSM-Firmenich, and Archer Daniels Midland Company, are expected to mitigate these challenges. Geographically, North America and Europe are currently leading the market, but the Asia Pacific region, particularly China and India, is expected to witness significant growth due to rising disposable incomes and increasing adoption of Western dietary trends. The forecast period of 2025-2033 indicates a dynamic market landscape where innovation and consumer preference will continue to be paramount.

Clean Label Ingredients Industry Company Market Share
Clean Label Ingredients Market: Navigating a $XX Billion Landscape
This comprehensive report offers an in-depth analysis of the global Clean Label Ingredients market, valued at an estimated $XX Billion in 2025. Spanning from 2019 to 2033, with a focus on the Base Year 2025 and a Forecast Period of 2025–2033, this study provides critical insights for industry stakeholders. Examining the Historical Period of 2019–2024, we deliver actionable intelligence on market dynamics, innovation trends, dominant regions, and key players shaping the future of clean label solutions.
Clean Label Ingredients Industry Market Structure & Innovation Trends
The Clean Label Ingredients Industry exhibits a moderately consolidated market structure, with a significant presence of multinational corporations alongside specialized ingredient manufacturers. Innovation is a primary driver, fueled by escalating consumer demand for transparent, natural, and minimally processed food and beverage products. Key innovation areas include the development of novel plant-based alternatives, natural preservatives derived from botanical sources, and advanced processing technologies that maintain ingredient integrity. Regulatory frameworks are increasingly favoring clean label claims, pushing companies to reformulate products and invest in R&D for compliant ingredients. Product substitutes are evolving, with a shift away from synthetic additives towards functional ingredients with perceived natural origins. End-user demographics indicate a growing preference for clean label products among millennials and Gen Z, influencing purchasing decisions and driving market growth. Mergers and acquisitions (M&A) activity remains robust, with strategic partnerships and acquisitions aimed at expanding product portfolios, enhancing technological capabilities, and securing market share. Notable M&A deal values in recent years have ranged from tens of millions to several hundred million dollars, reflecting the strategic importance of this sector. Market share is distributed among leading players, with dedicated clean label ingredient suppliers gaining traction.
Clean Label Ingredients Industry Market Dynamics & Trends
The global Clean Label Ingredients Market is experiencing robust expansion, projected to grow at a Compound Annual Growth Rate (CAGR) of XX% between 2025 and 2033. This significant growth is propelled by a confluence of powerful market drivers, chief among them the pervasive shift in consumer consciousness towards healthier and more transparent food choices. Consumers are increasingly scrutinizing ingredient lists, actively seeking products free from artificial colors, flavors, preservatives, and sweeteners. This elevated awareness, amplified by social media and readily available information, has created a substantial demand for ingredients that align with "natural" and "simple" product positioning. Technological advancements are also playing a pivotal role, with continuous innovation in extraction, purification, and formulation techniques enabling the production of high-performing clean label ingredients that meet the functional and sensory expectations of consumers and manufacturers alike. The development of novel ingredients from sources like upcycled food by-products and fermentation technologies is opening new avenues for innovation and sustainability. Furthermore, supportive regulatory landscapes in key markets, which often favor or mandate clearer labeling and restrict certain synthetic additives, act as a significant catalyst for market penetration. Competitive dynamics within the industry are intense, characterized by strategic collaborations, product differentiation based on sourcing and processing, and a constant drive to meet evolving consumer preferences. Companies are investing heavily in research and development to create ingredients that not only meet clean label criteria but also offer enhanced nutritional profiles, improved shelf-life, and superior sensory experiences, further solidifying the market's upward trajectory. The market penetration of clean label ingredients is expected to reach XX% by the end of the forecast period, underscoring its mainstream adoption.
Dominant Regions & Segments in Clean Label Ingredients Industry
North America is currently the dominant region in the Clean Label Ingredients Industry, driven by a highly health-conscious consumer base and stringent regulatory requirements that encourage ingredient transparency. The United States, in particular, leads market adoption due to its large consumer population and well-established food and beverage manufacturing sector. Key economic policies favoring natural and organic products, coupled with robust investment in food technology research and development, further solidify North America's leadership.
Product Type Dominance:
- Food Flavors and Enhancers: This segment holds a significant market share due to the high demand for natural flavorings that can replace artificial counterparts without compromising taste profiles. Consumers are increasingly seeking authentic and regional flavors, driving innovation in this category.
- Food Preservatives: The growing concern over synthetic preservatives has led to a surge in demand for natural alternatives derived from fruits, vegetables, and fermentation processes. This segment is crucial for extending the shelf-life of processed foods while adhering to clean label principles.
- Food Colorants: Natural colorants, extracted from sources like fruits, vegetables, and spices, are witnessing substantial growth as consumers actively avoid artificial food dyes. The development of vibrant and stable natural color solutions is a key focus for manufacturers.
- Food Sweeteners: The ongoing shift away from artificial sweeteners has fueled the demand for natural sweeteners like stevia, monk fruit, and sugar alcohols, making this a rapidly expanding segment.
- Food Hydrocolloids: Essential for texture and stability, natural hydrocolloids derived from sources such as pectin, gums, and starches are increasingly preferred over their synthetic counterparts in various food applications.
Application Dominance:
- Bakery and Confectionery: This sector is a major consumer of clean label ingredients, as manufacturers strive to offer visually appealing and taste-bud satisfying products with simple ingredient lists. Natural colors, flavors, and preservatives are particularly crucial here.
- Dairy and Frozen Desserts: With a growing emphasis on natural ingredients and reduced sugar content, this application segment is seeing increased adoption of clean label alternatives for stabilizers, emulsifiers, and flavorings.
- Beverages: The beverage industry, particularly the juices, functional drinks, and dairy alternatives sectors, is a significant driver of clean label ingredients, with a focus on natural sweeteners, flavors, and preservatives.
- Meat and Meat Products: Clean label solutions in this segment focus on natural preservatives to extend shelf-life and natural flavor enhancers to improve taste without relying on artificial additives.
- Sauces and Condiments: This segment benefits from the demand for natural thickeners, preservatives, and flavor profiles, leading to increased utilization of clean label ingredients.
Infrastructure supporting sophisticated supply chains and advanced R&D facilities further amplifies the dominance of North America and its leading segments.
Clean Label Ingredients Industry Product Innovations
Product innovations in the Clean Label Ingredients Industry are rapidly transforming food and beverage formulations. Companies are leveraging cutting-edge technologies to develop ingredients that offer functional benefits, enhanced sensory experiences, and improved nutritional profiles. Recent developments include the introduction of plant-based proteins that mimic animal-derived ingredients, natural antioxidants offering superior preservation, and novel fermentation techniques yielding unique flavor compounds. For instance, International Flavor and Fragrances Inc. launched Methanova, a plant-based, water-soluble biopolymer derived from cellulose, suitable for biotechnology applications. Archer-Daniels-Midland Company's strategic partnership with New Culture highlights a commitment to animal-free dairy, showcasing innovation in sustainable ingredient development. These innovations aim to provide manufacturers with effective solutions that meet both consumer demand for naturalness and the stringent requirements for product quality and stability. The competitive advantage lies in sourcing, processing transparency, and the ability to deliver cost-effective, high-performing clean label alternatives.
Report Scope & Segmentation Analysis
This report offers a comprehensive segmentation of the Clean Label Ingredients Industry.
- Product Type Segmentation: Analysis covers Food Preservatives, Food Sweeteners, Food Colorants, Food Hydrocolloids, Food Flavors and Enhancers, and Other Product Types. Growth projections for these segments are driven by evolving consumer preferences and technological advancements, with Food Flavors and Enhancers and Food Preservatives expected to exhibit significant market size increases due to high demand. Competitive dynamics vary, with specialized players dominating niche segments.
- Application Segmentation: The report dissects the market across Bakery and Confectionery, Dairy and Frozen Desserts, Beverages, Meat and Meat Products, Sauces and Condiments, and Other Applications. The Bakery and Confectionery segment is anticipated to maintain its leading market share, followed closely by Beverages, reflecting widespread consumer adoption of clean label products across various food categories.
Key Drivers of Clean Label Ingredients Industry Growth
The Clean Label Ingredients Industry is experiencing substantial growth driven by several interconnected factors. Firstly, escalating consumer demand for natural, minimally processed foods with transparent ingredient lists is paramount. This is supported by increasing health consciousness and a desire to avoid artificial additives. Secondly, technological innovations in ingredient extraction, processing, and biotechnology enable the development of high-performing natural alternatives to synthetic ingredients. Thirdly, evolving regulatory landscapes in various regions, often promoting clearer labeling and restricting certain artificial substances, provide a favorable environment for clean label adoption. Finally, the growing influence of social media and health advocacy groups amplifies consumer awareness and demand, pushing manufacturers to reformulate their products.
Challenges in the Clean Label Ingredients Industry Sector
Despite its robust growth, the Clean Label Ingredients Industry faces several challenges. A primary restraint is the cost implication, as natural ingredients can sometimes be more expensive to produce and source than their synthetic counterparts, impacting final product pricing. Supply chain complexities, including the variability in agricultural yields and the need for specialized sourcing, can also lead to price fluctuations and availability issues. Achieving desired functional properties, such as shelf-life extension and specific textures, using only natural ingredients can be technically challenging for formulators. Furthermore, the interpretation and standardization of "clean label" claims can vary across regions and regulatory bodies, creating potential confusion for both manufacturers and consumers. Intense competition among ingredient suppliers also puts pressure on profit margins.
Emerging Opportunities in Clean Label Ingredients Industry
The Clean Label Ingredients Industry presents numerous emerging opportunities. The growing demand for plant-based and vegan ingredients offers significant expansion potential, driven by ethical, environmental, and health concerns. Innovations in upcycled ingredients, utilizing by-products from food processing, present a sustainable and cost-effective avenue for developing new clean label solutions. The expansion of e-commerce and direct-to-consumer models allows for greater transparency and direct engagement with consumers interested in clean label products. Furthermore, emerging markets in Asia and Latin America, with their rapidly growing middle classes and increasing health awareness, represent untapped potential for clean label ingredient adoption. The development of functional clean label ingredients that offer health benefits beyond basic nutrition, such as probiotics or adaptogens, is another promising area.
Leading Players in the Clean Label Ingredients Industry Market
- Sensient Technologies Corporation
- Cargill Incorporated
- International Flavors & Fragrances Inc.
- DSM-Firmenich
- Archer Daniels Midland Company
- Ajinomoto Co. Inc.
- Tate & Lyle PLC
- Kerry Group PLC
- Ingredion Incorporated
- Corbion NV
Key Developments in Clean Label Ingredients Industry Industry
- February 2024: Ajinomoto Co. opened a new office in Silicon Valley, United States, to expand its business and provide various food solutions, including clean label ingredients in the US market.
- October 2023: International Flavor and Fragrances Inc. launched Methanova, a cell-compatible and filterable methylcellulose derived from cellulose. This plant-based biopolymer is suitable for advanced biotechnology applications like cell culture media and 3D bioprinting.
- August 2022: Archer-Daniels-Midland Company announced a strategic partnership with New Culture, a pioneering animal-free dairy company. This collaboration aims to foster joint product development and enable a more sustainable food future by leveraging innovative ingredients.
Future Outlook for Clean Label Ingredients Industry Market
The future outlook for the Clean Label Ingredients Industry is exceptionally bright, poised for sustained growth driven by deeply embedded consumer preferences and ongoing innovation. The persistent demand for healthier, more natural food options will continue to be the primary growth accelerator. We anticipate significant advancements in ingredient functionalities, with a focus on natural preservation, enhanced nutritional profiles, and superior sensory attributes that rival conventional ingredients. Emerging technologies, such as precision fermentation and advanced plant breeding, will unlock new sources and improve the efficiency of clean label ingredient production. The industry will also witness increased M&A activity as larger corporations seek to acquire innovative startups and expand their clean label portfolios. Strategic opportunities lie in addressing the evolving needs of emerging markets, developing solutions for plant-based food categories, and pioneering ingredients that contribute to a circular economy. The market's trajectory indicates a continued shift towards ingredient transparency and holistic wellness.
Clean Label Ingredients Industry Segmentation
-
1. Product Type
- 1.1. Food Preservatives
- 1.2. Food Sweeteners
- 1.3. Food Colorants
- 1.4. Food Hydrocolloids
- 1.5. Food Flavors and Enhancers
- 1.6. Other Product Types
-
2. Application
- 2.1. Bakery and Confectionery
- 2.2. Dairy and Frozen Desserts
- 2.3. Beverages
- 2.4. Meat and Meat Products
- 2.5. Sauces and Condiments
- 2.6. Other Applications
Clean Label Ingredients Industry Segmentation By Geography
-
1. North America
- 1.1. United States
- 1.2. Canada
- 1.3. Mexico
- 1.4. Rest of North America
-
2. Europe
- 2.1. United Kingdom
- 2.2. Germany
- 2.3. Spain
- 2.4. France
- 2.5. Italy
- 2.6. Russia
- 2.7. Rest of Europe
-
3. Asia Pacific
- 3.1. China
- 3.2. Japan
- 3.3. India
- 3.4. Australia
- 3.5. Rest of Asia Pacific
-
4. South America
- 4.1. Brazil
- 4.2. Argentina
- 4.3. Rest of South America
-
5. Middle East and Africa
- 5.1. South Africa
- 5.2. Saudi Arabia
- 5.3. Rest of Middle East and Africa
Clean Label Ingredients Industry Regional Market Share
Geographic Coverage of Clean Label Ingredients Industry
Clean Label Ingredients Industry REPORT HIGHLIGHTS
| Aspects | Details |
|---|---|
| Study Period | 2020-2034 |
| Base Year | 2025 |
| Estimated Year | 2026 |
| Forecast Period | 2026-2034 |
| Historical Period | 2020-2025 |
| Growth Rate | CAGR of 6.51% from 2020-2034 |
| Segmentation |
|
Table of Contents
- 1. Introduction
- 1.1. Research Scope
- 1.2. Market Segmentation
- 1.3. Research Objective
- 1.4. Definitions and Assumptions
- 2. Executive Summary
- 2.1. Market Snapshot
- 3. Market Dynamics
- 3.1. Market Drivers
- 3.2. Market Restrains
- 3.3. Market Trends
- 3.4. Market Opportunities
- 4. Market Factor Analysis
- 4.1. Porters Five Forces
- 4.1.1. Bargaining Power of Suppliers
- 4.1.2. Bargaining Power of Buyers
- 4.1.3. Threat of New Entrants
- 4.1.4. Threat of Substitutes
- 4.1.5. Competitive Rivalry
- 4.2. PESTEL analysis
- 4.3. BCG Analysis
- 4.3.1. Stars (High Growth, High Market Share)
- 4.3.2. Cash Cows (Low Growth, High Market Share)
- 4.3.3. Question Mark (High Growth, Low Market Share)
- 4.3.4. Dogs (Low Growth, Low Market Share)
- 4.4. Ansoff Matrix Analysis
- 4.5. Supply Chain Analysis
- 4.6. Regulatory Landscape
- 4.7. Current Market Potential and Opportunity Assessment (TAM–SAM–SOM Framework)
- 4.8. PRI Analyst Note
- 4.1. Porters Five Forces
- 5. Market Analysis, Insights and Forecast 2021-2033
- 5.1. Market Analysis, Insights and Forecast - by Product Type
- 5.1.1. Food Preservatives
- 5.1.2. Food Sweeteners
- 5.1.3. Food Colorants
- 5.1.4. Food Hydrocolloids
- 5.1.5. Food Flavors and Enhancers
- 5.1.6. Other Product Types
- 5.2. Market Analysis, Insights and Forecast - by Application
- 5.2.1. Bakery and Confectionery
- 5.2.2. Dairy and Frozen Desserts
- 5.2.3. Beverages
- 5.2.4. Meat and Meat Products
- 5.2.5. Sauces and Condiments
- 5.2.6. Other Applications
- 5.3. Market Analysis, Insights and Forecast - by Region
- 5.3.1. North America
- 5.3.2. Europe
- 5.3.3. Asia Pacific
- 5.3.4. South America
- 5.3.5. Middle East and Africa
- 5.1. Market Analysis, Insights and Forecast - by Product Type
- 6. Global Clean Label Ingredients Industry Analysis, Insights and Forecast, 2021-2033
- 6.1. Market Analysis, Insights and Forecast - by Product Type
- 6.1.1. Food Preservatives
- 6.1.2. Food Sweeteners
- 6.1.3. Food Colorants
- 6.1.4. Food Hydrocolloids
- 6.1.5. Food Flavors and Enhancers
- 6.1.6. Other Product Types
- 6.2. Market Analysis, Insights and Forecast - by Application
- 6.2.1. Bakery and Confectionery
- 6.2.2. Dairy and Frozen Desserts
- 6.2.3. Beverages
- 6.2.4. Meat and Meat Products
- 6.2.5. Sauces and Condiments
- 6.2.6. Other Applications
- 6.1. Market Analysis, Insights and Forecast - by Product Type
- 7. North America Clean Label Ingredients Industry Analysis, Insights and Forecast, 2020-2032
- 7.1. Market Analysis, Insights and Forecast - by Product Type
- 7.1.1. Food Preservatives
- 7.1.2. Food Sweeteners
- 7.1.3. Food Colorants
- 7.1.4. Food Hydrocolloids
- 7.1.5. Food Flavors and Enhancers
- 7.1.6. Other Product Types
- 7.2. Market Analysis, Insights and Forecast - by Application
- 7.2.1. Bakery and Confectionery
- 7.2.2. Dairy and Frozen Desserts
- 7.2.3. Beverages
- 7.2.4. Meat and Meat Products
- 7.2.5. Sauces and Condiments
- 7.2.6. Other Applications
- 7.1. Market Analysis, Insights and Forecast - by Product Type
- 8. Europe Clean Label Ingredients Industry Analysis, Insights and Forecast, 2020-2032
- 8.1. Market Analysis, Insights and Forecast - by Product Type
- 8.1.1. Food Preservatives
- 8.1.2. Food Sweeteners
- 8.1.3. Food Colorants
- 8.1.4. Food Hydrocolloids
- 8.1.5. Food Flavors and Enhancers
- 8.1.6. Other Product Types
- 8.2. Market Analysis, Insights and Forecast - by Application
- 8.2.1. Bakery and Confectionery
- 8.2.2. Dairy and Frozen Desserts
- 8.2.3. Beverages
- 8.2.4. Meat and Meat Products
- 8.2.5. Sauces and Condiments
- 8.2.6. Other Applications
- 8.1. Market Analysis, Insights and Forecast - by Product Type
- 9. Asia Pacific Clean Label Ingredients Industry Analysis, Insights and Forecast, 2020-2032
- 9.1. Market Analysis, Insights and Forecast - by Product Type
- 9.1.1. Food Preservatives
- 9.1.2. Food Sweeteners
- 9.1.3. Food Colorants
- 9.1.4. Food Hydrocolloids
- 9.1.5. Food Flavors and Enhancers
- 9.1.6. Other Product Types
- 9.2. Market Analysis, Insights and Forecast - by Application
- 9.2.1. Bakery and Confectionery
- 9.2.2. Dairy and Frozen Desserts
- 9.2.3. Beverages
- 9.2.4. Meat and Meat Products
- 9.2.5. Sauces and Condiments
- 9.2.6. Other Applications
- 9.1. Market Analysis, Insights and Forecast - by Product Type
- 10. South America Clean Label Ingredients Industry Analysis, Insights and Forecast, 2020-2032
- 10.1. Market Analysis, Insights and Forecast - by Product Type
- 10.1.1. Food Preservatives
- 10.1.2. Food Sweeteners
- 10.1.3. Food Colorants
- 10.1.4. Food Hydrocolloids
- 10.1.5. Food Flavors and Enhancers
- 10.1.6. Other Product Types
- 10.2. Market Analysis, Insights and Forecast - by Application
- 10.2.1. Bakery and Confectionery
- 10.2.2. Dairy and Frozen Desserts
- 10.2.3. Beverages
- 10.2.4. Meat and Meat Products
- 10.2.5. Sauces and Condiments
- 10.2.6. Other Applications
- 10.1. Market Analysis, Insights and Forecast - by Product Type
- 11. Middle East and Africa Clean Label Ingredients Industry Analysis, Insights and Forecast, 2020-2032
- 11.1. Market Analysis, Insights and Forecast - by Product Type
- 11.1.1. Food Preservatives
- 11.1.2. Food Sweeteners
- 11.1.3. Food Colorants
- 11.1.4. Food Hydrocolloids
- 11.1.5. Food Flavors and Enhancers
- 11.1.6. Other Product Types
- 11.2. Market Analysis, Insights and Forecast - by Application
- 11.2.1. Bakery and Confectionery
- 11.2.2. Dairy and Frozen Desserts
- 11.2.3. Beverages
- 11.2.4. Meat and Meat Products
- 11.2.5. Sauces and Condiments
- 11.2.6. Other Applications
- 11.1. Market Analysis, Insights and Forecast - by Product Type
- 12. Competitive Analysis
- 12.1. Company Profiles
- 12.1.1 Sensient Technologies Corporation*List Not Exhaustive
- 12.1.1.1. Company Overview
- 12.1.1.2. Products
- 12.1.1.3. Company Financials
- 12.1.1.4. SWOT Analysis
- 12.1.2 Cargill Incorporated
- 12.1.2.1. Company Overview
- 12.1.2.2. Products
- 12.1.2.3. Company Financials
- 12.1.2.4. SWOT Analysis
- 12.1.3 International Flavors & Fragrances Inc
- 12.1.3.1. Company Overview
- 12.1.3.2. Products
- 12.1.3.3. Company Financials
- 12.1.3.4. SWOT Analysis
- 12.1.4 DSM-Firmenich
- 12.1.4.1. Company Overview
- 12.1.4.2. Products
- 12.1.4.3. Company Financials
- 12.1.4.4. SWOT Analysis
- 12.1.5 Archer Daniels Midland Company
- 12.1.5.1. Company Overview
- 12.1.5.2. Products
- 12.1.5.3. Company Financials
- 12.1.5.4. SWOT Analysis
- 12.1.6 Ajinomoto Co Inc
- 12.1.6.1. Company Overview
- 12.1.6.2. Products
- 12.1.6.3. Company Financials
- 12.1.6.4. SWOT Analysis
- 12.1.7 Tate & Lyle PLC
- 12.1.7.1. Company Overview
- 12.1.7.2. Products
- 12.1.7.3. Company Financials
- 12.1.7.4. SWOT Analysis
- 12.1.8 Kerry Group PLC
- 12.1.8.1. Company Overview
- 12.1.8.2. Products
- 12.1.8.3. Company Financials
- 12.1.8.4. SWOT Analysis
- 12.1.9 Ingredion Incorporated
- 12.1.9.1. Company Overview
- 12.1.9.2. Products
- 12.1.9.3. Company Financials
- 12.1.9.4. SWOT Analysis
- 12.1.10 Corbion NV
- 12.1.10.1. Company Overview
- 12.1.10.2. Products
- 12.1.10.3. Company Financials
- 12.1.10.4. SWOT Analysis
- 12.1.1 Sensient Technologies Corporation*List Not Exhaustive
- 12.2. Market Entropy
- 12.2.1 Company's Key Areas Served
- 12.2.2 Recent Developments
- 12.3. Company Market Share Analysis 2025
- 12.3.1 Top 5 Companies Market Share Analysis
- 12.3.2 Top 3 Companies Market Share Analysis
- 12.4. List of Potential Customers
- 13. Research Methodology
List of Figures
- Figure 1: Global Clean Label Ingredients Industry Revenue Breakdown (Million, %) by Region 2025 & 2033
- Figure 2: North America Clean Label Ingredients Industry Revenue (Million), by Product Type 2025 & 2033
- Figure 3: North America Clean Label Ingredients Industry Revenue Share (%), by Product Type 2025 & 2033
- Figure 4: North America Clean Label Ingredients Industry Revenue (Million), by Application 2025 & 2033
- Figure 5: North America Clean Label Ingredients Industry Revenue Share (%), by Application 2025 & 2033
- Figure 6: North America Clean Label Ingredients Industry Revenue (Million), by Country 2025 & 2033
- Figure 7: North America Clean Label Ingredients Industry Revenue Share (%), by Country 2025 & 2033
- Figure 8: Europe Clean Label Ingredients Industry Revenue (Million), by Product Type 2025 & 2033
- Figure 9: Europe Clean Label Ingredients Industry Revenue Share (%), by Product Type 2025 & 2033
- Figure 10: Europe Clean Label Ingredients Industry Revenue (Million), by Application 2025 & 2033
- Figure 11: Europe Clean Label Ingredients Industry Revenue Share (%), by Application 2025 & 2033
- Figure 12: Europe Clean Label Ingredients Industry Revenue (Million), by Country 2025 & 2033
- Figure 13: Europe Clean Label Ingredients Industry Revenue Share (%), by Country 2025 & 2033
- Figure 14: Asia Pacific Clean Label Ingredients Industry Revenue (Million), by Product Type 2025 & 2033
- Figure 15: Asia Pacific Clean Label Ingredients Industry Revenue Share (%), by Product Type 2025 & 2033
- Figure 16: Asia Pacific Clean Label Ingredients Industry Revenue (Million), by Application 2025 & 2033
- Figure 17: Asia Pacific Clean Label Ingredients Industry Revenue Share (%), by Application 2025 & 2033
- Figure 18: Asia Pacific Clean Label Ingredients Industry Revenue (Million), by Country 2025 & 2033
- Figure 19: Asia Pacific Clean Label Ingredients Industry Revenue Share (%), by Country 2025 & 2033
- Figure 20: South America Clean Label Ingredients Industry Revenue (Million), by Product Type 2025 & 2033
- Figure 21: South America Clean Label Ingredients Industry Revenue Share (%), by Product Type 2025 & 2033
- Figure 22: South America Clean Label Ingredients Industry Revenue (Million), by Application 2025 & 2033
- Figure 23: South America Clean Label Ingredients Industry Revenue Share (%), by Application 2025 & 2033
- Figure 24: South America Clean Label Ingredients Industry Revenue (Million), by Country 2025 & 2033
- Figure 25: South America Clean Label Ingredients Industry Revenue Share (%), by Country 2025 & 2033
- Figure 26: Middle East and Africa Clean Label Ingredients Industry Revenue (Million), by Product Type 2025 & 2033
- Figure 27: Middle East and Africa Clean Label Ingredients Industry Revenue Share (%), by Product Type 2025 & 2033
- Figure 28: Middle East and Africa Clean Label Ingredients Industry Revenue (Million), by Application 2025 & 2033
- Figure 29: Middle East and Africa Clean Label Ingredients Industry Revenue Share (%), by Application 2025 & 2033
- Figure 30: Middle East and Africa Clean Label Ingredients Industry Revenue (Million), by Country 2025 & 2033
- Figure 31: Middle East and Africa Clean Label Ingredients Industry Revenue Share (%), by Country 2025 & 2033
List of Tables
- Table 1: Global Clean Label Ingredients Industry Revenue Million Forecast, by Product Type 2020 & 2033
- Table 2: Global Clean Label Ingredients Industry Revenue Million Forecast, by Application 2020 & 2033
- Table 3: Global Clean Label Ingredients Industry Revenue Million Forecast, by Region 2020 & 2033
- Table 4: Global Clean Label Ingredients Industry Revenue Million Forecast, by Product Type 2020 & 2033
- Table 5: Global Clean Label Ingredients Industry Revenue Million Forecast, by Application 2020 & 2033
- Table 6: Global Clean Label Ingredients Industry Revenue Million Forecast, by Country 2020 & 2033
- Table 7: United States Clean Label Ingredients Industry Revenue (Million) Forecast, by Application 2020 & 2033
- Table 8: Canada Clean Label Ingredients Industry Revenue (Million) Forecast, by Application 2020 & 2033
- Table 9: Mexico Clean Label Ingredients Industry Revenue (Million) Forecast, by Application 2020 & 2033
- Table 10: Rest of North America Clean Label Ingredients Industry Revenue (Million) Forecast, by Application 2020 & 2033
- Table 11: Global Clean Label Ingredients Industry Revenue Million Forecast, by Product Type 2020 & 2033
- Table 12: Global Clean Label Ingredients Industry Revenue Million Forecast, by Application 2020 & 2033
- Table 13: Global Clean Label Ingredients Industry Revenue Million Forecast, by Country 2020 & 2033
- Table 14: United Kingdom Clean Label Ingredients Industry Revenue (Million) Forecast, by Application 2020 & 2033
- Table 15: Germany Clean Label Ingredients Industry Revenue (Million) Forecast, by Application 2020 & 2033
- Table 16: Spain Clean Label Ingredients Industry Revenue (Million) Forecast, by Application 2020 & 2033
- Table 17: France Clean Label Ingredients Industry Revenue (Million) Forecast, by Application 2020 & 2033
- Table 18: Italy Clean Label Ingredients Industry Revenue (Million) Forecast, by Application 2020 & 2033
- Table 19: Russia Clean Label Ingredients Industry Revenue (Million) Forecast, by Application 2020 & 2033
- Table 20: Rest of Europe Clean Label Ingredients Industry Revenue (Million) Forecast, by Application 2020 & 2033
- Table 21: Global Clean Label Ingredients Industry Revenue Million Forecast, by Product Type 2020 & 2033
- Table 22: Global Clean Label Ingredients Industry Revenue Million Forecast, by Application 2020 & 2033
- Table 23: Global Clean Label Ingredients Industry Revenue Million Forecast, by Country 2020 & 2033
- Table 24: China Clean Label Ingredients Industry Revenue (Million) Forecast, by Application 2020 & 2033
- Table 25: Japan Clean Label Ingredients Industry Revenue (Million) Forecast, by Application 2020 & 2033
- Table 26: India Clean Label Ingredients Industry Revenue (Million) Forecast, by Application 2020 & 2033
- Table 27: Australia Clean Label Ingredients Industry Revenue (Million) Forecast, by Application 2020 & 2033
- Table 28: Rest of Asia Pacific Clean Label Ingredients Industry Revenue (Million) Forecast, by Application 2020 & 2033
- Table 29: Global Clean Label Ingredients Industry Revenue Million Forecast, by Product Type 2020 & 2033
- Table 30: Global Clean Label Ingredients Industry Revenue Million Forecast, by Application 2020 & 2033
- Table 31: Global Clean Label Ingredients Industry Revenue Million Forecast, by Country 2020 & 2033
- Table 32: Brazil Clean Label Ingredients Industry Revenue (Million) Forecast, by Application 2020 & 2033
- Table 33: Argentina Clean Label Ingredients Industry Revenue (Million) Forecast, by Application 2020 & 2033
- Table 34: Rest of South America Clean Label Ingredients Industry Revenue (Million) Forecast, by Application 2020 & 2033
- Table 35: Global Clean Label Ingredients Industry Revenue Million Forecast, by Product Type 2020 & 2033
- Table 36: Global Clean Label Ingredients Industry Revenue Million Forecast, by Application 2020 & 2033
- Table 37: Global Clean Label Ingredients Industry Revenue Million Forecast, by Country 2020 & 2033
- Table 38: South Africa Clean Label Ingredients Industry Revenue (Million) Forecast, by Application 2020 & 2033
- Table 39: Saudi Arabia Clean Label Ingredients Industry Revenue (Million) Forecast, by Application 2020 & 2033
- Table 40: Rest of Middle East and Africa Clean Label Ingredients Industry Revenue (Million) Forecast, by Application 2020 & 2033
Frequently Asked Questions
1. What is the projected Compound Annual Growth Rate (CAGR) of the Clean Label Ingredients Industry?
The projected CAGR is approximately 6.51%.
2. Which companies are prominent players in the Clean Label Ingredients Industry?
Key companies in the market include Sensient Technologies Corporation*List Not Exhaustive, Cargill Incorporated, International Flavors & Fragrances Inc, DSM-Firmenich, Archer Daniels Midland Company, Ajinomoto Co Inc, Tate & Lyle PLC, Kerry Group PLC, Ingredion Incorporated, Corbion NV.
3. What are the main segments of the Clean Label Ingredients Industry?
The market segments include Product Type, Application.
4. Can you provide details about the market size?
The market size is estimated to be USD 42.76 Million as of 2022.
5. What are some drivers contributing to market growth?
Increasing Health and Wellness Trends Fueling Market Growth; Rising Demand for Natural Ingredients.
6. What are the notable trends driving market growth?
Increasing Health and Wellness Trends Fueling Market Growth.
7. Are there any restraints impacting market growth?
High Cost Hampering Market Growth.
8. Can you provide examples of recent developments in the market?
February 2024: Ajinomoto Co. opened a new office in Silicon Valley, United States. The office provides different types of food solutions, including clean label ingredients in the US market. The purpose of this expansion was to expand the company’s business.
9. What pricing options are available for accessing the report?
Pricing options include single-user, multi-user, and enterprise licenses priced at USD 4750, USD 5250, and USD 8750 respectively.
10. Is the market size provided in terms of value or volume?
The market size is provided in terms of value, measured in Million.
11. Are there any specific market keywords associated with the report?
Yes, the market keyword associated with the report is "Clean Label Ingredients Industry," which aids in identifying and referencing the specific market segment covered.
12. How do I determine which pricing option suits my needs best?
The pricing options vary based on user requirements and access needs. Individual users may opt for single-user licenses, while businesses requiring broader access may choose multi-user or enterprise licenses for cost-effective access to the report.
13. Are there any additional resources or data provided in the Clean Label Ingredients Industry report?
While the report offers comprehensive insights, it's advisable to review the specific contents or supplementary materials provided to ascertain if additional resources or data are available.
14. How can I stay updated on further developments or reports in the Clean Label Ingredients Industry?
To stay informed about further developments, trends, and reports in the Clean Label Ingredients Industry, consider subscribing to industry newsletters, following relevant companies and organizations, or regularly checking reputable industry news sources and publications.
Methodology
Step 1 - Identification of Relevant Samples Size from Population Database


Step 2 - Approaches for Defining Global Market Size (Value, Volume* & Price*)

Note*: In applicable scenarios
Step 3 - Data Sources
Primary Research
- Web Analytics
- Survey Reports
- Research Institute
- Latest Research Reports
- Opinion Leaders
Secondary Research
- Annual Reports
- White Paper
- Latest Press Release
- Industry Association
- Paid Database
- Investor Presentations

Step 4 - Data Triangulation
Involves using different sources of information in order to increase the validity of a study
These sources are likely to be stakeholders in a program - participants, other researchers, program staff, other community members, and so on.
Then we put all data in single framework & apply various statistical tools to find out the dynamic on the market.
During the analysis stage, feedback from the stakeholder groups would be compared to determine areas of agreement as well as areas of divergence