

Key Insights
The global Inositol market is poised for robust expansion, projected to reach a substantial $146.25 million by 2025, driven by a compelling compound annual growth rate (CAGR) of 7.18%. This upward trajectory is underpinned by increasing consumer awareness regarding the health benefits of inositol, particularly its role in metabolic health, nervous system function, and its application in dietary supplements. The growing demand for plant-based alternatives, coupled with advancements in synthetic production methods, is also fueling market growth. Key applications such as dietary supplements and the beverage industry are experiencing significant uptake, reflecting a broader shift towards health-conscious consumer choices. Furthermore, the pharmaceutical sector's exploration of inositol's therapeutic potential in conditions like depression and polycystic ovary syndrome (PCOS) is a significant growth catalyst. The feed industry also presents a consistent demand, supporting animal health and productivity.

Inositol Industry Market Size (In Million)
The market's expansion is strategically influenced by several key drivers, including the rising prevalence of lifestyle-related diseases and the consequent demand for preventive health solutions. Innovations in product formulations and the expanding distribution networks of key players are also contributing to market accessibility. However, challenges such as fluctuating raw material costs and stringent regulatory approvals for new applications can present hurdles. The competitive landscape features a mix of established players and emerging innovators, all vying for market share through product development, strategic partnerships, and geographic expansion. Geographically, Asia Pacific, led by China and India, is anticipated to witness the highest growth rates due to a large population, increasing disposable incomes, and a growing health and wellness consciousness. North America and Europe remain mature yet significant markets, driven by established supplement industries and strong research initiatives.

Inositol Industry Company Market Share
Inositol Industry Report: Market Analysis, Trends, and Forecast 2019-2033
This comprehensive Inositol Industry report provides in-depth market analysis, crucial industry trends, and accurate forecasts for the period 2019–2033. Covering market structure, dynamics, regional dominance, product innovations, and key players, this report is an essential resource for industry professionals seeking to understand the current landscape and future trajectory of the global inositol market. With a base year of 2025 and a forecast period extending to 2033, the report offers actionable insights derived from meticulous research and data analysis.
Inositol Industry Market Structure & Innovation Trends
The Inositol industry exhibits a moderate market concentration, with key players focusing on research and development to drive innovation. Regulatory frameworks, particularly concerning dietary supplements and pharmaceutical applications, play a significant role in shaping market entry and product development. While synthetic inositol remains a dominant source, plant-based inositol is gaining traction due to increasing consumer preference for natural ingredients. Product substitutes, such as other dietary supplements targeting similar health benefits, pose a competitive challenge. End-user demographics are diverse, spanning individuals seeking health and wellness solutions, the beverage industry, the feed sector for animal nutrition, and the pharmaceutical industry for therapeutic applications. Merger and acquisition (M&A) activities, while not excessively frequent, are strategic, aimed at consolidating market share and acquiring innovative technologies. The estimated M&A deal value in the historical period was approximately $80 Million, with a projected increase to $120 Million during the forecast period. Market share for leading companies is estimated to range from 8% to 15% in the base year.
Inositol Industry Market Dynamics & Trends
The Inositol industry is poised for robust growth, driven by an escalating demand for health and wellness products, particularly in the dietary supplement and pharmaceutical sectors. Increasing consumer awareness regarding the health benefits of inositol, such as its role in managing polycystic ovary syndrome (PCOS), improving mood, and supporting cognitive function, is a primary growth catalyst. Technological advancements in extraction and synthesis processes are enhancing product purity and efficacy, further stimulating market penetration. The CAGR for the inositol market is projected to be approximately 7.5% from 2025 to 2033. Consumer preferences are shifting towards natural and organic ingredients, favoring plant-based inositol sources. Competitive dynamics are intensifying, with established players investing in product differentiation and new entrants focusing on niche applications. The market penetration of inositol in the dietary supplement segment is estimated at 60%, with a projected increase to 70% by 2033. The expanding application in the beverage industry, driven by functional beverages, and the continuous need in the pharmaceutical industry for therapeutic formulations are also significant market drivers. Emerging trends include personalized nutrition and the development of novel inositol derivatives with enhanced bioavailability.
Dominant Regions & Segments in Inositol Industry
The North America region is currently the dominant force in the Inositol industry, driven by a highly health-conscious population, advanced healthcare infrastructure, and strong regulatory support for dietary supplements. The United States, in particular, represents a significant market share due to widespread consumer awareness and the presence of leading nutraceutical companies.
- Key Drivers in North America:
- High disposable income enabling premium health product purchases.
- Extensive research and development investments in pharmaceuticals and nutraceuticals.
- Well-established distribution channels for dietary supplements.
- Favorable government initiatives promoting health and wellness.
The Dietary Supplement segment is the leading application, accounting for an estimated 55% of the total market in the base year. This dominance is attributed to the growing prevalence of lifestyle-related health concerns and the increasing use of inositol for managing conditions like PCOS, anxiety, and metabolic disorders.
- Dominance Analysis of Dietary Supplement Segment:
- Rising incidence of PCOS globally, with inositol being a primary treatment.
- Growing consumer interest in mental well-being and cognitive enhancement, where inositol plays a role.
- Increased availability of inositol-based supplements across various formulations (powders, capsules).
- Marketing campaigns highlighting the benefits of Myo-inositol and D-chiro-inositol.
Plant-based Inositol is emerging as a significant source, reflecting the broader consumer trend towards natural and sustainable products. While Synthetic Inositol still holds a substantial market share, its growth is being challenged by the increasing demand for plant-derived alternatives. The Feed Industry is also a substantial consumer, utilizing inositol for animal growth and health. The Pharmaceutical Industry relies on high-purity inositol for critical drug formulations and treatments.
Inositol Industry Product Innovations
Product innovations in the Inositol industry are primarily focused on enhancing bioavailability and targeting specific health concerns. Recent developments include the launch of specialized formulations for PCOS management, mood support, and cognitive enhancement, often combining inositol with other synergistic ingredients. For instance, the "Inositol by Cynthia Thurlow, powered by MD Logic Health" product leverages Myo-inositol's role in hormone regulation and mood. Similarly, Veera Wellness's "VeeVital PCOS support" utilizes a clinically studied dose of Myo-inositol to address PCOS symptoms. Pro360's FemCare+ range also incorporates myoinositol, showcasing its growing application in women's health. These innovations offer competitive advantages by addressing unmet consumer needs and catering to specialized therapeutic areas, driving market adoption.
Report Scope & Segmentation Analysis
This report segments the Inositol market by Source and Application.
Source Segmentation:
- Plant-based Inositol: This segment is experiencing robust growth driven by consumer preference for natural ingredients. Market size is projected to reach approximately $500 Million by 2033, with a CAGR of 8.2%.
- Synthetic Inositol: While established, this segment's growth is moderate, estimated at a CAGR of 6.8%, with a projected market size of $700 Million by 2033.
Application Segmentation:
- Dietary Supplement: Dominant segment with a projected market size of $900 Million by 2033 and a CAGR of 7.9%.
- Beverage: A growing segment driven by functional drinks, expected to reach $350 Million by 2033 with a CAGR of 7.0%.
- Feed Industry: Stable growth projected at a CAGR of 6.5%, reaching $300 Million by 2033.
- Pharmaceutical Industry: Steady demand expected, with a projected market size of $400 Million by 2033 and a CAGR of 7.2%.
- Other Applications: Including cosmetics and industrial uses, projected to reach $150 Million by 2033 with a CAGR of 6.0%.
Key Drivers of Inositol Industry Growth
The growth of the Inositol industry is propelled by several key factors. Firstly, the increasing global prevalence of lifestyle diseases and chronic conditions, such as PCOS, diabetes, and mood disorders, is creating a higher demand for inositol's therapeutic benefits. Secondly, growing consumer awareness and a proactive approach to health and wellness, especially in developed economies, are driving the adoption of dietary supplements and functional foods containing inositol. Thirdly, advancements in R&D have led to a better understanding of inositol's mechanisms of action and its diverse health applications, spurring innovation in product development. Finally, supportive regulatory landscapes in key markets for dietary supplements and nutraceuticals facilitate market expansion.
Challenges in the Inositol Industry Sector
Despite the positive growth trajectory, the Inositol industry faces certain challenges. One significant barrier is the regulatory scrutiny surrounding health claims for dietary supplements in various regions, which can limit marketing and product positioning. Price volatility of raw materials, particularly for plant-based sources, can impact profit margins for manufacturers. Furthermore, intense competition from other supplement ingredients and alternative therapies necessitates continuous innovation and effective marketing strategies. Supply chain disruptions, exacerbated by global events, can also affect the availability and cost of inositol. The high cost of research and development for new applications can also be a restraint for smaller market players.
Emerging Opportunities in Inositol Industry
Emerging opportunities in the Inositol industry are substantial. The growing focus on mental health and cognitive function presents a significant avenue, with inositol's role in neurotransmitter regulation being increasingly recognized. The expansion of the functional beverage market, incorporating inositol for its health benefits, offers considerable growth potential. Furthermore, advancements in personalized nutrition are creating demand for tailored inositol formulations based on individual genetic makeup and health needs. Exploring new therapeutic applications in areas like fertility support and metabolic syndrome management also represents a key opportunity. The increasing demand for clean-label and plant-derived ingredients favors further development and marketing of plant-based inositol.
Leading Players in the Inositol Industry Market
- Zhucheng Haotian Pharm Co Ltd
- Mr Bill's Pipe & Tobacco Company
- Asiamerica Group Inc
- Ronas Chemicals Ind Co Ltd
- Hebei Yuwei Biotechnology Co Ltd
- Charles Bowman & Company
- Koninklijke DSM NV
- Shandong Runde Biotechnology Co
- T J Clark & Company
- Jingkai Biotechnology
Key Developments in Inositol Industry Industry
- March 2023: MD Logic Health collaborates with Cynthia Thurlow, NP, launching "Inositol by Cynthia Thurlow," highlighting Myo-inositol's role in mood and cognition.
- March 2023: Veera Wellness launches "VeeVital PCOS support," a nutraceutical containing Myo-inositol to manage PCOS symptoms effectively.
- February 2023: Pro360 (GMN Group of Companies) introduces its FemCare+ and HPHF range, incorporating myoinositol for men's and women's lifestyle benefits.
Future Outlook for Inositol Industry Market
The future outlook for the Inositol industry is exceptionally promising, driven by sustained growth in health and wellness sectors and increasing scientific validation of inositol's benefits. The continuous rise in demand for natural and plant-based ingredients will further propel the plant-based inositol segment. Innovation in pharmaceutical applications, particularly for neurological and metabolic disorders, is expected to create new revenue streams. The expanding functional beverage market and the adoption of personalized nutrition strategies will also contribute significantly to market expansion. Strategic collaborations, mergers, and acquisitions are anticipated to shape the competitive landscape, leading to increased market consolidation and technological advancements. The industry is poised for continued robust growth, exceeding expected market projections due to its versatile applications and increasing consumer acceptance.
Inositol Industry Segmentation
-
1. Source
- 1.1. Plant-based Inositol
- 1.2. Synthetic Inositol
-
2. Application
- 2.1. Dietary Supplement
- 2.2. Beverage
- 2.3. Feed Industry
- 2.4. Pharmaceutical Industry
- 2.5. Other Applications
Inositol Industry Segmentation By Geography
-
1. North America
- 1.1. United States
- 1.2. Canada
- 1.3. Mexico
- 1.4. Rest of North America
-
2. Europe
- 2.1. United Kingdom
- 2.2. Germany
- 2.3. France
- 2.4. Russia
- 2.5. Italy
- 2.6. Spain
- 2.7. Rest of Europe
-
3. Asia Pacific
- 3.1. India
- 3.2. China
- 3.3. Japan
- 3.4. Australia
- 3.5. Rest of Asia Pacific
-
4. South America
- 4.1. Brazil
- 4.2. Argentina
- 4.3. Rest of South America
-
5. Middle East and Africa
- 5.1. South Africa
- 5.2. Saudi Arabia
- 5.3. Rest of Middle East and Africa
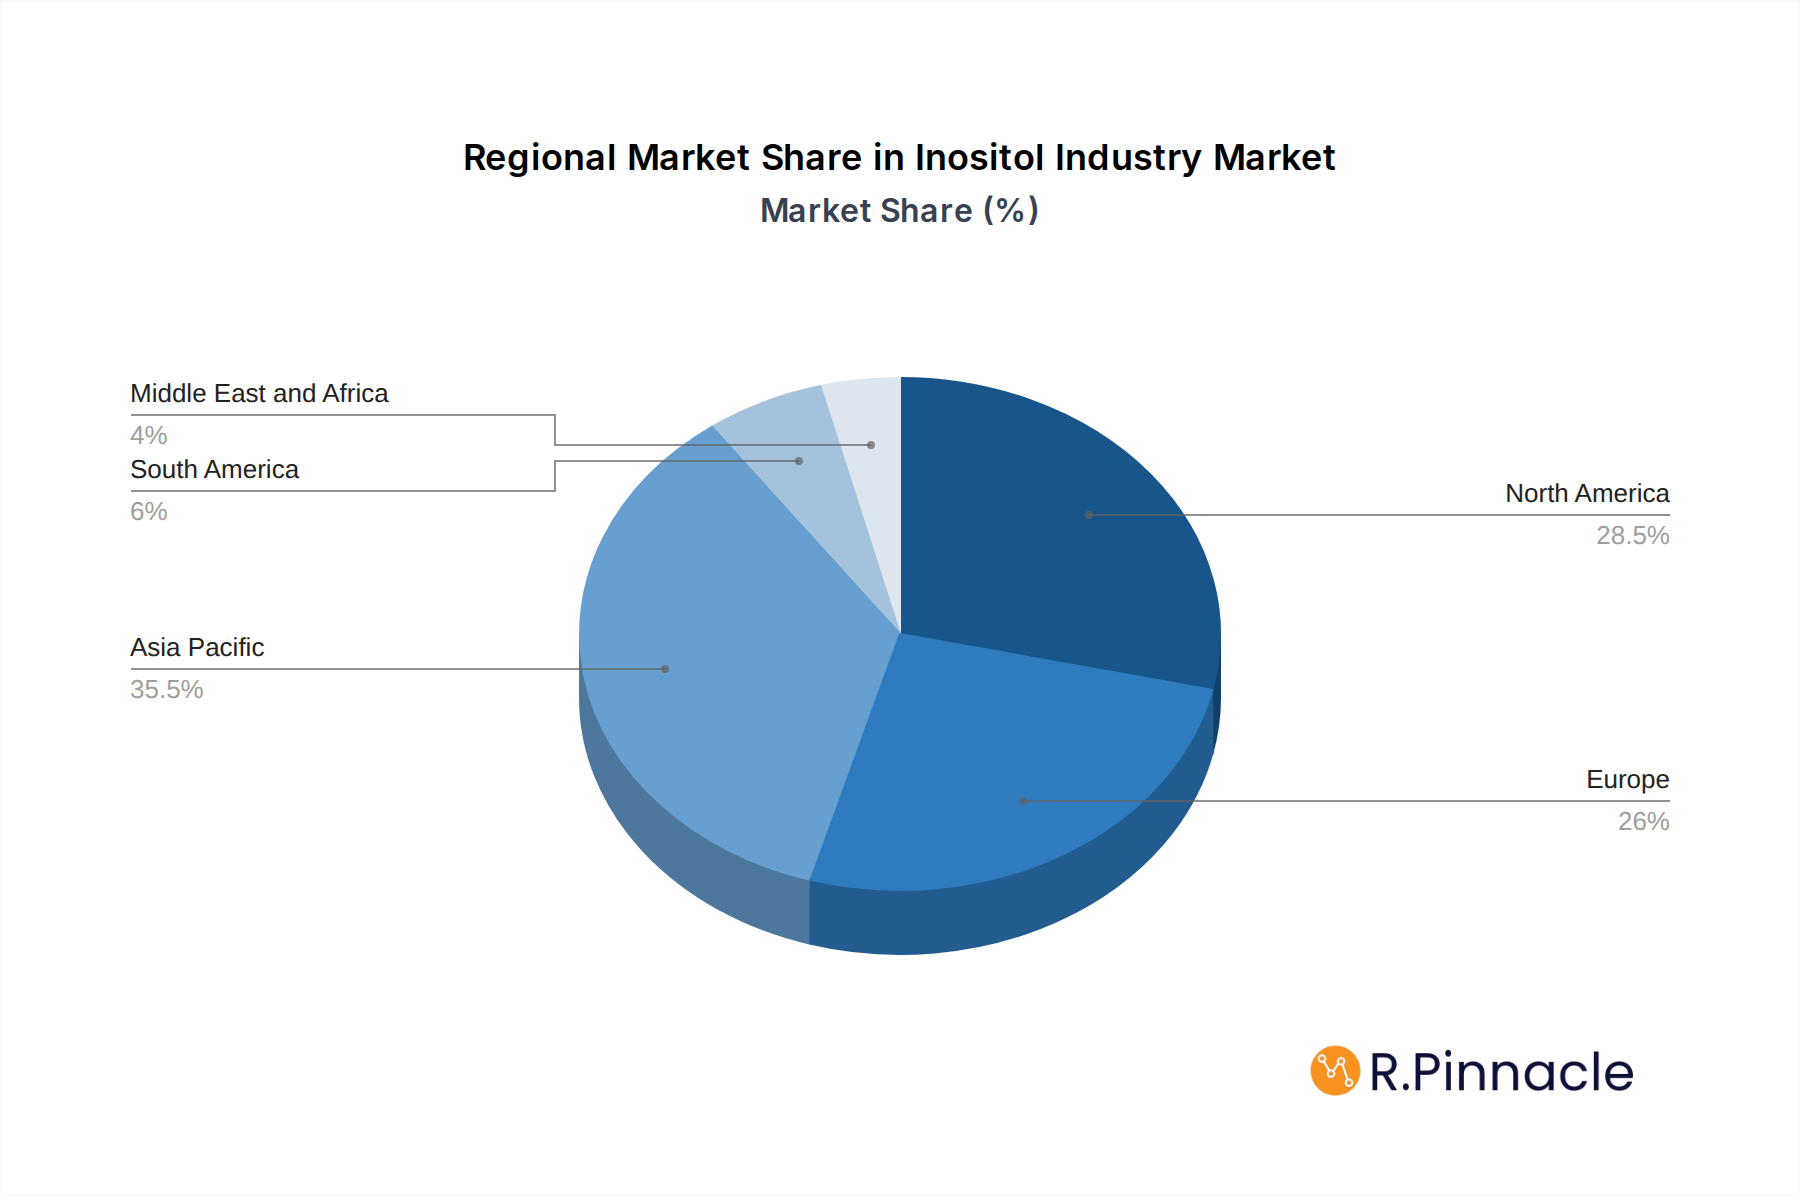
Inositol Industry Regional Market Share
Geographic Coverage of Inositol Industry
Inositol Industry REPORT HIGHLIGHTS
| Aspects | Details |
|---|---|
| Study Period | 2020-2034 |
| Base Year | 2025 |
| Estimated Year | 2026 |
| Forecast Period | 2026-2034 |
| Historical Period | 2020-2025 |
| Growth Rate | CAGR of 7.18% from 2020-2034 |
| Segmentation |
|
Table of Contents
- 1. Introduction
- 1.1. Research Scope
- 1.2. Market Segmentation
- 1.3. Research Objective
- 1.4. Definitions and Assumptions
- 2. Executive Summary
- 2.1. Market Snapshot
- 3. Market Dynamics
- 3.1. Market Drivers
- 3.2. Market Restrains
- 3.3. Market Trends
- 3.4. Market Opportunities
- 4. Market Factor Analysis
- 4.1. Porters Five Forces
- 4.1.1. Bargaining Power of Suppliers
- 4.1.2. Bargaining Power of Buyers
- 4.1.3. Threat of New Entrants
- 4.1.4. Threat of Substitutes
- 4.1.5. Competitive Rivalry
- 4.2. PESTEL analysis
- 4.3. BCG Analysis
- 4.3.1. Stars (High Growth, High Market Share)
- 4.3.2. Cash Cows (Low Growth, High Market Share)
- 4.3.3. Question Mark (High Growth, Low Market Share)
- 4.3.4. Dogs (Low Growth, Low Market Share)
- 4.4. Ansoff Matrix Analysis
- 4.5. Supply Chain Analysis
- 4.6. Regulatory Landscape
- 4.7. Current Market Potential and Opportunity Assessment (TAM–SAM–SOM Framework)
- 4.8. PRI Analyst Note
- 4.1. Porters Five Forces
- 5. Market Analysis, Insights and Forecast 2021-2033
- 5.1. Market Analysis, Insights and Forecast - by Source
- 5.1.1. Plant-based Inositol
- 5.1.2. Synthetic Inositol
- 5.2. Market Analysis, Insights and Forecast - by Application
- 5.2.1. Dietary Supplement
- 5.2.2. Beverage
- 5.2.3. Feed Industry
- 5.2.4. Pharmaceutical Industry
- 5.2.5. Other Applications
- 5.3. Market Analysis, Insights and Forecast - by Region
- 5.3.1. North America
- 5.3.2. Europe
- 5.3.3. Asia Pacific
- 5.3.4. South America
- 5.3.5. Middle East and Africa
- 5.1. Market Analysis, Insights and Forecast - by Source
- 6. Global Inositol Industry Analysis, Insights and Forecast, 2021-2033
- 6.1. Market Analysis, Insights and Forecast - by Source
- 6.1.1. Plant-based Inositol
- 6.1.2. Synthetic Inositol
- 6.2. Market Analysis, Insights and Forecast - by Application
- 6.2.1. Dietary Supplement
- 6.2.2. Beverage
- 6.2.3. Feed Industry
- 6.2.4. Pharmaceutical Industry
- 6.2.5. Other Applications
- 6.1. Market Analysis, Insights and Forecast - by Source
- 7. North America Inositol Industry Analysis, Insights and Forecast, 2020-2032
- 7.1. Market Analysis, Insights and Forecast - by Source
- 7.1.1. Plant-based Inositol
- 7.1.2. Synthetic Inositol
- 7.2. Market Analysis, Insights and Forecast - by Application
- 7.2.1. Dietary Supplement
- 7.2.2. Beverage
- 7.2.3. Feed Industry
- 7.2.4. Pharmaceutical Industry
- 7.2.5. Other Applications
- 7.1. Market Analysis, Insights and Forecast - by Source
- 8. Europe Inositol Industry Analysis, Insights and Forecast, 2020-2032
- 8.1. Market Analysis, Insights and Forecast - by Source
- 8.1.1. Plant-based Inositol
- 8.1.2. Synthetic Inositol
- 8.2. Market Analysis, Insights and Forecast - by Application
- 8.2.1. Dietary Supplement
- 8.2.2. Beverage
- 8.2.3. Feed Industry
- 8.2.4. Pharmaceutical Industry
- 8.2.5. Other Applications
- 8.1. Market Analysis, Insights and Forecast - by Source
- 9. Asia Pacific Inositol Industry Analysis, Insights and Forecast, 2020-2032
- 9.1. Market Analysis, Insights and Forecast - by Source
- 9.1.1. Plant-based Inositol
- 9.1.2. Synthetic Inositol
- 9.2. Market Analysis, Insights and Forecast - by Application
- 9.2.1. Dietary Supplement
- 9.2.2. Beverage
- 9.2.3. Feed Industry
- 9.2.4. Pharmaceutical Industry
- 9.2.5. Other Applications
- 9.1. Market Analysis, Insights and Forecast - by Source
- 10. South America Inositol Industry Analysis, Insights and Forecast, 2020-2032
- 10.1. Market Analysis, Insights and Forecast - by Source
- 10.1.1. Plant-based Inositol
- 10.1.2. Synthetic Inositol
- 10.2. Market Analysis, Insights and Forecast - by Application
- 10.2.1. Dietary Supplement
- 10.2.2. Beverage
- 10.2.3. Feed Industry
- 10.2.4. Pharmaceutical Industry
- 10.2.5. Other Applications
- 10.1. Market Analysis, Insights and Forecast - by Source
- 11. Middle East and Africa Inositol Industry Analysis, Insights and Forecast, 2020-2032
- 11.1. Market Analysis, Insights and Forecast - by Source
- 11.1.1. Plant-based Inositol
- 11.1.2. Synthetic Inositol
- 11.2. Market Analysis, Insights and Forecast - by Application
- 11.2.1. Dietary Supplement
- 11.2.2. Beverage
- 11.2.3. Feed Industry
- 11.2.4. Pharmaceutical Industry
- 11.2.5. Other Applications
- 11.1. Market Analysis, Insights and Forecast - by Source
- 12. Competitive Analysis
- 12.1. Company Profiles
- 12.1.1 Zhucheng Haotian Pharm Co Ltd
- 12.1.1.1. Company Overview
- 12.1.1.2. Products
- 12.1.1.3. Company Financials
- 12.1.1.4. SWOT Analysis
- 12.1.2 Mr Bill's Pipe & Tobacco Company
- 12.1.2.1. Company Overview
- 12.1.2.2. Products
- 12.1.2.3. Company Financials
- 12.1.2.4. SWOT Analysis
- 12.1.3 Asiamerica Group Inc
- 12.1.3.1. Company Overview
- 12.1.3.2. Products
- 12.1.3.3. Company Financials
- 12.1.3.4. SWOT Analysis
- 12.1.4 Ronas Chemicals Ind Co Ltd*List Not Exhaustive
- 12.1.4.1. Company Overview
- 12.1.4.2. Products
- 12.1.4.3. Company Financials
- 12.1.4.4. SWOT Analysis
- 12.1.5 Hebei Yuwei Biotechnology Co Ltd
- 12.1.5.1. Company Overview
- 12.1.5.2. Products
- 12.1.5.3. Company Financials
- 12.1.5.4. SWOT Analysis
- 12.1.6 Charles Bowman & Company
- 12.1.6.1. Company Overview
- 12.1.6.2. Products
- 12.1.6.3. Company Financials
- 12.1.6.4. SWOT Analysis
- 12.1.7 Koninklijke DSM NV
- 12.1.7.1. Company Overview
- 12.1.7.2. Products
- 12.1.7.3. Company Financials
- 12.1.7.4. SWOT Analysis
- 12.1.8 Shandong Runde Biotechnology Co
- 12.1.8.1. Company Overview
- 12.1.8.2. Products
- 12.1.8.3. Company Financials
- 12.1.8.4. SWOT Analysis
- 12.1.9 T J Clark & Company
- 12.1.9.1. Company Overview
- 12.1.9.2. Products
- 12.1.9.3. Company Financials
- 12.1.9.4. SWOT Analysis
- 12.1.10 Jingkai Biotechnology
- 12.1.10.1. Company Overview
- 12.1.10.2. Products
- 12.1.10.3. Company Financials
- 12.1.10.4. SWOT Analysis
- 12.1.1 Zhucheng Haotian Pharm Co Ltd
- 12.2. Market Entropy
- 12.2.1 Company's Key Areas Served
- 12.2.2 Recent Developments
- 12.3. Company Market Share Analysis 2025
- 12.3.1 Top 5 Companies Market Share Analysis
- 12.3.2 Top 3 Companies Market Share Analysis
- 12.4. List of Potential Customers
- 13. Research Methodology
List of Figures
- Figure 1: Global Inositol Industry Revenue Breakdown (Million, %) by Region 2025 & 2033
- Figure 2: North America Inositol Industry Revenue (Million), by Source 2025 & 2033
- Figure 3: North America Inositol Industry Revenue Share (%), by Source 2025 & 2033
- Figure 4: North America Inositol Industry Revenue (Million), by Application 2025 & 2033
- Figure 5: North America Inositol Industry Revenue Share (%), by Application 2025 & 2033
- Figure 6: North America Inositol Industry Revenue (Million), by Country 2025 & 2033
- Figure 7: North America Inositol Industry Revenue Share (%), by Country 2025 & 2033
- Figure 8: Europe Inositol Industry Revenue (Million), by Source 2025 & 2033
- Figure 9: Europe Inositol Industry Revenue Share (%), by Source 2025 & 2033
- Figure 10: Europe Inositol Industry Revenue (Million), by Application 2025 & 2033
- Figure 11: Europe Inositol Industry Revenue Share (%), by Application 2025 & 2033
- Figure 12: Europe Inositol Industry Revenue (Million), by Country 2025 & 2033
- Figure 13: Europe Inositol Industry Revenue Share (%), by Country 2025 & 2033
- Figure 14: Asia Pacific Inositol Industry Revenue (Million), by Source 2025 & 2033
- Figure 15: Asia Pacific Inositol Industry Revenue Share (%), by Source 2025 & 2033
- Figure 16: Asia Pacific Inositol Industry Revenue (Million), by Application 2025 & 2033
- Figure 17: Asia Pacific Inositol Industry Revenue Share (%), by Application 2025 & 2033
- Figure 18: Asia Pacific Inositol Industry Revenue (Million), by Country 2025 & 2033
- Figure 19: Asia Pacific Inositol Industry Revenue Share (%), by Country 2025 & 2033
- Figure 20: South America Inositol Industry Revenue (Million), by Source 2025 & 2033
- Figure 21: South America Inositol Industry Revenue Share (%), by Source 2025 & 2033
- Figure 22: South America Inositol Industry Revenue (Million), by Application 2025 & 2033
- Figure 23: South America Inositol Industry Revenue Share (%), by Application 2025 & 2033
- Figure 24: South America Inositol Industry Revenue (Million), by Country 2025 & 2033
- Figure 25: South America Inositol Industry Revenue Share (%), by Country 2025 & 2033
- Figure 26: Middle East and Africa Inositol Industry Revenue (Million), by Source 2025 & 2033
- Figure 27: Middle East and Africa Inositol Industry Revenue Share (%), by Source 2025 & 2033
- Figure 28: Middle East and Africa Inositol Industry Revenue (Million), by Application 2025 & 2033
- Figure 29: Middle East and Africa Inositol Industry Revenue Share (%), by Application 2025 & 2033
- Figure 30: Middle East and Africa Inositol Industry Revenue (Million), by Country 2025 & 2033
- Figure 31: Middle East and Africa Inositol Industry Revenue Share (%), by Country 2025 & 2033
List of Tables
- Table 1: Global Inositol Industry Revenue Million Forecast, by Source 2020 & 2033
- Table 2: Global Inositol Industry Revenue Million Forecast, by Application 2020 & 2033
- Table 3: Global Inositol Industry Revenue Million Forecast, by Region 2020 & 2033
- Table 4: Global Inositol Industry Revenue Million Forecast, by Source 2020 & 2033
- Table 5: Global Inositol Industry Revenue Million Forecast, by Application 2020 & 2033
- Table 6: Global Inositol Industry Revenue Million Forecast, by Country 2020 & 2033
- Table 7: United States Inositol Industry Revenue (Million) Forecast, by Application 2020 & 2033
- Table 8: Canada Inositol Industry Revenue (Million) Forecast, by Application 2020 & 2033
- Table 9: Mexico Inositol Industry Revenue (Million) Forecast, by Application 2020 & 2033
- Table 10: Rest of North America Inositol Industry Revenue (Million) Forecast, by Application 2020 & 2033
- Table 11: Global Inositol Industry Revenue Million Forecast, by Source 2020 & 2033
- Table 12: Global Inositol Industry Revenue Million Forecast, by Application 2020 & 2033
- Table 13: Global Inositol Industry Revenue Million Forecast, by Country 2020 & 2033
- Table 14: United Kingdom Inositol Industry Revenue (Million) Forecast, by Application 2020 & 2033
- Table 15: Germany Inositol Industry Revenue (Million) Forecast, by Application 2020 & 2033
- Table 16: France Inositol Industry Revenue (Million) Forecast, by Application 2020 & 2033
- Table 17: Russia Inositol Industry Revenue (Million) Forecast, by Application 2020 & 2033
- Table 18: Italy Inositol Industry Revenue (Million) Forecast, by Application 2020 & 2033
- Table 19: Spain Inositol Industry Revenue (Million) Forecast, by Application 2020 & 2033
- Table 20: Rest of Europe Inositol Industry Revenue (Million) Forecast, by Application 2020 & 2033
- Table 21: Global Inositol Industry Revenue Million Forecast, by Source 2020 & 2033
- Table 22: Global Inositol Industry Revenue Million Forecast, by Application 2020 & 2033
- Table 23: Global Inositol Industry Revenue Million Forecast, by Country 2020 & 2033
- Table 24: India Inositol Industry Revenue (Million) Forecast, by Application 2020 & 2033
- Table 25: China Inositol Industry Revenue (Million) Forecast, by Application 2020 & 2033
- Table 26: Japan Inositol Industry Revenue (Million) Forecast, by Application 2020 & 2033
- Table 27: Australia Inositol Industry Revenue (Million) Forecast, by Application 2020 & 2033
- Table 28: Rest of Asia Pacific Inositol Industry Revenue (Million) Forecast, by Application 2020 & 2033
- Table 29: Global Inositol Industry Revenue Million Forecast, by Source 2020 & 2033
- Table 30: Global Inositol Industry Revenue Million Forecast, by Application 2020 & 2033
- Table 31: Global Inositol Industry Revenue Million Forecast, by Country 2020 & 2033
- Table 32: Brazil Inositol Industry Revenue (Million) Forecast, by Application 2020 & 2033
- Table 33: Argentina Inositol Industry Revenue (Million) Forecast, by Application 2020 & 2033
- Table 34: Rest of South America Inositol Industry Revenue (Million) Forecast, by Application 2020 & 2033
- Table 35: Global Inositol Industry Revenue Million Forecast, by Source 2020 & 2033
- Table 36: Global Inositol Industry Revenue Million Forecast, by Application 2020 & 2033
- Table 37: Global Inositol Industry Revenue Million Forecast, by Country 2020 & 2033
- Table 38: South Africa Inositol Industry Revenue (Million) Forecast, by Application 2020 & 2033
- Table 39: Saudi Arabia Inositol Industry Revenue (Million) Forecast, by Application 2020 & 2033
- Table 40: Rest of Middle East and Africa Inositol Industry Revenue (Million) Forecast, by Application 2020 & 2033
Frequently Asked Questions
1. What is the projected Compound Annual Growth Rate (CAGR) of the Inositol Industry?
The projected CAGR is approximately 7.18%.
2. Which companies are prominent players in the Inositol Industry?
Key companies in the market include Zhucheng Haotian Pharm Co Ltd, Mr Bill's Pipe & Tobacco Company, Asiamerica Group Inc, Ronas Chemicals Ind Co Ltd*List Not Exhaustive, Hebei Yuwei Biotechnology Co Ltd, Charles Bowman & Company, Koninklijke DSM NV, Shandong Runde Biotechnology Co, T J Clark & Company, Jingkai Biotechnology.
3. What are the main segments of the Inositol Industry?
The market segments include Source, Application.
4. Can you provide details about the market size?
The market size is estimated to be USD 146.25 Million as of 2022.
5. What are some drivers contributing to market growth?
Increasing Demand for Clean Label Bakery Products; Increasing Popularity of Specialty Ingredients.
6. What are the notable trends driving market growth?
Increasing Demand for Inositol in Pharmaceutical Industry.
7. Are there any restraints impacting market growth?
Risk of Allergies.
8. Can you provide examples of recent developments in the market?
In March 2023, MD Logic Health, a leading provider of USA-made professional-grade nutraceuticals and physician-recommended dietary supplements, announced its second collaboration with Cynthia Thurlow, NP. The latest product developed under this collaboration is Inositol by Cynthia Thurlow, powered by MD Logic Health. Myo-inositol, a naturally occurring organic compound produced by the liver and kidney, is crucial in regulating the body's response and hormones associated with mood and cognition.
9. What pricing options are available for accessing the report?
Pricing options include single-user, multi-user, and enterprise licenses priced at USD 4750, USD 5250, and USD 8750 respectively.
10. Is the market size provided in terms of value or volume?
The market size is provided in terms of value, measured in Million.
11. Are there any specific market keywords associated with the report?
Yes, the market keyword associated with the report is "Inositol Industry," which aids in identifying and referencing the specific market segment covered.
12. How do I determine which pricing option suits my needs best?
The pricing options vary based on user requirements and access needs. Individual users may opt for single-user licenses, while businesses requiring broader access may choose multi-user or enterprise licenses for cost-effective access to the report.
13. Are there any additional resources or data provided in the Inositol Industry report?
While the report offers comprehensive insights, it's advisable to review the specific contents or supplementary materials provided to ascertain if additional resources or data are available.
14. How can I stay updated on further developments or reports in the Inositol Industry?
To stay informed about further developments, trends, and reports in the Inositol Industry, consider subscribing to industry newsletters, following relevant companies and organizations, or regularly checking reputable industry news sources and publications.
Methodology
Step 1 - Identification of Relevant Samples Size from Population Database


Step 2 - Approaches for Defining Global Market Size (Value, Volume* & Price*)

Note*: In applicable scenarios
Step 3 - Data Sources
Primary Research
- Web Analytics
- Survey Reports
- Research Institute
- Latest Research Reports
- Opinion Leaders
Secondary Research
- Annual Reports
- White Paper
- Latest Press Release
- Industry Association
- Paid Database
- Investor Presentations

Step 4 - Data Triangulation
Involves using different sources of information in order to increase the validity of a study
These sources are likely to be stakeholders in a program - participants, other researchers, program staff, other community members, and so on.
Then we put all data in single framework & apply various statistical tools to find out the dynamic on the market.
During the analysis stage, feedback from the stakeholder groups would be compared to determine areas of agreement as well as areas of divergence