
Key Insights
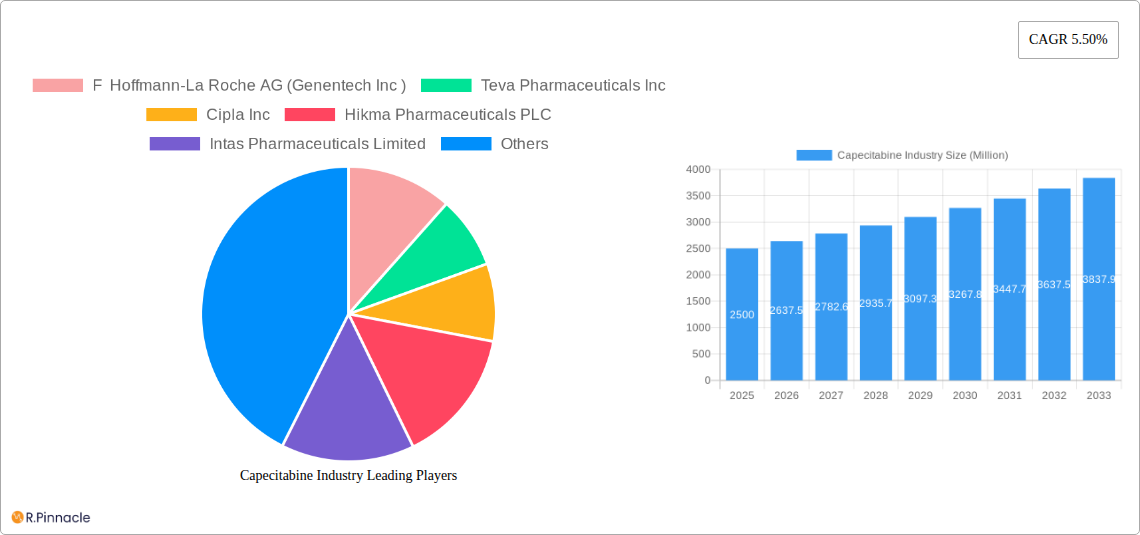
The global capecitabine market, valued at approximately $2.5 billion in 2025, is projected to experience robust growth, driven by a 5.5% CAGR from 2025 to 2033. This expansion is fueled by the increasing prevalence of colorectal and breast cancers, the two major indications for capecitabine. The rising incidence of these cancers, particularly in developing economies with expanding populations and improved healthcare infrastructure, significantly contributes to market growth. Furthermore, the increasing adoption of targeted therapies and advancements in chemotherapy regimens that incorporate capecitabine are bolstering market demand. Hospitals and clinical laboratories represent the dominant distribution channels, reflecting the crucial role of healthcare professionals in administering and monitoring capecitabine treatment. Competitive intensity is high, with major pharmaceutical players like Roche (Genentech), Teva, Cipla, and others vying for market share through strategic pricing, product innovation, and expansion into emerging markets. However, the market faces constraints including the emergence of biosimilar competition, potential side effects associated with capecitabine, and stringent regulatory hurdles in certain regions, which could moderately impact future growth trajectory.
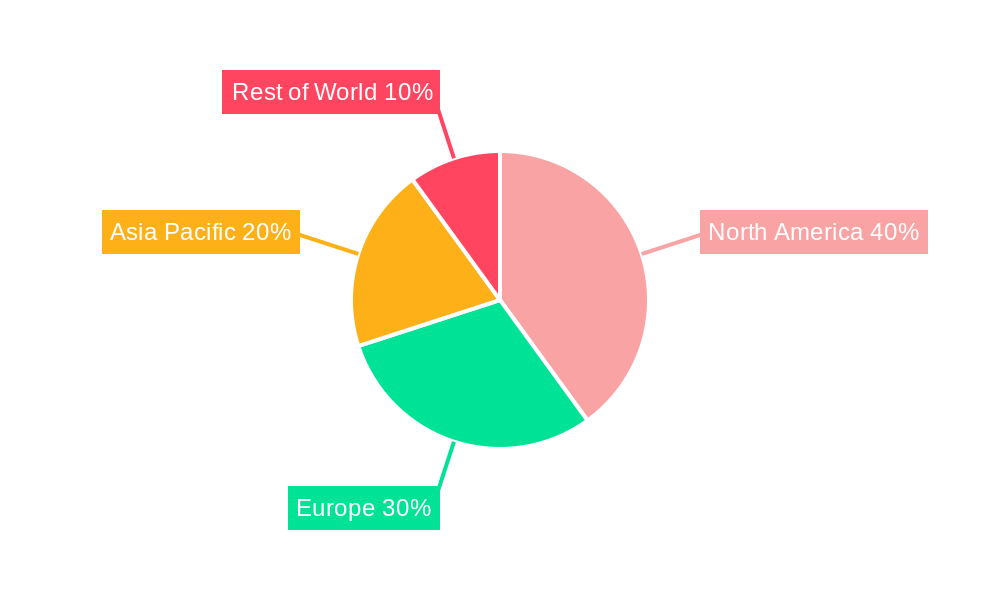
Despite these challenges, the long-term outlook remains positive due to the continuous rise in cancer diagnoses and the ongoing development of combination therapies that incorporate capecitabine. The market segmentation reflects the predominant role of colorectal and breast cancer indications, though other cancer types are contributing to the overall market. Geographic variations exist, with North America and Europe likely maintaining significant market shares due to higher healthcare expenditure and advanced medical infrastructure. However, Asia-Pacific is anticipated to show considerable growth potential in the forecast period driven by rising cancer prevalence and increased healthcare investments within the region. This dynamic interplay of drivers, trends, and restraints necessitates a keen understanding of regional nuances and competitive dynamics for successful market penetration and growth.
Capecitabine Industry Report: 2019-2033 Forecast
This comprehensive report provides an in-depth analysis of the global Capecitabine industry, offering valuable insights for industry professionals, investors, and strategic decision-makers. Covering the period from 2019 to 2033, with a base year of 2025 and a forecast period of 2025-2033, this report unveils market dynamics, growth drivers, challenges, and future opportunities within this critical pharmaceutical segment. The study utilizes rigorous data analysis to present a clear picture of the market's current state and future trajectory. The market size is projected to reach xx Million by 2033.
Capecitabine Industry Market Structure & Innovation Trends
The global Capecitabine market exhibits a moderately consolidated structure, with several key players holding significant market share. F Hoffmann-La Roche AG (Genentech Inc) currently holds an estimated xx% market share, followed by Teva Pharmaceuticals Inc at xx%, Cipla Inc at xx%, and other prominent players like Hikma Pharmaceuticals PLC and Sun Pharmaceutical Industries Limited. The market is characterized by continuous innovation driven by the need for improved efficacy, reduced side effects, and more convenient administration methods. Regulatory frameworks, such as those enforced by the FDA and EMA, heavily influence product development and market access. Generic competition is a significant factor, driving price pressures and impacting market profitability. Substitutes include other anti-cancer therapies, but Capecitabine's established efficacy in specific indications maintains its market position. M&A activity within the pharmaceutical industry, with deals valued at xx Million in recent years, has influenced market consolidation and reshaped the competitive landscape. The end-user demographics are primarily oncology specialists and patients diagnosed with colorectal or breast cancer.
- Market Concentration: Moderately consolidated, with top 5 players holding approximately xx% market share.
- Innovation Drivers: Improved efficacy, reduced side effects, convenient administration.
- Regulatory Frameworks: FDA and EMA regulations significantly influence product development and market access.
- M&A Activity: Recent deals valued at xx Million have shaped market dynamics.
Capecitabine Industry Market Dynamics & Trends
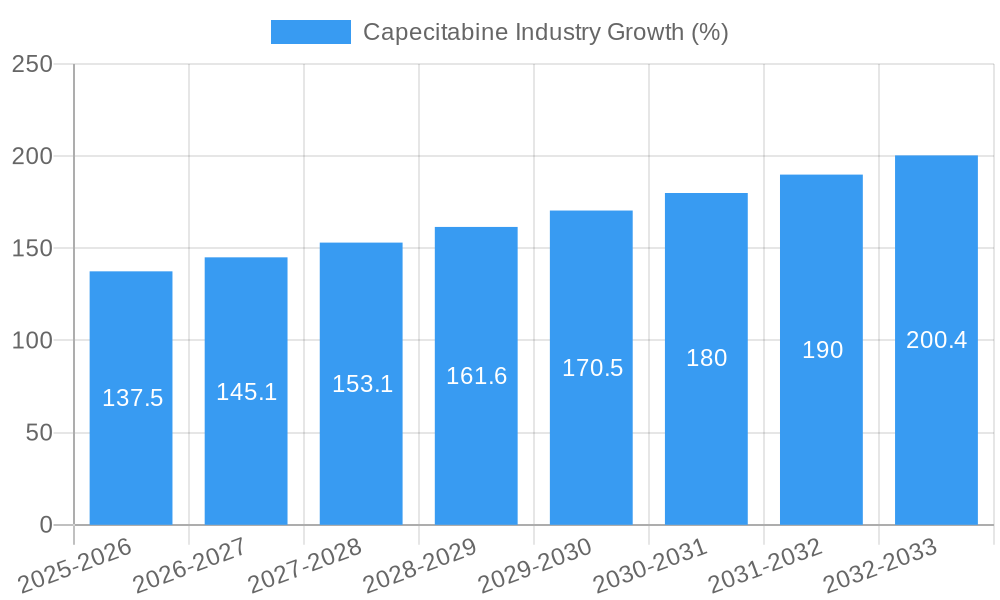
The Capecitabine market is experiencing steady growth, driven by rising cancer incidence rates globally, particularly colorectal and breast cancers. The Compound Annual Growth Rate (CAGR) is projected to be xx% during the forecast period (2025-2033). Technological advancements, including targeted drug delivery systems and personalized medicine approaches, are creating new opportunities for enhanced therapies. However, price sensitivity in emerging markets and the entry of generic drugs present significant challenges to market penetration. Changing consumer preferences towards minimally invasive treatments and improved quality of life are influencing demand. Competitive intensity remains high, with leading players focusing on R&D, strategic partnerships, and product diversification to maintain their market positions. Market penetration of Capecitabine in specific geographical regions varies significantly based on healthcare infrastructure and affordability.
Dominant Regions & Segments in Capecitabine Industry
The North American region currently holds the largest market share for Capecitabine, driven by high cancer prevalence rates, advanced healthcare infrastructure, and robust reimbursement policies. Within indications, colorectal cancer accounts for a significant portion of Capecitabine usage, followed by breast cancer. Hospitals are the primary distribution channel, contributing to the majority of sales.
- Key Drivers in North America:
- High cancer incidence rates.
- Advanced healthcare infrastructure.
- Strong reimbursement policies.
- Colorectal Cancer Dominance: High prevalence of the disease drives substantial demand.
- Hospital Distribution Channel: Hospitals represent the major route to market for Capecitabine.
Capecitabine Industry Product Innovations
Recent product innovations have focused on improving drug delivery methods, such as formulations with enhanced bioavailability and reduced side effects. These advancements aim to improve patient compliance and overall treatment outcomes, leading to better market fit and competitive advantages. The integration of advanced technologies is also being explored to enhance efficacy and personalization of treatment.
Report Scope & Segmentation Analysis
This report segments the Capecitabine market by indication (Colorectal Cancer, Breast Cancer, Others) and distribution channel (Hospitals, Clinical Laboratories, Others). Each segment exhibits unique growth trajectories and competitive dynamics, with colorectal cancer and hospitals currently holding dominant positions. Growth projections vary across segments, reflecting the specific market characteristics and anticipated trends.
- By Indication: Colorectal cancer segment is expected to grow at a CAGR of xx% driven by high prevalence, while Breast cancer segment is projected to grow at xx%. The "Others" segment is expected to show a CAGR of xx%.
- By Distribution Channel: Hospitals maintain a leading market share due to established infrastructure, with projected growth of xx%. Clinical laboratories and "Others" channels are expected to see CAGR of xx% and xx% respectively.
Key Drivers of Capecitabine Industry Growth
Several key factors drive the growth of the Capecitabine industry. These include the increasing prevalence of colorectal and breast cancers globally, continuous advancements in cancer treatment methodologies, and supportive regulatory frameworks. Furthermore, expanding healthcare infrastructure in emerging markets and rising healthcare expenditure contribute to market expansion.
Challenges in the Capecitabine Industry Sector
The Capecitabine industry faces several challenges including the emergence of generic competition impacting pricing and profitability, stringent regulatory hurdles delaying product approvals, potential supply chain disruptions impacting market availability and the emergence of novel therapies posing competitive pressures. These challenges could collectively impact the market growth by approximately xx% over the forecast period.
Emerging Opportunities in Capecitabine Industry
Emerging opportunities lie in the development of novel formulations, targeted therapies, and personalized medicine approaches. Expanding into untapped markets with unmet medical needs, particularly in emerging economies, presents significant potential. Focusing on improved patient compliance and enhanced drug delivery systems can also create significant opportunities for growth.
Leading Players in the Capecitabine Industry Market
- F Hoffmann-La Roche AG (Genentech Inc)
- Teva Pharmaceuticals Inc
- Cipla Inc
- Hikma Pharmaceuticals PLC
- Intas Pharmaceuticals Limited
- Fresenius SE & Co KGaA
- Armas Pharmaceuticals Inc
- Sun Pharmaceutical Industries Limited
- Dr Reddy's Laboratories Ltd
- Mylan N V
Key Developments in Capecitabine Industry
- 2022: Launch of a new Capecitabine formulation by Company X with improved bioavailability.
- 2023: Approval of a new indication for Capecitabine by the FDA.
- 2024: Strategic partnership between Company Y and Company Z to develop a targeted therapy.
Future Outlook for Capecitabine Industry Market
The Capecitabine market is poised for continued growth, driven by ongoing technological advancements, rising cancer incidence rates, and increased healthcare spending. Strategic initiatives, such as targeted drug delivery systems and personalized medicine approaches, will play a key role in shaping future market dynamics and driving growth beyond 2033. The market is expected to witness an overall positive growth trajectory fuelled by further innovation and expansion into new regions and therapeutic areas.
Capecitabine Industry Segmentation
-
1. Indication
- 1.1. Colorectal Cancer
- 1.2. Breast Cancer
- 1.3. Others
-
2. Distribution Channel
- 2.1. Hospitals
- 2.2. Clinical Laboratories
- 2.3. Others
Capecitabine Industry Segmentation By Geography
-
1. North America
- 1.1. United States
- 1.2. Canada
- 1.3. Mexico
-
2. Europe
- 2.1. Germany
- 2.2. United Kingdom
- 2.3. France
- 2.4. Italy
- 2.5. Spain
- 2.6. Rest of Europe
-
3. Asia Pacific
- 3.1. China
- 3.2. Japan
- 3.3. India
- 3.4. Australia
- 3.5. South Korea
- 3.6. Rest of Asia Pacific
-
4. Middle East and Africa
- 4.1. GCC
- 4.2. South Africa
- 4.3. Rest of Middle East and Africa
-
5. South America
- 5.1. Brazil
- 5.2. Argentina
- 5.3. Rest of South America
Capecitabine Industry REPORT HIGHLIGHTS
| Aspects | Details |
|---|---|
| Study Period | 2019-2033 |
| Base Year | 2024 |
| Estimated Year | 2025 |
| Forecast Period | 2025-2033 |
| Historical Period | 2019-2024 |
| Growth Rate | CAGR of 5.50% from 2019-2033 |
| Segmentation |
|
Table of Contents
- 1. Introduction
- 1.1. Research Scope
- 1.2. Market Segmentation
- 1.3. Research Methodology
- 1.4. Definitions and Assumptions
- 2. Executive Summary
- 2.1. Introduction
- 3. Market Dynamics
- 3.1. Introduction
- 3.2. Market Drivers
- 3.2.1. ; Rising Government Initiatives to Control Growing Global Cancer Burden; Increasing Incidence of Cancers Around the World
- 3.3. Market Restrains
- 3.3.1 ; Highly Expensive Products and Treatment; Rising Adoption of Substitutes like Raltitrexed
- 3.3.2 Irinotecan and Leucovorin for Adjuvant Therapy
- 3.4. Market Trends
- 3.4.1. Breast Cancer by Indication is Expected to Hold the Largest Market Share in the Global Capecitabine Market
- 4. Market Factor Analysis
- 4.1. Porters Five Forces
- 4.2. Supply/Value Chain
- 4.3. PESTEL analysis
- 4.4. Market Entropy
- 4.5. Patent/Trademark Analysis
- 5. Global Capecitabine Industry Analysis, Insights and Forecast, 2019-2031
- 5.1. Market Analysis, Insights and Forecast - by Indication
- 5.1.1. Colorectal Cancer
- 5.1.2. Breast Cancer
- 5.1.3. Others
- 5.2. Market Analysis, Insights and Forecast - by Distribution Channel
- 5.2.1. Hospitals
- 5.2.2. Clinical Laboratories
- 5.2.3. Others
- 5.3. Market Analysis, Insights and Forecast - by Region
- 5.3.1. North America
- 5.3.2. Europe
- 5.3.3. Asia Pacific
- 5.3.4. Middle East and Africa
- 5.3.5. South America
- 5.1. Market Analysis, Insights and Forecast - by Indication
- 6. North America Capecitabine Industry Analysis, Insights and Forecast, 2019-2031
- 6.1. Market Analysis, Insights and Forecast - by Indication
- 6.1.1. Colorectal Cancer
- 6.1.2. Breast Cancer
- 6.1.3. Others
- 6.2. Market Analysis, Insights and Forecast - by Distribution Channel
- 6.2.1. Hospitals
- 6.2.2. Clinical Laboratories
- 6.2.3. Others
- 6.1. Market Analysis, Insights and Forecast - by Indication
- 7. Europe Capecitabine Industry Analysis, Insights and Forecast, 2019-2031
- 7.1. Market Analysis, Insights and Forecast - by Indication
- 7.1.1. Colorectal Cancer
- 7.1.2. Breast Cancer
- 7.1.3. Others
- 7.2. Market Analysis, Insights and Forecast - by Distribution Channel
- 7.2.1. Hospitals
- 7.2.2. Clinical Laboratories
- 7.2.3. Others
- 7.1. Market Analysis, Insights and Forecast - by Indication
- 8. Asia Pacific Capecitabine Industry Analysis, Insights and Forecast, 2019-2031
- 8.1. Market Analysis, Insights and Forecast - by Indication
- 8.1.1. Colorectal Cancer
- 8.1.2. Breast Cancer
- 8.1.3. Others
- 8.2. Market Analysis, Insights and Forecast - by Distribution Channel
- 8.2.1. Hospitals
- 8.2.2. Clinical Laboratories
- 8.2.3. Others
- 8.1. Market Analysis, Insights and Forecast - by Indication
- 9. Middle East and Africa Capecitabine Industry Analysis, Insights and Forecast, 2019-2031
- 9.1. Market Analysis, Insights and Forecast - by Indication
- 9.1.1. Colorectal Cancer
- 9.1.2. Breast Cancer
- 9.1.3. Others
- 9.2. Market Analysis, Insights and Forecast - by Distribution Channel
- 9.2.1. Hospitals
- 9.2.2. Clinical Laboratories
- 9.2.3. Others
- 9.1. Market Analysis, Insights and Forecast - by Indication
- 10. South America Capecitabine Industry Analysis, Insights and Forecast, 2019-2031
- 10.1. Market Analysis, Insights and Forecast - by Indication
- 10.1.1. Colorectal Cancer
- 10.1.2. Breast Cancer
- 10.1.3. Others
- 10.2. Market Analysis, Insights and Forecast - by Distribution Channel
- 10.2.1. Hospitals
- 10.2.2. Clinical Laboratories
- 10.2.3. Others
- 10.1. Market Analysis, Insights and Forecast - by Indication
- 11. North America Capecitabine Industry Analysis, Insights and Forecast, 2019-2031
- 11.1. Market Analysis, Insights and Forecast - By Country/Sub-region
- 11.1.1 United States
- 11.1.2 Canada
- 11.1.3 Mexico
- 12. Europe Capecitabine Industry Analysis, Insights and Forecast, 2019-2031
- 12.1. Market Analysis, Insights and Forecast - By Country/Sub-region
- 12.1.1 Germany
- 12.1.2 United Kingdom
- 12.1.3 France
- 12.1.4 Italy
- 12.1.5 Spain
- 12.1.6 Rest of Europe
- 13. Asia Pacific Capecitabine Industry Analysis, Insights and Forecast, 2019-2031
- 13.1. Market Analysis, Insights and Forecast - By Country/Sub-region
- 13.1.1 China
- 13.1.2 Japan
- 13.1.3 India
- 13.1.4 Australia
- 13.1.5 South Korea
- 13.1.6 Rest of Asia Pacific
- 14. Middle East and Africa Capecitabine Industry Analysis, Insights and Forecast, 2019-2031
- 14.1. Market Analysis, Insights and Forecast - By Country/Sub-region
- 14.1.1 GCC
- 14.1.2 South Africa
- 14.1.3 Rest of Middle East and Africa
- 15. South America Capecitabine Industry Analysis, Insights and Forecast, 2019-2031
- 15.1. Market Analysis, Insights and Forecast - By Country/Sub-region
- 15.1.1 Brazil
- 15.1.2 Argentina
- 15.1.3 Rest of South America
- 16. Competitive Analysis
- 16.1. Global Market Share Analysis 2024
- 16.2. Company Profiles
- 16.2.1 F Hoffmann-La Roche AG (Genentech Inc )
- 16.2.1.1. Overview
- 16.2.1.2. Products
- 16.2.1.3. SWOT Analysis
- 16.2.1.4. Recent Developments
- 16.2.1.5. Financials (Based on Availability)
- 16.2.2 Teva Pharmaceuticals Inc
- 16.2.2.1. Overview
- 16.2.2.2. Products
- 16.2.2.3. SWOT Analysis
- 16.2.2.4. Recent Developments
- 16.2.2.5. Financials (Based on Availability)
- 16.2.3 Cipla Inc
- 16.2.3.1. Overview
- 16.2.3.2. Products
- 16.2.3.3. SWOT Analysis
- 16.2.3.4. Recent Developments
- 16.2.3.5. Financials (Based on Availability)
- 16.2.4 Hikma Pharmaceuticals PLC
- 16.2.4.1. Overview
- 16.2.4.2. Products
- 16.2.4.3. SWOT Analysis
- 16.2.4.4. Recent Developments
- 16.2.4.5. Financials (Based on Availability)
- 16.2.5 Intas Pharmaceuticals Limited
- 16.2.5.1. Overview
- 16.2.5.2. Products
- 16.2.5.3. SWOT Analysis
- 16.2.5.4. Recent Developments
- 16.2.5.5. Financials (Based on Availability)
- 16.2.6 Fresenius SE & Co KGaA
- 16.2.6.1. Overview
- 16.2.6.2. Products
- 16.2.6.3. SWOT Analysis
- 16.2.6.4. Recent Developments
- 16.2.6.5. Financials (Based on Availability)
- 16.2.7 Armas Pharmaceuticals Inc
- 16.2.7.1. Overview
- 16.2.7.2. Products
- 16.2.7.3. SWOT Analysis
- 16.2.7.4. Recent Developments
- 16.2.7.5. Financials (Based on Availability)
- 16.2.8 Sun Pharmaceutical Industries Limited
- 16.2.8.1. Overview
- 16.2.8.2. Products
- 16.2.8.3. SWOT Analysis
- 16.2.8.4. Recent Developments
- 16.2.8.5. Financials (Based on Availability)
- 16.2.9 Dr Reddy's Laboratories Ltd
- 16.2.9.1. Overview
- 16.2.9.2. Products
- 16.2.9.3. SWOT Analysis
- 16.2.9.4. Recent Developments
- 16.2.9.5. Financials (Based on Availability)
- 16.2.10 Mylan N V
- 16.2.10.1. Overview
- 16.2.10.2. Products
- 16.2.10.3. SWOT Analysis
- 16.2.10.4. Recent Developments
- 16.2.10.5. Financials (Based on Availability)
- 16.2.1 F Hoffmann-La Roche AG (Genentech Inc )
List of Figures
- Figure 1: Global Capecitabine Industry Revenue Breakdown (Million, %) by Region 2024 & 2032
- Figure 2: Global Capecitabine Industry Volume Breakdown (K Unit, %) by Region 2024 & 2032
- Figure 3: North America Capecitabine Industry Revenue (Million), by Country 2024 & 2032
- Figure 4: North America Capecitabine Industry Volume (K Unit), by Country 2024 & 2032
- Figure 5: North America Capecitabine Industry Revenue Share (%), by Country 2024 & 2032
- Figure 6: North America Capecitabine Industry Volume Share (%), by Country 2024 & 2032
- Figure 7: Europe Capecitabine Industry Revenue (Million), by Country 2024 & 2032
- Figure 8: Europe Capecitabine Industry Volume (K Unit), by Country 2024 & 2032
- Figure 9: Europe Capecitabine Industry Revenue Share (%), by Country 2024 & 2032
- Figure 10: Europe Capecitabine Industry Volume Share (%), by Country 2024 & 2032
- Figure 11: Asia Pacific Capecitabine Industry Revenue (Million), by Country 2024 & 2032
- Figure 12: Asia Pacific Capecitabine Industry Volume (K Unit), by Country 2024 & 2032
- Figure 13: Asia Pacific Capecitabine Industry Revenue Share (%), by Country 2024 & 2032
- Figure 14: Asia Pacific Capecitabine Industry Volume Share (%), by Country 2024 & 2032
- Figure 15: Middle East and Africa Capecitabine Industry Revenue (Million), by Country 2024 & 2032
- Figure 16: Middle East and Africa Capecitabine Industry Volume (K Unit), by Country 2024 & 2032
- Figure 17: Middle East and Africa Capecitabine Industry Revenue Share (%), by Country 2024 & 2032
- Figure 18: Middle East and Africa Capecitabine Industry Volume Share (%), by Country 2024 & 2032
- Figure 19: South America Capecitabine Industry Revenue (Million), by Country 2024 & 2032
- Figure 20: South America Capecitabine Industry Volume (K Unit), by Country 2024 & 2032
- Figure 21: South America Capecitabine Industry Revenue Share (%), by Country 2024 & 2032
- Figure 22: South America Capecitabine Industry Volume Share (%), by Country 2024 & 2032
- Figure 23: North America Capecitabine Industry Revenue (Million), by Indication 2024 & 2032
- Figure 24: North America Capecitabine Industry Volume (K Unit), by Indication 2024 & 2032
- Figure 25: North America Capecitabine Industry Revenue Share (%), by Indication 2024 & 2032
- Figure 26: North America Capecitabine Industry Volume Share (%), by Indication 2024 & 2032
- Figure 27: North America Capecitabine Industry Revenue (Million), by Distribution Channel 2024 & 2032
- Figure 28: North America Capecitabine Industry Volume (K Unit), by Distribution Channel 2024 & 2032
- Figure 29: North America Capecitabine Industry Revenue Share (%), by Distribution Channel 2024 & 2032
- Figure 30: North America Capecitabine Industry Volume Share (%), by Distribution Channel 2024 & 2032
- Figure 31: North America Capecitabine Industry Revenue (Million), by Country 2024 & 2032
- Figure 32: North America Capecitabine Industry Volume (K Unit), by Country 2024 & 2032
- Figure 33: North America Capecitabine Industry Revenue Share (%), by Country 2024 & 2032
- Figure 34: North America Capecitabine Industry Volume Share (%), by Country 2024 & 2032
- Figure 35: Europe Capecitabine Industry Revenue (Million), by Indication 2024 & 2032
- Figure 36: Europe Capecitabine Industry Volume (K Unit), by Indication 2024 & 2032
- Figure 37: Europe Capecitabine Industry Revenue Share (%), by Indication 2024 & 2032
- Figure 38: Europe Capecitabine Industry Volume Share (%), by Indication 2024 & 2032
- Figure 39: Europe Capecitabine Industry Revenue (Million), by Distribution Channel 2024 & 2032
- Figure 40: Europe Capecitabine Industry Volume (K Unit), by Distribution Channel 2024 & 2032
- Figure 41: Europe Capecitabine Industry Revenue Share (%), by Distribution Channel 2024 & 2032
- Figure 42: Europe Capecitabine Industry Volume Share (%), by Distribution Channel 2024 & 2032
- Figure 43: Europe Capecitabine Industry Revenue (Million), by Country 2024 & 2032
- Figure 44: Europe Capecitabine Industry Volume (K Unit), by Country 2024 & 2032
- Figure 45: Europe Capecitabine Industry Revenue Share (%), by Country 2024 & 2032
- Figure 46: Europe Capecitabine Industry Volume Share (%), by Country 2024 & 2032
- Figure 47: Asia Pacific Capecitabine Industry Revenue (Million), by Indication 2024 & 2032
- Figure 48: Asia Pacific Capecitabine Industry Volume (K Unit), by Indication 2024 & 2032
- Figure 49: Asia Pacific Capecitabine Industry Revenue Share (%), by Indication 2024 & 2032
- Figure 50: Asia Pacific Capecitabine Industry Volume Share (%), by Indication 2024 & 2032
- Figure 51: Asia Pacific Capecitabine Industry Revenue (Million), by Distribution Channel 2024 & 2032
- Figure 52: Asia Pacific Capecitabine Industry Volume (K Unit), by Distribution Channel 2024 & 2032
- Figure 53: Asia Pacific Capecitabine Industry Revenue Share (%), by Distribution Channel 2024 & 2032
- Figure 54: Asia Pacific Capecitabine Industry Volume Share (%), by Distribution Channel 2024 & 2032
- Figure 55: Asia Pacific Capecitabine Industry Revenue (Million), by Country 2024 & 2032
- Figure 56: Asia Pacific Capecitabine Industry Volume (K Unit), by Country 2024 & 2032
- Figure 57: Asia Pacific Capecitabine Industry Revenue Share (%), by Country 2024 & 2032
- Figure 58: Asia Pacific Capecitabine Industry Volume Share (%), by Country 2024 & 2032
- Figure 59: Middle East and Africa Capecitabine Industry Revenue (Million), by Indication 2024 & 2032
- Figure 60: Middle East and Africa Capecitabine Industry Volume (K Unit), by Indication 2024 & 2032
- Figure 61: Middle East and Africa Capecitabine Industry Revenue Share (%), by Indication 2024 & 2032
- Figure 62: Middle East and Africa Capecitabine Industry Volume Share (%), by Indication 2024 & 2032
- Figure 63: Middle East and Africa Capecitabine Industry Revenue (Million), by Distribution Channel 2024 & 2032
- Figure 64: Middle East and Africa Capecitabine Industry Volume (K Unit), by Distribution Channel 2024 & 2032
- Figure 65: Middle East and Africa Capecitabine Industry Revenue Share (%), by Distribution Channel 2024 & 2032
- Figure 66: Middle East and Africa Capecitabine Industry Volume Share (%), by Distribution Channel 2024 & 2032
- Figure 67: Middle East and Africa Capecitabine Industry Revenue (Million), by Country 2024 & 2032
- Figure 68: Middle East and Africa Capecitabine Industry Volume (K Unit), by Country 2024 & 2032
- Figure 69: Middle East and Africa Capecitabine Industry Revenue Share (%), by Country 2024 & 2032
- Figure 70: Middle East and Africa Capecitabine Industry Volume Share (%), by Country 2024 & 2032
- Figure 71: South America Capecitabine Industry Revenue (Million), by Indication 2024 & 2032
- Figure 72: South America Capecitabine Industry Volume (K Unit), by Indication 2024 & 2032
- Figure 73: South America Capecitabine Industry Revenue Share (%), by Indication 2024 & 2032
- Figure 74: South America Capecitabine Industry Volume Share (%), by Indication 2024 & 2032
- Figure 75: South America Capecitabine Industry Revenue (Million), by Distribution Channel 2024 & 2032
- Figure 76: South America Capecitabine Industry Volume (K Unit), by Distribution Channel 2024 & 2032
- Figure 77: South America Capecitabine Industry Revenue Share (%), by Distribution Channel 2024 & 2032
- Figure 78: South America Capecitabine Industry Volume Share (%), by Distribution Channel 2024 & 2032
- Figure 79: South America Capecitabine Industry Revenue (Million), by Country 2024 & 2032
- Figure 80: South America Capecitabine Industry Volume (K Unit), by Country 2024 & 2032
- Figure 81: South America Capecitabine Industry Revenue Share (%), by Country 2024 & 2032
- Figure 82: South America Capecitabine Industry Volume Share (%), by Country 2024 & 2032
List of Tables
- Table 1: Global Capecitabine Industry Revenue Million Forecast, by Region 2019 & 2032
- Table 2: Global Capecitabine Industry Volume K Unit Forecast, by Region 2019 & 2032
- Table 3: Global Capecitabine Industry Revenue Million Forecast, by Indication 2019 & 2032
- Table 4: Global Capecitabine Industry Volume K Unit Forecast, by Indication 2019 & 2032
- Table 5: Global Capecitabine Industry Revenue Million Forecast, by Distribution Channel 2019 & 2032
- Table 6: Global Capecitabine Industry Volume K Unit Forecast, by Distribution Channel 2019 & 2032
- Table 7: Global Capecitabine Industry Revenue Million Forecast, by Region 2019 & 2032
- Table 8: Global Capecitabine Industry Volume K Unit Forecast, by Region 2019 & 2032
- Table 9: Global Capecitabine Industry Revenue Million Forecast, by Country 2019 & 2032
- Table 10: Global Capecitabine Industry Volume K Unit Forecast, by Country 2019 & 2032
- Table 11: United States Capecitabine Industry Revenue (Million) Forecast, by Application 2019 & 2032
- Table 12: United States Capecitabine Industry Volume (K Unit) Forecast, by Application 2019 & 2032
- Table 13: Canada Capecitabine Industry Revenue (Million) Forecast, by Application 2019 & 2032
- Table 14: Canada Capecitabine Industry Volume (K Unit) Forecast, by Application 2019 & 2032
- Table 15: Mexico Capecitabine Industry Revenue (Million) Forecast, by Application 2019 & 2032
- Table 16: Mexico Capecitabine Industry Volume (K Unit) Forecast, by Application 2019 & 2032
- Table 17: Global Capecitabine Industry Revenue Million Forecast, by Country 2019 & 2032
- Table 18: Global Capecitabine Industry Volume K Unit Forecast, by Country 2019 & 2032
- Table 19: Germany Capecitabine Industry Revenue (Million) Forecast, by Application 2019 & 2032
- Table 20: Germany Capecitabine Industry Volume (K Unit) Forecast, by Application 2019 & 2032
- Table 21: United Kingdom Capecitabine Industry Revenue (Million) Forecast, by Application 2019 & 2032
- Table 22: United Kingdom Capecitabine Industry Volume (K Unit) Forecast, by Application 2019 & 2032
- Table 23: France Capecitabine Industry Revenue (Million) Forecast, by Application 2019 & 2032
- Table 24: France Capecitabine Industry Volume (K Unit) Forecast, by Application 2019 & 2032
- Table 25: Italy Capecitabine Industry Revenue (Million) Forecast, by Application 2019 & 2032
- Table 26: Italy Capecitabine Industry Volume (K Unit) Forecast, by Application 2019 & 2032
- Table 27: Spain Capecitabine Industry Revenue (Million) Forecast, by Application 2019 & 2032
- Table 28: Spain Capecitabine Industry Volume (K Unit) Forecast, by Application 2019 & 2032
- Table 29: Rest of Europe Capecitabine Industry Revenue (Million) Forecast, by Application 2019 & 2032
- Table 30: Rest of Europe Capecitabine Industry Volume (K Unit) Forecast, by Application 2019 & 2032
- Table 31: Global Capecitabine Industry Revenue Million Forecast, by Country 2019 & 2032
- Table 32: Global Capecitabine Industry Volume K Unit Forecast, by Country 2019 & 2032
- Table 33: China Capecitabine Industry Revenue (Million) Forecast, by Application 2019 & 2032
- Table 34: China Capecitabine Industry Volume (K Unit) Forecast, by Application 2019 & 2032
- Table 35: Japan Capecitabine Industry Revenue (Million) Forecast, by Application 2019 & 2032
- Table 36: Japan Capecitabine Industry Volume (K Unit) Forecast, by Application 2019 & 2032
- Table 37: India Capecitabine Industry Revenue (Million) Forecast, by Application 2019 & 2032
- Table 38: India Capecitabine Industry Volume (K Unit) Forecast, by Application 2019 & 2032
- Table 39: Australia Capecitabine Industry Revenue (Million) Forecast, by Application 2019 & 2032
- Table 40: Australia Capecitabine Industry Volume (K Unit) Forecast, by Application 2019 & 2032
- Table 41: South Korea Capecitabine Industry Revenue (Million) Forecast, by Application 2019 & 2032
- Table 42: South Korea Capecitabine Industry Volume (K Unit) Forecast, by Application 2019 & 2032
- Table 43: Rest of Asia Pacific Capecitabine Industry Revenue (Million) Forecast, by Application 2019 & 2032
- Table 44: Rest of Asia Pacific Capecitabine Industry Volume (K Unit) Forecast, by Application 2019 & 2032
- Table 45: Global Capecitabine Industry Revenue Million Forecast, by Country 2019 & 2032
- Table 46: Global Capecitabine Industry Volume K Unit Forecast, by Country 2019 & 2032
- Table 47: GCC Capecitabine Industry Revenue (Million) Forecast, by Application 2019 & 2032
- Table 48: GCC Capecitabine Industry Volume (K Unit) Forecast, by Application 2019 & 2032
- Table 49: South Africa Capecitabine Industry Revenue (Million) Forecast, by Application 2019 & 2032
- Table 50: South Africa Capecitabine Industry Volume (K Unit) Forecast, by Application 2019 & 2032
- Table 51: Rest of Middle East and Africa Capecitabine Industry Revenue (Million) Forecast, by Application 2019 & 2032
- Table 52: Rest of Middle East and Africa Capecitabine Industry Volume (K Unit) Forecast, by Application 2019 & 2032
- Table 53: Global Capecitabine Industry Revenue Million Forecast, by Country 2019 & 2032
- Table 54: Global Capecitabine Industry Volume K Unit Forecast, by Country 2019 & 2032
- Table 55: Brazil Capecitabine Industry Revenue (Million) Forecast, by Application 2019 & 2032
- Table 56: Brazil Capecitabine Industry Volume (K Unit) Forecast, by Application 2019 & 2032
- Table 57: Argentina Capecitabine Industry Revenue (Million) Forecast, by Application 2019 & 2032
- Table 58: Argentina Capecitabine Industry Volume (K Unit) Forecast, by Application 2019 & 2032
- Table 59: Rest of South America Capecitabine Industry Revenue (Million) Forecast, by Application 2019 & 2032
- Table 60: Rest of South America Capecitabine Industry Volume (K Unit) Forecast, by Application 2019 & 2032
- Table 61: Global Capecitabine Industry Revenue Million Forecast, by Indication 2019 & 2032
- Table 62: Global Capecitabine Industry Volume K Unit Forecast, by Indication 2019 & 2032
- Table 63: Global Capecitabine Industry Revenue Million Forecast, by Distribution Channel 2019 & 2032
- Table 64: Global Capecitabine Industry Volume K Unit Forecast, by Distribution Channel 2019 & 2032
- Table 65: Global Capecitabine Industry Revenue Million Forecast, by Country 2019 & 2032
- Table 66: Global Capecitabine Industry Volume K Unit Forecast, by Country 2019 & 2032
- Table 67: United States Capecitabine Industry Revenue (Million) Forecast, by Application 2019 & 2032
- Table 68: United States Capecitabine Industry Volume (K Unit) Forecast, by Application 2019 & 2032
- Table 69: Canada Capecitabine Industry Revenue (Million) Forecast, by Application 2019 & 2032
- Table 70: Canada Capecitabine Industry Volume (K Unit) Forecast, by Application 2019 & 2032
- Table 71: Mexico Capecitabine Industry Revenue (Million) Forecast, by Application 2019 & 2032
- Table 72: Mexico Capecitabine Industry Volume (K Unit) Forecast, by Application 2019 & 2032
- Table 73: Global Capecitabine Industry Revenue Million Forecast, by Indication 2019 & 2032
- Table 74: Global Capecitabine Industry Volume K Unit Forecast, by Indication 2019 & 2032
- Table 75: Global Capecitabine Industry Revenue Million Forecast, by Distribution Channel 2019 & 2032
- Table 76: Global Capecitabine Industry Volume K Unit Forecast, by Distribution Channel 2019 & 2032
- Table 77: Global Capecitabine Industry Revenue Million Forecast, by Country 2019 & 2032
- Table 78: Global Capecitabine Industry Volume K Unit Forecast, by Country 2019 & 2032
- Table 79: Germany Capecitabine Industry Revenue (Million) Forecast, by Application 2019 & 2032
- Table 80: Germany Capecitabine Industry Volume (K Unit) Forecast, by Application 2019 & 2032
- Table 81: United Kingdom Capecitabine Industry Revenue (Million) Forecast, by Application 2019 & 2032
- Table 82: United Kingdom Capecitabine Industry Volume (K Unit) Forecast, by Application 2019 & 2032
- Table 83: France Capecitabine Industry Revenue (Million) Forecast, by Application 2019 & 2032
- Table 84: France Capecitabine Industry Volume (K Unit) Forecast, by Application 2019 & 2032
- Table 85: Italy Capecitabine Industry Revenue (Million) Forecast, by Application 2019 & 2032
- Table 86: Italy Capecitabine Industry Volume (K Unit) Forecast, by Application 2019 & 2032
- Table 87: Spain Capecitabine Industry Revenue (Million) Forecast, by Application 2019 & 2032
- Table 88: Spain Capecitabine Industry Volume (K Unit) Forecast, by Application 2019 & 2032
- Table 89: Rest of Europe Capecitabine Industry Revenue (Million) Forecast, by Application 2019 & 2032
- Table 90: Rest of Europe Capecitabine Industry Volume (K Unit) Forecast, by Application 2019 & 2032
- Table 91: Global Capecitabine Industry Revenue Million Forecast, by Indication 2019 & 2032
- Table 92: Global Capecitabine Industry Volume K Unit Forecast, by Indication 2019 & 2032
- Table 93: Global Capecitabine Industry Revenue Million Forecast, by Distribution Channel 2019 & 2032
- Table 94: Global Capecitabine Industry Volume K Unit Forecast, by Distribution Channel 2019 & 2032
- Table 95: Global Capecitabine Industry Revenue Million Forecast, by Country 2019 & 2032
- Table 96: Global Capecitabine Industry Volume K Unit Forecast, by Country 2019 & 2032
- Table 97: China Capecitabine Industry Revenue (Million) Forecast, by Application 2019 & 2032
- Table 98: China Capecitabine Industry Volume (K Unit) Forecast, by Application 2019 & 2032
- Table 99: Japan Capecitabine Industry Revenue (Million) Forecast, by Application 2019 & 2032
- Table 100: Japan Capecitabine Industry Volume (K Unit) Forecast, by Application 2019 & 2032
- Table 101: India Capecitabine Industry Revenue (Million) Forecast, by Application 2019 & 2032
- Table 102: India Capecitabine Industry Volume (K Unit) Forecast, by Application 2019 & 2032
- Table 103: Australia Capecitabine Industry Revenue (Million) Forecast, by Application 2019 & 2032
- Table 104: Australia Capecitabine Industry Volume (K Unit) Forecast, by Application 2019 & 2032
- Table 105: South Korea Capecitabine Industry Revenue (Million) Forecast, by Application 2019 & 2032
- Table 106: South Korea Capecitabine Industry Volume (K Unit) Forecast, by Application 2019 & 2032
- Table 107: Rest of Asia Pacific Capecitabine Industry Revenue (Million) Forecast, by Application 2019 & 2032
- Table 108: Rest of Asia Pacific Capecitabine Industry Volume (K Unit) Forecast, by Application 2019 & 2032
- Table 109: Global Capecitabine Industry Revenue Million Forecast, by Indication 2019 & 2032
- Table 110: Global Capecitabine Industry Volume K Unit Forecast, by Indication 2019 & 2032
- Table 111: Global Capecitabine Industry Revenue Million Forecast, by Distribution Channel 2019 & 2032
- Table 112: Global Capecitabine Industry Volume K Unit Forecast, by Distribution Channel 2019 & 2032
- Table 113: Global Capecitabine Industry Revenue Million Forecast, by Country 2019 & 2032
- Table 114: Global Capecitabine Industry Volume K Unit Forecast, by Country 2019 & 2032
- Table 115: GCC Capecitabine Industry Revenue (Million) Forecast, by Application 2019 & 2032
- Table 116: GCC Capecitabine Industry Volume (K Unit) Forecast, by Application 2019 & 2032
- Table 117: South Africa Capecitabine Industry Revenue (Million) Forecast, by Application 2019 & 2032
- Table 118: South Africa Capecitabine Industry Volume (K Unit) Forecast, by Application 2019 & 2032
- Table 119: Rest of Middle East and Africa Capecitabine Industry Revenue (Million) Forecast, by Application 2019 & 2032
- Table 120: Rest of Middle East and Africa Capecitabine Industry Volume (K Unit) Forecast, by Application 2019 & 2032
- Table 121: Global Capecitabine Industry Revenue Million Forecast, by Indication 2019 & 2032
- Table 122: Global Capecitabine Industry Volume K Unit Forecast, by Indication 2019 & 2032
- Table 123: Global Capecitabine Industry Revenue Million Forecast, by Distribution Channel 2019 & 2032
- Table 124: Global Capecitabine Industry Volume K Unit Forecast, by Distribution Channel 2019 & 2032
- Table 125: Global Capecitabine Industry Revenue Million Forecast, by Country 2019 & 2032
- Table 126: Global Capecitabine Industry Volume K Unit Forecast, by Country 2019 & 2032
- Table 127: Brazil Capecitabine Industry Revenue (Million) Forecast, by Application 2019 & 2032
- Table 128: Brazil Capecitabine Industry Volume (K Unit) Forecast, by Application 2019 & 2032
- Table 129: Argentina Capecitabine Industry Revenue (Million) Forecast, by Application 2019 & 2032
- Table 130: Argentina Capecitabine Industry Volume (K Unit) Forecast, by Application 2019 & 2032
- Table 131: Rest of South America Capecitabine Industry Revenue (Million) Forecast, by Application 2019 & 2032
- Table 132: Rest of South America Capecitabine Industry Volume (K Unit) Forecast, by Application 2019 & 2032
Frequently Asked Questions
1. What is the projected Compound Annual Growth Rate (CAGR) of the Capecitabine Industry?
The projected CAGR is approximately 5.50%.
2. Which companies are prominent players in the Capecitabine Industry?
Key companies in the market include F Hoffmann-La Roche AG (Genentech Inc ), Teva Pharmaceuticals Inc, Cipla Inc, Hikma Pharmaceuticals PLC, Intas Pharmaceuticals Limited, Fresenius SE & Co KGaA, Armas Pharmaceuticals Inc, Sun Pharmaceutical Industries Limited, Dr Reddy's Laboratories Ltd, Mylan N V.
3. What are the main segments of the Capecitabine Industry?
The market segments include Indication, Distribution Channel.
4. Can you provide details about the market size?
The market size is estimated to be USD XX Million as of 2022.
5. What are some drivers contributing to market growth?
; Rising Government Initiatives to Control Growing Global Cancer Burden; Increasing Incidence of Cancers Around the World.
6. What are the notable trends driving market growth?
Breast Cancer by Indication is Expected to Hold the Largest Market Share in the Global Capecitabine Market.
7. Are there any restraints impacting market growth?
; Highly Expensive Products and Treatment; Rising Adoption of Substitutes like Raltitrexed. Irinotecan and Leucovorin for Adjuvant Therapy.
8. Can you provide examples of recent developments in the market?
N/A
9. What pricing options are available for accessing the report?
Pricing options include single-user, multi-user, and enterprise licenses priced at USD 4750, USD 5250, and USD 8750 respectively.
10. Is the market size provided in terms of value or volume?
The market size is provided in terms of value, measured in Million and volume, measured in K Unit.
11. Are there any specific market keywords associated with the report?
Yes, the market keyword associated with the report is "Capecitabine Industry," which aids in identifying and referencing the specific market segment covered.
12. How do I determine which pricing option suits my needs best?
The pricing options vary based on user requirements and access needs. Individual users may opt for single-user licenses, while businesses requiring broader access may choose multi-user or enterprise licenses for cost-effective access to the report.
13. Are there any additional resources or data provided in the Capecitabine Industry report?
While the report offers comprehensive insights, it's advisable to review the specific contents or supplementary materials provided to ascertain if additional resources or data are available.
14. How can I stay updated on further developments or reports in the Capecitabine Industry?
To stay informed about further developments, trends, and reports in the Capecitabine Industry, consider subscribing to industry newsletters, following relevant companies and organizations, or regularly checking reputable industry news sources and publications.
Methodology
Step 1 - Identification of Relevant Samples Size from Population Database


Step 2 - Approaches for Defining Global Market Size (Value, Volume* & Price*)

Note*: In applicable scenarios
Step 3 - Data Sources
Primary Research
- Web Analytics
- Survey Reports
- Research Institute
- Latest Research Reports
- Opinion Leaders
Secondary Research
- Annual Reports
- White Paper
- Latest Press Release
- Industry Association
- Paid Database
- Investor Presentations

Step 4 - Data Triangulation
Involves using different sources of information in order to increase the validity of a study
These sources are likely to be stakeholders in a program - participants, other researchers, program staff, other community members, and so on.
Then we put all data in single framework & apply various statistical tools to find out the dynamic on the market.
During the analysis stage, feedback from the stakeholder groups would be compared to determine areas of agreement as well as areas of divergence


