
Key Insights
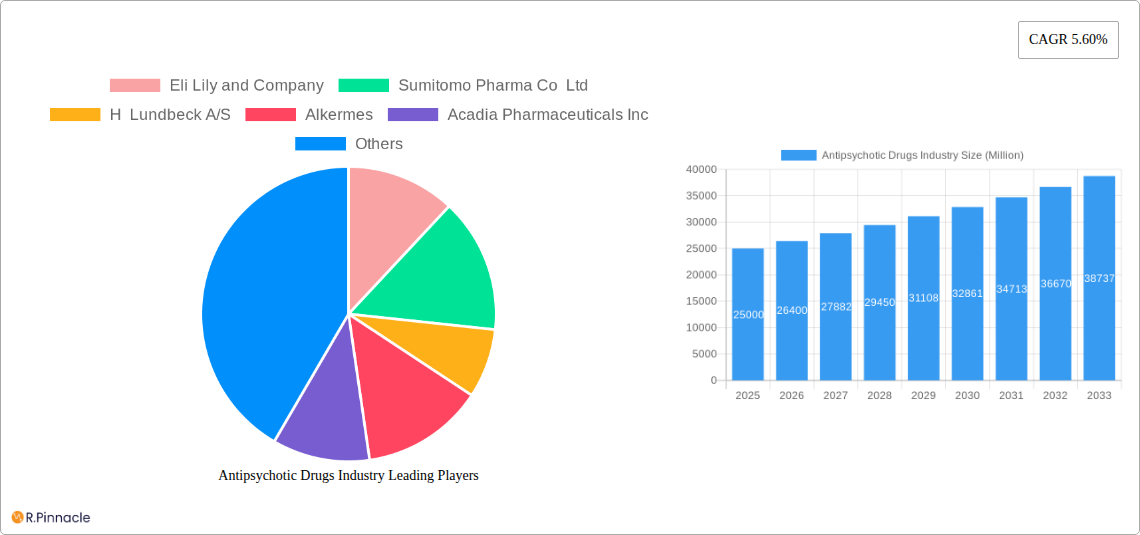
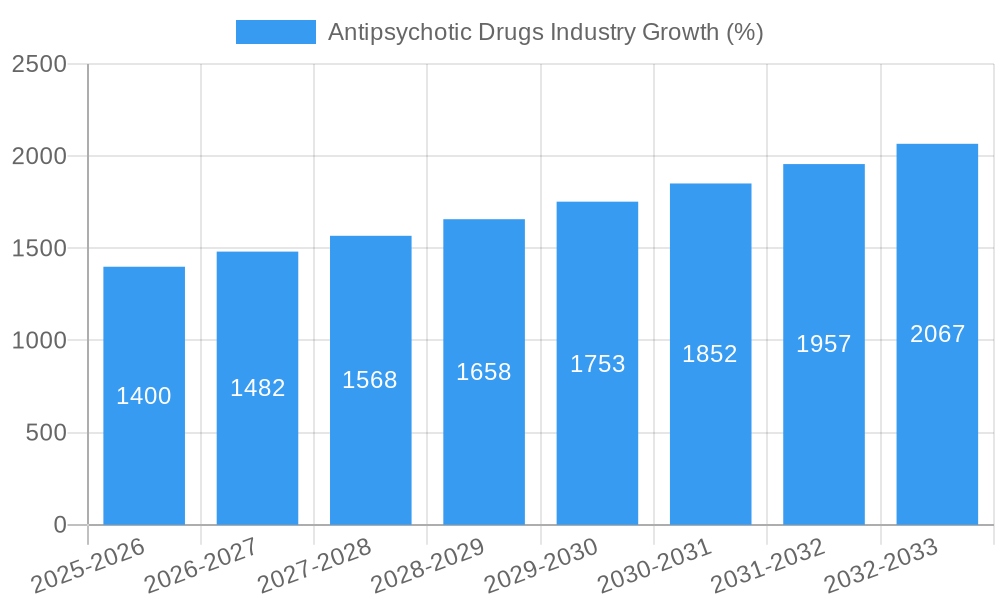
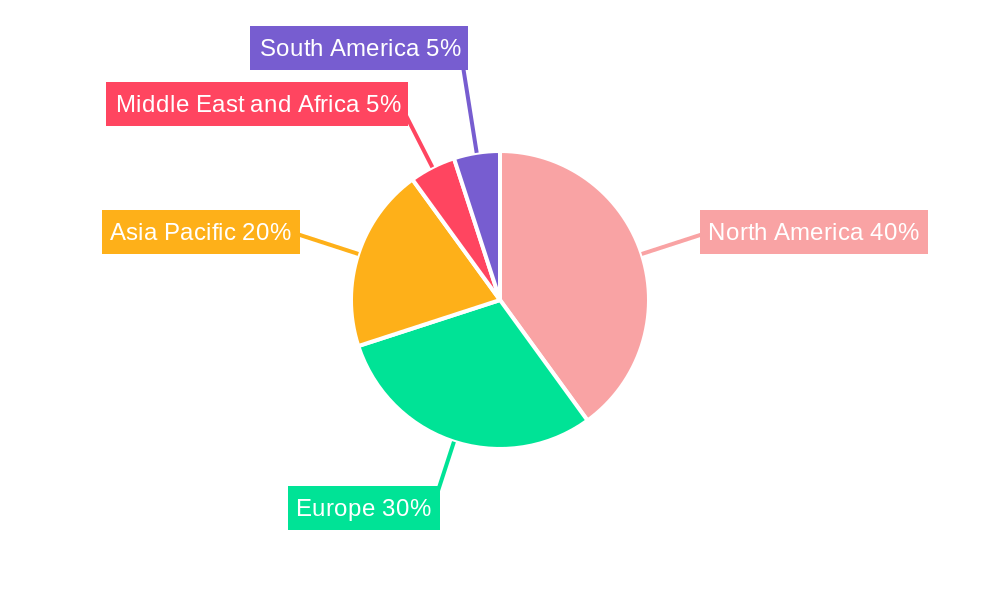
The global antipsychotic drugs market, valued at approximately $25 billion in 2025, is projected to experience robust growth, exhibiting a compound annual growth rate (CAGR) of 5.60% from 2025 to 2033. This expansion is fueled by several key factors. The rising prevalence of mental health disorders like schizophrenia, bipolar disorder, and dementia, coupled with an increasing geriatric population susceptible to these conditions, significantly boosts market demand. Furthermore, advancements in drug development, leading to the introduction of novel atypical antipsychotics with improved efficacy and reduced side effects, contribute to market growth. The growing awareness and destigmatization of mental illness, leading to increased diagnosis and treatment, also play a pivotal role. However, market growth faces challenges, including the high cost of treatment, potential side effects associated with certain drugs, and the ongoing need for more effective therapies to address treatment-resistant cases. The market is segmented by application (schizophrenia, bipolar disorder, unipolar disorder, dementia, and others) and drug classification (first-generation and second-generation antipsychotics). Geographically, North America and Europe currently hold significant market share, but the Asia-Pacific region is expected to witness substantial growth due to increasing healthcare expenditure and rising mental health awareness.
The competitive landscape is characterized by the presence of major pharmaceutical companies such as Eli Lilly and Company, Sumitomo Pharma Co Ltd, H Lundbeck A/S, and others actively involved in research and development, as well as marketing and distribution of antipsychotic drugs. These companies are engaged in strategic initiatives like mergers and acquisitions, collaborations, and the introduction of innovative products to enhance their market position. Future market growth will depend on successful clinical trials for new drugs, addressing unmet medical needs, and the development of personalized medicine approaches tailored to specific patient needs. Regulatory approvals and pricing policies will also play a significant role in shaping market dynamics over the forecast period. The continued focus on improving patient access to treatment and managing side effects effectively will be crucial for sustained growth in this essential segment of the pharmaceutical industry.
This comprehensive report provides a detailed analysis of the global antipsychotic drugs market, offering invaluable insights for industry professionals, investors, and researchers. Covering the period from 2019 to 2033, with a focus on 2025, this report unveils the market's structure, dynamics, and future outlook. The report leverages extensive data analysis to provide actionable intelligence, enabling informed strategic decision-making. The market size is projected to reach xx Million by 2033.
Antipsychotic Drugs Industry Market Structure & Innovation Trends
The global antipsychotic drugs market exhibits a moderately concentrated structure, with key players such as Eli Lilly and Company, Johnson & Johnson, and Pfizer Inc. holding significant market share. Market share distribution varies across different drug classifications and applications. The market is driven by continuous innovation in drug development, focusing on improved efficacy, reduced side effects, and novel drug delivery mechanisms. Regulatory frameworks, such as FDA approvals, play a crucial role in shaping market dynamics. The presence of substitute therapies and the evolving demographics of patients with mental illnesses impact market growth. Significant M&A activities have reshaped the competitive landscape, with deal values exceeding xx Million in recent years.
- Market Concentration: Moderately concentrated, with top players holding xx% market share.
- Innovation Drivers: Improved efficacy, reduced side effects, novel drug delivery.
- Regulatory Framework: FDA approvals, patent expirations, and evolving guidelines significantly influence market access.
- Product Substitutes: Alternative therapies and advancements in other treatment modalities impact market share.
- End-User Demographics: Growing prevalence of mental health disorders fuels market growth. Age and geographic factors influence treatment patterns.
- M&A Activities: Significant consolidation, with deal values exceeding xx Million annually in recent years.
Antipsychotic Drugs Industry Market Dynamics & Trends
The antipsychotic drugs market is experiencing steady growth, driven primarily by the increasing prevalence of schizophrenia, bipolar disorder, and other mental illnesses globally. Technological advancements, such as the development of novel drug delivery systems and personalized medicine approaches, are transforming the market. Patient preferences for improved efficacy and reduced side effects shape demand. Intense competition among established players and emerging companies fuels innovation and drives market expansion. The market is expected to exhibit a CAGR of xx% during the forecast period (2025-2033), with a market penetration rate of xx% in key regions by 2033. Market expansion is influenced by factors like increased awareness of mental health issues, improved healthcare infrastructure, and expanding access to treatment.
Dominant Regions & Segments in Antipsychotic Drugs Industry
The North American region currently dominates the antipsychotic drugs market, driven by higher healthcare expenditure, a robust pharmaceutical industry, and a high prevalence of mental health disorders. Within applications, Schizophrenia represents the largest segment, followed by Bipolar Disorder. Second-Generation (Atypical) antipsychotics hold a larger market share compared to First-Generation (Typical) drugs, due to their improved side effect profiles.
- Leading Region: North America
- Key Application Segments:
- Schizophrenia: Driven by high prevalence and ongoing research.
- Bipolar Disorder: Significant unmet medical needs drive segment growth.
- Unipolar Disorder: Growing awareness of treatment options contributes to market expansion.
- Dementia: Emerging treatment options and growing geriatric population fuel market expansion.
- Others: Niches like autism spectrum disorder show significant growth potential.
- Key Drug Classification Segments:
- Second-Generation (Atypical): Dominates due to improved safety profiles and efficacy.
- First-Generation (Typical): Use is decreasing due to significant side effects.
- Key Drivers (North America):
- High healthcare expenditure
- Robust pharmaceutical R&D
- High prevalence of mental health conditions
- Favorable regulatory environment
Antipsychotic Drugs Industry Product Innovations
Recent innovations include the development of long-acting injectable formulations to enhance treatment adherence, and personalized medicine approaches tailored to specific patient genotypes and phenotypes. These advancements improve efficacy, reduce side effects, and enhance overall treatment outcomes. The market is witnessing a surge in innovative drug delivery mechanisms and formulations that aim to improve patient compliance and reduce the frequency of administration. These trends positively impact market penetration and foster a competitive landscape focused on delivering better patient experiences.
Report Scope & Segmentation Analysis
This report provides a comprehensive segmentation analysis of the antipsychotic drugs market based on Application (Schizophrenia, Bipolar Disorder, Unipolar Disorder, Dementia, Others) and Drug Classification (First Generation (Typical), Second Generation (Atypical)). Each segment includes detailed analysis of growth projections, market sizes, and competitive dynamics. Market sizes are provided for each segment across the historical period (2019-2024), base year (2025), and forecast period (2025-2033). Competitive landscapes detailing key players, market share, and strategic moves are also included for each segment.
Key Drivers of Antipsychotic Drugs Industry Growth
The key drivers for the growth of this industry include the rising prevalence of mental illnesses globally, particularly schizophrenia and bipolar disorder. Increased awareness of these conditions, improved diagnostic tools, and greater access to healthcare facilities have led to increased demand for antipsychotic medications. Technological advancements, such as the development of more effective and safer drugs, also contribute significantly to market growth. Moreover, supportive government policies and initiatives aimed at improving mental healthcare infrastructure play a crucial role in driving market expansion.
Challenges in the Antipsychotic Drugs Industry Sector
The antipsychotic drugs industry faces several challenges, including the high cost of drug development and stringent regulatory requirements. Patent expirations for leading drugs can lead to increased competition from generic versions, impacting the revenue streams of innovator companies. Furthermore, concerns over side effects and potential long-term health risks associated with some antipsychotic medications pose a significant challenge, impacting patient compliance and overall market growth. Supply chain disruptions can also lead to shortages and price fluctuations.
Emerging Opportunities in Antipsychotic Drugs Industry
Emerging opportunities include the development of novel therapies targeting specific subtypes of mental illnesses. Advancements in personalized medicine, focusing on tailoring treatments to individual patient characteristics, hold immense potential. Expanding into emerging markets with unmet medical needs presents significant growth opportunities. The increasing focus on patient-centric care models, digital health technologies, and improved access to mental healthcare services offer avenues for market expansion and innovation.
Leading Players in the Antipsychotic Drugs Industry Market
- Eli Lilly and Company
- Sumitomo Pharma Co Ltd
- H Lundbeck A/S
- Alkermes
- Acadia Pharmaceuticals Inc
- GlaxoSmithKline plc
- Intra-Cellular Therapies Inc
- Teva Pharmaceutical Industries Ltd
- AstraZeneca plc
- AbbVie Inc
- Johnson & Johnson
- Otsuka Pharmaceutical Co Ltd
- Pfizer Inc
Key Developments in Antipsychotic Drugs Industry
- January 2023: Luye Pharma Group received FDA approval for Rykindo to treat Schizophrenia and bipolar 1 disorder.
- February 2022: Alkermes plc released positive Phase 3b study results for LYBALVI in schizophrenia.
- January 2022: Otsuka Pharmaceutical Co., Ltd., Otsuka American Pharmaceutical, Inc., and Lundbeck, Inc. received FDA approval for REXULTI for Schizophrenia in 13 to 17-year-old patients.
Future Outlook for Antipsychotic Drugs Industry Market
The future outlook for the antipsychotic drugs market is positive, driven by sustained growth in the prevalence of mental illnesses, ongoing research and development efforts, and the introduction of novel therapies. The focus on personalized medicine and innovative drug delivery systems will play a crucial role in shaping market growth. Strategic partnerships, mergers, and acquisitions will continue to reshape the competitive landscape. Expansion into emerging markets and the development of next-generation antipsychotics with improved safety and efficacy profiles will drive market expansion in the coming years.
Antipsychotic Drugs Industry Segmentation
-
1. Application
- 1.1. Schizophrenia
- 1.2. Bipolar Disorder
- 1.3. Unipolar Disorder
- 1.4. Dementia
- 1.5. Others
-
2. Drug Classification
- 2.1. First Generation (Typical)
- 2.2. Second Generation (Atypical)
Antipsychotic Drugs Industry Segmentation By Geography
-
1. North America
- 1.1. United States
- 1.2. Canada
- 1.3. Mexico
-
2. Europe
- 2.1. Germany
- 2.2. United Kingdom
- 2.3. France
- 2.4. Italy
- 2.5. Spain
- 2.6. Rest of Europe
-
3. Asia Pacific
- 3.1. China
- 3.2. Japan
- 3.3. India
- 3.4. Australia
- 3.5. South Korea
- 3.6. Rest of Asia Pacific
-
4. Middle East and Africa
- 4.1. GCC
- 4.2. South Africa
- 4.3. Rest of Middle East and Africa
-
5. South America
- 5.1. Brazil
- 5.2. Argentina
- 5.3. Rest of South America
Antipsychotic Drugs Industry REPORT HIGHLIGHTS
| Aspects | Details |
|---|---|
| Study Period | 2019-2033 |
| Base Year | 2024 |
| Estimated Year | 2025 |
| Forecast Period | 2025-2033 |
| Historical Period | 2019-2024 |
| Growth Rate | CAGR of 5.60% from 2019-2033 |
| Segmentation |
|
Table of Contents
- 1. Introduction
- 1.1. Research Scope
- 1.2. Market Segmentation
- 1.3. Research Methodology
- 1.4. Definitions and Assumptions
- 2. Executive Summary
- 2.1. Introduction
- 3. Market Dynamics
- 3.1. Introduction
- 3.2. Market Drivers
- 3.2.1. Rising Prevalence of Mental Disorders; Increasing Focus of Governments and Health Care Organizations on Mental Health; Constant Investment in Research and Development
- 3.3. Market Restrains
- 3.3.1. Addiction Caused Due to the Antipsychotic Drugs; Patent Expiry of Major Drugs
- 3.4. Market Trends
- 3.4.1. Schizophrenia is Expected to Hold Major Share in the Market over the Forecast Period
- 4. Market Factor Analysis
- 4.1. Porters Five Forces
- 4.2. Supply/Value Chain
- 4.3. PESTEL analysis
- 4.4. Market Entropy
- 4.5. Patent/Trademark Analysis
- 5. Global Antipsychotic Drugs Industry Analysis, Insights and Forecast, 2019-2031
- 5.1. Market Analysis, Insights and Forecast - by Application
- 5.1.1. Schizophrenia
- 5.1.2. Bipolar Disorder
- 5.1.3. Unipolar Disorder
- 5.1.4. Dementia
- 5.1.5. Others
- 5.2. Market Analysis, Insights and Forecast - by Drug Classification
- 5.2.1. First Generation (Typical)
- 5.2.2. Second Generation (Atypical)
- 5.3. Market Analysis, Insights and Forecast - by Region
- 5.3.1. North America
- 5.3.2. Europe
- 5.3.3. Asia Pacific
- 5.3.4. Middle East and Africa
- 5.3.5. South America
- 5.1. Market Analysis, Insights and Forecast - by Application
- 6. North America Antipsychotic Drugs Industry Analysis, Insights and Forecast, 2019-2031
- 6.1. Market Analysis, Insights and Forecast - by Application
- 6.1.1. Schizophrenia
- 6.1.2. Bipolar Disorder
- 6.1.3. Unipolar Disorder
- 6.1.4. Dementia
- 6.1.5. Others
- 6.2. Market Analysis, Insights and Forecast - by Drug Classification
- 6.2.1. First Generation (Typical)
- 6.2.2. Second Generation (Atypical)
- 6.1. Market Analysis, Insights and Forecast - by Application
- 7. Europe Antipsychotic Drugs Industry Analysis, Insights and Forecast, 2019-2031
- 7.1. Market Analysis, Insights and Forecast - by Application
- 7.1.1. Schizophrenia
- 7.1.2. Bipolar Disorder
- 7.1.3. Unipolar Disorder
- 7.1.4. Dementia
- 7.1.5. Others
- 7.2. Market Analysis, Insights and Forecast - by Drug Classification
- 7.2.1. First Generation (Typical)
- 7.2.2. Second Generation (Atypical)
- 7.1. Market Analysis, Insights and Forecast - by Application
- 8. Asia Pacific Antipsychotic Drugs Industry Analysis, Insights and Forecast, 2019-2031
- 8.1. Market Analysis, Insights and Forecast - by Application
- 8.1.1. Schizophrenia
- 8.1.2. Bipolar Disorder
- 8.1.3. Unipolar Disorder
- 8.1.4. Dementia
- 8.1.5. Others
- 8.2. Market Analysis, Insights and Forecast - by Drug Classification
- 8.2.1. First Generation (Typical)
- 8.2.2. Second Generation (Atypical)
- 8.1. Market Analysis, Insights and Forecast - by Application
- 9. Middle East and Africa Antipsychotic Drugs Industry Analysis, Insights and Forecast, 2019-2031
- 9.1. Market Analysis, Insights and Forecast - by Application
- 9.1.1. Schizophrenia
- 9.1.2. Bipolar Disorder
- 9.1.3. Unipolar Disorder
- 9.1.4. Dementia
- 9.1.5. Others
- 9.2. Market Analysis, Insights and Forecast - by Drug Classification
- 9.2.1. First Generation (Typical)
- 9.2.2. Second Generation (Atypical)
- 9.1. Market Analysis, Insights and Forecast - by Application
- 10. South America Antipsychotic Drugs Industry Analysis, Insights and Forecast, 2019-2031
- 10.1. Market Analysis, Insights and Forecast - by Application
- 10.1.1. Schizophrenia
- 10.1.2. Bipolar Disorder
- 10.1.3. Unipolar Disorder
- 10.1.4. Dementia
- 10.1.5. Others
- 10.2. Market Analysis, Insights and Forecast - by Drug Classification
- 10.2.1. First Generation (Typical)
- 10.2.2. Second Generation (Atypical)
- 10.1. Market Analysis, Insights and Forecast - by Application
- 11. North America Antipsychotic Drugs Industry Analysis, Insights and Forecast, 2019-2031
- 11.1. Market Analysis, Insights and Forecast - By Country/Sub-region
- 11.1.1. undefined
- 12. Europe Antipsychotic Drugs Industry Analysis, Insights and Forecast, 2019-2031
- 12.1. Market Analysis, Insights and Forecast - By Country/Sub-region
- 12.1.1. undefined
- 13. Asia Pacific Antipsychotic Drugs Industry Analysis, Insights and Forecast, 2019-2031
- 13.1. Market Analysis, Insights and Forecast - By Country/Sub-region
- 13.1.1. undefined
- 14. Middle East and Africa Antipsychotic Drugs Industry Analysis, Insights and Forecast, 2019-2031
- 14.1. Market Analysis, Insights and Forecast - By Country/Sub-region
- 14.1.1. undefined
- 15. South America Antipsychotic Drugs Industry Analysis, Insights and Forecast, 2019-2031
- 15.1. Market Analysis, Insights and Forecast - By Country/Sub-region
- 15.1.1. undefined
- 16. Competitive Analysis
- 16.1. Global Market Share Analysis 2024
- 16.2. Company Profiles
- 16.2.1 Eli Lily and Company
- 16.2.1.1. Overview
- 16.2.1.2. Products
- 16.2.1.3. SWOT Analysis
- 16.2.1.4. Recent Developments
- 16.2.1.5. Financials (Based on Availability)
- 16.2.2 Sumitomo Pharma Co Ltd
- 16.2.2.1. Overview
- 16.2.2.2. Products
- 16.2.2.3. SWOT Analysis
- 16.2.2.4. Recent Developments
- 16.2.2.5. Financials (Based on Availability)
- 16.2.3 H Lundbeck A/S
- 16.2.3.1. Overview
- 16.2.3.2. Products
- 16.2.3.3. SWOT Analysis
- 16.2.3.4. Recent Developments
- 16.2.3.5. Financials (Based on Availability)
- 16.2.4 Alkermes
- 16.2.4.1. Overview
- 16.2.4.2. Products
- 16.2.4.3. SWOT Analysis
- 16.2.4.4. Recent Developments
- 16.2.4.5. Financials (Based on Availability)
- 16.2.5 Acadia Pharmaceuticals Inc
- 16.2.5.1. Overview
- 16.2.5.2. Products
- 16.2.5.3. SWOT Analysis
- 16.2.5.4. Recent Developments
- 16.2.5.5. Financials (Based on Availability)
- 16.2.6 GlaxoSmithKline plc
- 16.2.6.1. Overview
- 16.2.6.2. Products
- 16.2.6.3. SWOT Analysis
- 16.2.6.4. Recent Developments
- 16.2.6.5. Financials (Based on Availability)
- 16.2.7 Intra-Cellular Therapies Inc
- 16.2.7.1. Overview
- 16.2.7.2. Products
- 16.2.7.3. SWOT Analysis
- 16.2.7.4. Recent Developments
- 16.2.7.5. Financials (Based on Availability)
- 16.2.8 Teva Pharmaceutical Industries Ltd
- 16.2.8.1. Overview
- 16.2.8.2. Products
- 16.2.8.3. SWOT Analysis
- 16.2.8.4. Recent Developments
- 16.2.8.5. Financials (Based on Availability)
- 16.2.9 AstraZeneca plc
- 16.2.9.1. Overview
- 16.2.9.2. Products
- 16.2.9.3. SWOT Analysis
- 16.2.9.4. Recent Developments
- 16.2.9.5. Financials (Based on Availability)
- 16.2.10 AbbVie Inc
- 16.2.10.1. Overview
- 16.2.10.2. Products
- 16.2.10.3. SWOT Analysis
- 16.2.10.4. Recent Developments
- 16.2.10.5. Financials (Based on Availability)
- 16.2.11 Johnson & Johnson
- 16.2.11.1. Overview
- 16.2.11.2. Products
- 16.2.11.3. SWOT Analysis
- 16.2.11.4. Recent Developments
- 16.2.11.5. Financials (Based on Availability)
- 16.2.12 Otsuka Pharmaceutical Co Ltd
- 16.2.12.1. Overview
- 16.2.12.2. Products
- 16.2.12.3. SWOT Analysis
- 16.2.12.4. Recent Developments
- 16.2.12.5. Financials (Based on Availability)
- 16.2.13 Pfizer Inc
- 16.2.13.1. Overview
- 16.2.13.2. Products
- 16.2.13.3. SWOT Analysis
- 16.2.13.4. Recent Developments
- 16.2.13.5. Financials (Based on Availability)
- 16.2.1 Eli Lily and Company
List of Figures
- Figure 1: Global Antipsychotic Drugs Industry Revenue Breakdown (Million, %) by Region 2024 & 2032
- Figure 2: Global Antipsychotic Drugs Industry Volume Breakdown (Dosage, %) by Region 2024 & 2032
- Figure 3: North America Antipsychotic Drugs Industry Revenue (Million), by Country 2024 & 2032
- Figure 4: North America Antipsychotic Drugs Industry Volume (Dosage), by Country 2024 & 2032
- Figure 5: North America Antipsychotic Drugs Industry Revenue Share (%), by Country 2024 & 2032
- Figure 6: North America Antipsychotic Drugs Industry Volume Share (%), by Country 2024 & 2032
- Figure 7: Europe Antipsychotic Drugs Industry Revenue (Million), by Country 2024 & 2032
- Figure 8: Europe Antipsychotic Drugs Industry Volume (Dosage), by Country 2024 & 2032
- Figure 9: Europe Antipsychotic Drugs Industry Revenue Share (%), by Country 2024 & 2032
- Figure 10: Europe Antipsychotic Drugs Industry Volume Share (%), by Country 2024 & 2032
- Figure 11: Asia Pacific Antipsychotic Drugs Industry Revenue (Million), by Country 2024 & 2032
- Figure 12: Asia Pacific Antipsychotic Drugs Industry Volume (Dosage), by Country 2024 & 2032
- Figure 13: Asia Pacific Antipsychotic Drugs Industry Revenue Share (%), by Country 2024 & 2032
- Figure 14: Asia Pacific Antipsychotic Drugs Industry Volume Share (%), by Country 2024 & 2032
- Figure 15: Middle East and Africa Antipsychotic Drugs Industry Revenue (Million), by Country 2024 & 2032
- Figure 16: Middle East and Africa Antipsychotic Drugs Industry Volume (Dosage), by Country 2024 & 2032
- Figure 17: Middle East and Africa Antipsychotic Drugs Industry Revenue Share (%), by Country 2024 & 2032
- Figure 18: Middle East and Africa Antipsychotic Drugs Industry Volume Share (%), by Country 2024 & 2032
- Figure 19: South America Antipsychotic Drugs Industry Revenue (Million), by Country 2024 & 2032
- Figure 20: South America Antipsychotic Drugs Industry Volume (Dosage), by Country 2024 & 2032
- Figure 21: South America Antipsychotic Drugs Industry Revenue Share (%), by Country 2024 & 2032
- Figure 22: South America Antipsychotic Drugs Industry Volume Share (%), by Country 2024 & 2032
- Figure 23: North America Antipsychotic Drugs Industry Revenue (Million), by Application 2024 & 2032
- Figure 24: North America Antipsychotic Drugs Industry Volume (Dosage), by Application 2024 & 2032
- Figure 25: North America Antipsychotic Drugs Industry Revenue Share (%), by Application 2024 & 2032
- Figure 26: North America Antipsychotic Drugs Industry Volume Share (%), by Application 2024 & 2032
- Figure 27: North America Antipsychotic Drugs Industry Revenue (Million), by Drug Classification 2024 & 2032
- Figure 28: North America Antipsychotic Drugs Industry Volume (Dosage), by Drug Classification 2024 & 2032
- Figure 29: North America Antipsychotic Drugs Industry Revenue Share (%), by Drug Classification 2024 & 2032
- Figure 30: North America Antipsychotic Drugs Industry Volume Share (%), by Drug Classification 2024 & 2032
- Figure 31: North America Antipsychotic Drugs Industry Revenue (Million), by Country 2024 & 2032
- Figure 32: North America Antipsychotic Drugs Industry Volume (Dosage), by Country 2024 & 2032
- Figure 33: North America Antipsychotic Drugs Industry Revenue Share (%), by Country 2024 & 2032
- Figure 34: North America Antipsychotic Drugs Industry Volume Share (%), by Country 2024 & 2032
- Figure 35: Europe Antipsychotic Drugs Industry Revenue (Million), by Application 2024 & 2032
- Figure 36: Europe Antipsychotic Drugs Industry Volume (Dosage), by Application 2024 & 2032
- Figure 37: Europe Antipsychotic Drugs Industry Revenue Share (%), by Application 2024 & 2032
- Figure 38: Europe Antipsychotic Drugs Industry Volume Share (%), by Application 2024 & 2032
- Figure 39: Europe Antipsychotic Drugs Industry Revenue (Million), by Drug Classification 2024 & 2032
- Figure 40: Europe Antipsychotic Drugs Industry Volume (Dosage), by Drug Classification 2024 & 2032
- Figure 41: Europe Antipsychotic Drugs Industry Revenue Share (%), by Drug Classification 2024 & 2032
- Figure 42: Europe Antipsychotic Drugs Industry Volume Share (%), by Drug Classification 2024 & 2032
- Figure 43: Europe Antipsychotic Drugs Industry Revenue (Million), by Country 2024 & 2032
- Figure 44: Europe Antipsychotic Drugs Industry Volume (Dosage), by Country 2024 & 2032
- Figure 45: Europe Antipsychotic Drugs Industry Revenue Share (%), by Country 2024 & 2032
- Figure 46: Europe Antipsychotic Drugs Industry Volume Share (%), by Country 2024 & 2032
- Figure 47: Asia Pacific Antipsychotic Drugs Industry Revenue (Million), by Application 2024 & 2032
- Figure 48: Asia Pacific Antipsychotic Drugs Industry Volume (Dosage), by Application 2024 & 2032
- Figure 49: Asia Pacific Antipsychotic Drugs Industry Revenue Share (%), by Application 2024 & 2032
- Figure 50: Asia Pacific Antipsychotic Drugs Industry Volume Share (%), by Application 2024 & 2032
- Figure 51: Asia Pacific Antipsychotic Drugs Industry Revenue (Million), by Drug Classification 2024 & 2032
- Figure 52: Asia Pacific Antipsychotic Drugs Industry Volume (Dosage), by Drug Classification 2024 & 2032
- Figure 53: Asia Pacific Antipsychotic Drugs Industry Revenue Share (%), by Drug Classification 2024 & 2032
- Figure 54: Asia Pacific Antipsychotic Drugs Industry Volume Share (%), by Drug Classification 2024 & 2032
- Figure 55: Asia Pacific Antipsychotic Drugs Industry Revenue (Million), by Country 2024 & 2032
- Figure 56: Asia Pacific Antipsychotic Drugs Industry Volume (Dosage), by Country 2024 & 2032
- Figure 57: Asia Pacific Antipsychotic Drugs Industry Revenue Share (%), by Country 2024 & 2032
- Figure 58: Asia Pacific Antipsychotic Drugs Industry Volume Share (%), by Country 2024 & 2032
- Figure 59: Middle East and Africa Antipsychotic Drugs Industry Revenue (Million), by Application 2024 & 2032
- Figure 60: Middle East and Africa Antipsychotic Drugs Industry Volume (Dosage), by Application 2024 & 2032
- Figure 61: Middle East and Africa Antipsychotic Drugs Industry Revenue Share (%), by Application 2024 & 2032
- Figure 62: Middle East and Africa Antipsychotic Drugs Industry Volume Share (%), by Application 2024 & 2032
- Figure 63: Middle East and Africa Antipsychotic Drugs Industry Revenue (Million), by Drug Classification 2024 & 2032
- Figure 64: Middle East and Africa Antipsychotic Drugs Industry Volume (Dosage), by Drug Classification 2024 & 2032
- Figure 65: Middle East and Africa Antipsychotic Drugs Industry Revenue Share (%), by Drug Classification 2024 & 2032
- Figure 66: Middle East and Africa Antipsychotic Drugs Industry Volume Share (%), by Drug Classification 2024 & 2032
- Figure 67: Middle East and Africa Antipsychotic Drugs Industry Revenue (Million), by Country 2024 & 2032
- Figure 68: Middle East and Africa Antipsychotic Drugs Industry Volume (Dosage), by Country 2024 & 2032
- Figure 69: Middle East and Africa Antipsychotic Drugs Industry Revenue Share (%), by Country 2024 & 2032
- Figure 70: Middle East and Africa Antipsychotic Drugs Industry Volume Share (%), by Country 2024 & 2032
- Figure 71: South America Antipsychotic Drugs Industry Revenue (Million), by Application 2024 & 2032
- Figure 72: South America Antipsychotic Drugs Industry Volume (Dosage), by Application 2024 & 2032
- Figure 73: South America Antipsychotic Drugs Industry Revenue Share (%), by Application 2024 & 2032
- Figure 74: South America Antipsychotic Drugs Industry Volume Share (%), by Application 2024 & 2032
- Figure 75: South America Antipsychotic Drugs Industry Revenue (Million), by Drug Classification 2024 & 2032
- Figure 76: South America Antipsychotic Drugs Industry Volume (Dosage), by Drug Classification 2024 & 2032
- Figure 77: South America Antipsychotic Drugs Industry Revenue Share (%), by Drug Classification 2024 & 2032
- Figure 78: South America Antipsychotic Drugs Industry Volume Share (%), by Drug Classification 2024 & 2032
- Figure 79: South America Antipsychotic Drugs Industry Revenue (Million), by Country 2024 & 2032
- Figure 80: South America Antipsychotic Drugs Industry Volume (Dosage), by Country 2024 & 2032
- Figure 81: South America Antipsychotic Drugs Industry Revenue Share (%), by Country 2024 & 2032
- Figure 82: South America Antipsychotic Drugs Industry Volume Share (%), by Country 2024 & 2032
List of Tables
- Table 1: Global Antipsychotic Drugs Industry Revenue Million Forecast, by Region 2019 & 2032
- Table 2: Global Antipsychotic Drugs Industry Volume Dosage Forecast, by Region 2019 & 2032
- Table 3: Global Antipsychotic Drugs Industry Revenue Million Forecast, by Application 2019 & 2032
- Table 4: Global Antipsychotic Drugs Industry Volume Dosage Forecast, by Application 2019 & 2032
- Table 5: Global Antipsychotic Drugs Industry Revenue Million Forecast, by Drug Classification 2019 & 2032
- Table 6: Global Antipsychotic Drugs Industry Volume Dosage Forecast, by Drug Classification 2019 & 2032
- Table 7: Global Antipsychotic Drugs Industry Revenue Million Forecast, by Region 2019 & 2032
- Table 8: Global Antipsychotic Drugs Industry Volume Dosage Forecast, by Region 2019 & 2032
- Table 9: Global Antipsychotic Drugs Industry Revenue Million Forecast, by Country 2019 & 2032
- Table 10: Global Antipsychotic Drugs Industry Volume Dosage Forecast, by Country 2019 & 2032
- Table 11: Global Antipsychotic Drugs Industry Revenue Million Forecast, by Country 2019 & 2032
- Table 12: Global Antipsychotic Drugs Industry Volume Dosage Forecast, by Country 2019 & 2032
- Table 13: Global Antipsychotic Drugs Industry Revenue Million Forecast, by Country 2019 & 2032
- Table 14: Global Antipsychotic Drugs Industry Volume Dosage Forecast, by Country 2019 & 2032
- Table 15: Global Antipsychotic Drugs Industry Revenue Million Forecast, by Country 2019 & 2032
- Table 16: Global Antipsychotic Drugs Industry Volume Dosage Forecast, by Country 2019 & 2032
- Table 17: Global Antipsychotic Drugs Industry Revenue Million Forecast, by Country 2019 & 2032
- Table 18: Global Antipsychotic Drugs Industry Volume Dosage Forecast, by Country 2019 & 2032
- Table 19: Global Antipsychotic Drugs Industry Revenue Million Forecast, by Application 2019 & 2032
- Table 20: Global Antipsychotic Drugs Industry Volume Dosage Forecast, by Application 2019 & 2032
- Table 21: Global Antipsychotic Drugs Industry Revenue Million Forecast, by Drug Classification 2019 & 2032
- Table 22: Global Antipsychotic Drugs Industry Volume Dosage Forecast, by Drug Classification 2019 & 2032
- Table 23: Global Antipsychotic Drugs Industry Revenue Million Forecast, by Country 2019 & 2032
- Table 24: Global Antipsychotic Drugs Industry Volume Dosage Forecast, by Country 2019 & 2032
- Table 25: United States Antipsychotic Drugs Industry Revenue (Million) Forecast, by Application 2019 & 2032
- Table 26: United States Antipsychotic Drugs Industry Volume (Dosage) Forecast, by Application 2019 & 2032
- Table 27: Canada Antipsychotic Drugs Industry Revenue (Million) Forecast, by Application 2019 & 2032
- Table 28: Canada Antipsychotic Drugs Industry Volume (Dosage) Forecast, by Application 2019 & 2032
- Table 29: Mexico Antipsychotic Drugs Industry Revenue (Million) Forecast, by Application 2019 & 2032
- Table 30: Mexico Antipsychotic Drugs Industry Volume (Dosage) Forecast, by Application 2019 & 2032
- Table 31: Global Antipsychotic Drugs Industry Revenue Million Forecast, by Application 2019 & 2032
- Table 32: Global Antipsychotic Drugs Industry Volume Dosage Forecast, by Application 2019 & 2032
- Table 33: Global Antipsychotic Drugs Industry Revenue Million Forecast, by Drug Classification 2019 & 2032
- Table 34: Global Antipsychotic Drugs Industry Volume Dosage Forecast, by Drug Classification 2019 & 2032
- Table 35: Global Antipsychotic Drugs Industry Revenue Million Forecast, by Country 2019 & 2032
- Table 36: Global Antipsychotic Drugs Industry Volume Dosage Forecast, by Country 2019 & 2032
- Table 37: Germany Antipsychotic Drugs Industry Revenue (Million) Forecast, by Application 2019 & 2032
- Table 38: Germany Antipsychotic Drugs Industry Volume (Dosage) Forecast, by Application 2019 & 2032
- Table 39: United Kingdom Antipsychotic Drugs Industry Revenue (Million) Forecast, by Application 2019 & 2032
- Table 40: United Kingdom Antipsychotic Drugs Industry Volume (Dosage) Forecast, by Application 2019 & 2032
- Table 41: France Antipsychotic Drugs Industry Revenue (Million) Forecast, by Application 2019 & 2032
- Table 42: France Antipsychotic Drugs Industry Volume (Dosage) Forecast, by Application 2019 & 2032
- Table 43: Italy Antipsychotic Drugs Industry Revenue (Million) Forecast, by Application 2019 & 2032
- Table 44: Italy Antipsychotic Drugs Industry Volume (Dosage) Forecast, by Application 2019 & 2032
- Table 45: Spain Antipsychotic Drugs Industry Revenue (Million) Forecast, by Application 2019 & 2032
- Table 46: Spain Antipsychotic Drugs Industry Volume (Dosage) Forecast, by Application 2019 & 2032
- Table 47: Rest of Europe Antipsychotic Drugs Industry Revenue (Million) Forecast, by Application 2019 & 2032
- Table 48: Rest of Europe Antipsychotic Drugs Industry Volume (Dosage) Forecast, by Application 2019 & 2032
- Table 49: Global Antipsychotic Drugs Industry Revenue Million Forecast, by Application 2019 & 2032
- Table 50: Global Antipsychotic Drugs Industry Volume Dosage Forecast, by Application 2019 & 2032
- Table 51: Global Antipsychotic Drugs Industry Revenue Million Forecast, by Drug Classification 2019 & 2032
- Table 52: Global Antipsychotic Drugs Industry Volume Dosage Forecast, by Drug Classification 2019 & 2032
- Table 53: Global Antipsychotic Drugs Industry Revenue Million Forecast, by Country 2019 & 2032
- Table 54: Global Antipsychotic Drugs Industry Volume Dosage Forecast, by Country 2019 & 2032
- Table 55: China Antipsychotic Drugs Industry Revenue (Million) Forecast, by Application 2019 & 2032
- Table 56: China Antipsychotic Drugs Industry Volume (Dosage) Forecast, by Application 2019 & 2032
- Table 57: Japan Antipsychotic Drugs Industry Revenue (Million) Forecast, by Application 2019 & 2032
- Table 58: Japan Antipsychotic Drugs Industry Volume (Dosage) Forecast, by Application 2019 & 2032
- Table 59: India Antipsychotic Drugs Industry Revenue (Million) Forecast, by Application 2019 & 2032
- Table 60: India Antipsychotic Drugs Industry Volume (Dosage) Forecast, by Application 2019 & 2032
- Table 61: Australia Antipsychotic Drugs Industry Revenue (Million) Forecast, by Application 2019 & 2032
- Table 62: Australia Antipsychotic Drugs Industry Volume (Dosage) Forecast, by Application 2019 & 2032
- Table 63: South Korea Antipsychotic Drugs Industry Revenue (Million) Forecast, by Application 2019 & 2032
- Table 64: South Korea Antipsychotic Drugs Industry Volume (Dosage) Forecast, by Application 2019 & 2032
- Table 65: Rest of Asia Pacific Antipsychotic Drugs Industry Revenue (Million) Forecast, by Application 2019 & 2032
- Table 66: Rest of Asia Pacific Antipsychotic Drugs Industry Volume (Dosage) Forecast, by Application 2019 & 2032
- Table 67: Global Antipsychotic Drugs Industry Revenue Million Forecast, by Application 2019 & 2032
- Table 68: Global Antipsychotic Drugs Industry Volume Dosage Forecast, by Application 2019 & 2032
- Table 69: Global Antipsychotic Drugs Industry Revenue Million Forecast, by Drug Classification 2019 & 2032
- Table 70: Global Antipsychotic Drugs Industry Volume Dosage Forecast, by Drug Classification 2019 & 2032
- Table 71: Global Antipsychotic Drugs Industry Revenue Million Forecast, by Country 2019 & 2032
- Table 72: Global Antipsychotic Drugs Industry Volume Dosage Forecast, by Country 2019 & 2032
- Table 73: GCC Antipsychotic Drugs Industry Revenue (Million) Forecast, by Application 2019 & 2032
- Table 74: GCC Antipsychotic Drugs Industry Volume (Dosage) Forecast, by Application 2019 & 2032
- Table 75: South Africa Antipsychotic Drugs Industry Revenue (Million) Forecast, by Application 2019 & 2032
- Table 76: South Africa Antipsychotic Drugs Industry Volume (Dosage) Forecast, by Application 2019 & 2032
- Table 77: Rest of Middle East and Africa Antipsychotic Drugs Industry Revenue (Million) Forecast, by Application 2019 & 2032
- Table 78: Rest of Middle East and Africa Antipsychotic Drugs Industry Volume (Dosage) Forecast, by Application 2019 & 2032
- Table 79: Global Antipsychotic Drugs Industry Revenue Million Forecast, by Application 2019 & 2032
- Table 80: Global Antipsychotic Drugs Industry Volume Dosage Forecast, by Application 2019 & 2032
- Table 81: Global Antipsychotic Drugs Industry Revenue Million Forecast, by Drug Classification 2019 & 2032
- Table 82: Global Antipsychotic Drugs Industry Volume Dosage Forecast, by Drug Classification 2019 & 2032
- Table 83: Global Antipsychotic Drugs Industry Revenue Million Forecast, by Country 2019 & 2032
- Table 84: Global Antipsychotic Drugs Industry Volume Dosage Forecast, by Country 2019 & 2032
- Table 85: Brazil Antipsychotic Drugs Industry Revenue (Million) Forecast, by Application 2019 & 2032
- Table 86: Brazil Antipsychotic Drugs Industry Volume (Dosage) Forecast, by Application 2019 & 2032
- Table 87: Argentina Antipsychotic Drugs Industry Revenue (Million) Forecast, by Application 2019 & 2032
- Table 88: Argentina Antipsychotic Drugs Industry Volume (Dosage) Forecast, by Application 2019 & 2032
- Table 89: Rest of South America Antipsychotic Drugs Industry Revenue (Million) Forecast, by Application 2019 & 2032
- Table 90: Rest of South America Antipsychotic Drugs Industry Volume (Dosage) Forecast, by Application 2019 & 2032
Frequently Asked Questions
1. What is the projected Compound Annual Growth Rate (CAGR) of the Antipsychotic Drugs Industry?
The projected CAGR is approximately 5.60%.
2. Which companies are prominent players in the Antipsychotic Drugs Industry?
Key companies in the market include Eli Lily and Company, Sumitomo Pharma Co Ltd, H Lundbeck A/S, Alkermes, Acadia Pharmaceuticals Inc, GlaxoSmithKline plc, Intra-Cellular Therapies Inc, Teva Pharmaceutical Industries Ltd, AstraZeneca plc, AbbVie Inc, Johnson & Johnson, Otsuka Pharmaceutical Co Ltd, Pfizer Inc.
3. What are the main segments of the Antipsychotic Drugs Industry?
The market segments include Application, Drug Classification.
4. Can you provide details about the market size?
The market size is estimated to be USD XX Million as of 2022.
5. What are some drivers contributing to market growth?
Rising Prevalence of Mental Disorders; Increasing Focus of Governments and Health Care Organizations on Mental Health; Constant Investment in Research and Development.
6. What are the notable trends driving market growth?
Schizophrenia is Expected to Hold Major Share in the Market over the Forecast Period.
7. Are there any restraints impacting market growth?
Addiction Caused Due to the Antipsychotic Drugs; Patent Expiry of Major Drugs.
8. Can you provide examples of recent developments in the market?
In January 2023, Luye Pharma Group received the Food and Drug Administration approval for Rykindo with the aim to treat Schizophrenia and bipolar 1 disorder.
9. What pricing options are available for accessing the report?
Pricing options include single-user, multi-user, and enterprise licenses priced at USD 4750, USD 5250, and USD 8750 respectively.
10. Is the market size provided in terms of value or volume?
The market size is provided in terms of value, measured in Million and volume, measured in Dosage.
11. Are there any specific market keywords associated with the report?
Yes, the market keyword associated with the report is "Antipsychotic Drugs Industry," which aids in identifying and referencing the specific market segment covered.
12. How do I determine which pricing option suits my needs best?
The pricing options vary based on user requirements and access needs. Individual users may opt for single-user licenses, while businesses requiring broader access may choose multi-user or enterprise licenses for cost-effective access to the report.
13. Are there any additional resources or data provided in the Antipsychotic Drugs Industry report?
While the report offers comprehensive insights, it's advisable to review the specific contents or supplementary materials provided to ascertain if additional resources or data are available.
14. How can I stay updated on further developments or reports in the Antipsychotic Drugs Industry?
To stay informed about further developments, trends, and reports in the Antipsychotic Drugs Industry, consider subscribing to industry newsletters, following relevant companies and organizations, or regularly checking reputable industry news sources and publications.
Methodology
Step 1 - Identification of Relevant Samples Size from Population Database


Step 2 - Approaches for Defining Global Market Size (Value, Volume* & Price*)

Note*: In applicable scenarios
Step 3 - Data Sources
Primary Research
- Web Analytics
- Survey Reports
- Research Institute
- Latest Research Reports
- Opinion Leaders
Secondary Research
- Annual Reports
- White Paper
- Latest Press Release
- Industry Association
- Paid Database
- Investor Presentations

Step 4 - Data Triangulation
Involves using different sources of information in order to increase the validity of a study
These sources are likely to be stakeholders in a program - participants, other researchers, program staff, other community members, and so on.
Then we put all data in single framework & apply various statistical tools to find out the dynamic on the market.
During the analysis stage, feedback from the stakeholder groups would be compared to determine areas of agreement as well as areas of divergence


