Market Projections for Carbon Accounting Market Industry 2025-2033

Carbon Accounting Market by Type (Cloud Based, On Premise), by End Users (Oil and Gas, Power Utilities, Construction and Infrastructure, Telecommunication, Food and Beverages, Other End Users), by North America (United States, Canada, Rest of North America), by Europe (Germany, France, United Kingdom, Italy, Spain, NORDIC, Russia, Turkey, Rest of Europe), by Asia Pacific (China, India, Australia, Japan, South Korea, Malaysia, Thailand, Indonesia, Vietnam, Rest of Asia Pacific), by Middle East and Africa (Saudi Arabia, United Arab Emirates, Nigeria, Egypt, Qatar, South Africa, Rest of Middle East and Africa), by South America (Brazil, Argentina, Colombia, Rest of South America) Forecast 2025-2033

Aug 2 2025
Base Year: 2024

234 Pages
Main Logo

Market Projections for Carbon Accounting Market Industry 2025-2033


Home
Industries
Energy & Power
sponsor image
sponsor image
sponsor image
sponsor image
sponsor image

Tailored for you

  • In-depth Analysis Tailored to Specified Regions or Segments
  • Company Profiles Customized to User Preferences
  • Comprehensive Insights Focused on Specific Segments or Regions
  • Customized Evaluation of Competitive Landscape to Meet Your Needs
  • Tailored Customization to Address Other Specific Requirements
Ask for customization


Key Insights

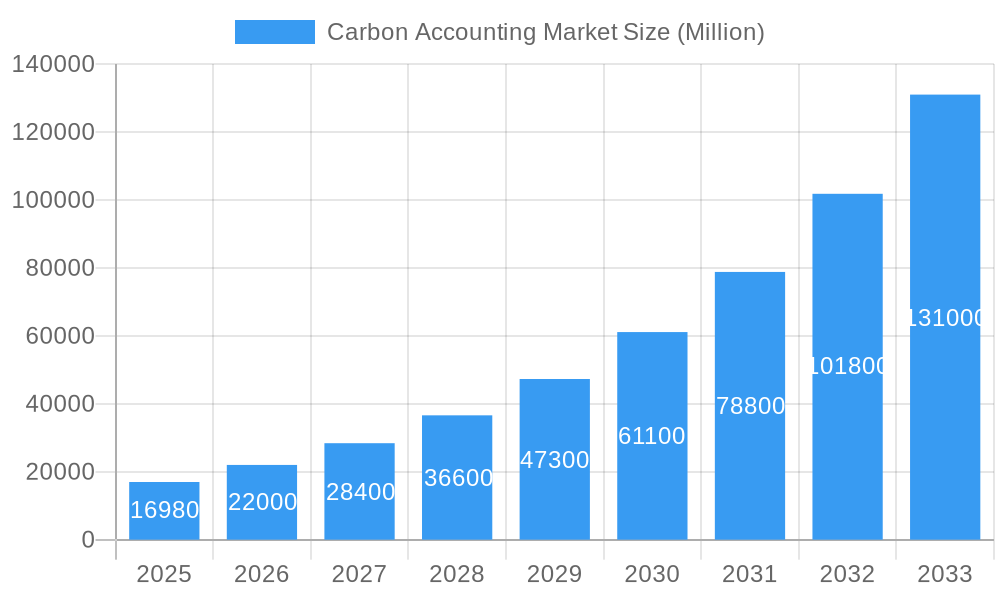
The global carbon accounting market is experiencing robust growth, projected to reach \$16.98 billion in 2025 and exhibiting a remarkable Compound Annual Growth Rate (CAGR) of 29.33% from 2025 to 2033. This expansion is fueled by increasing regulatory pressures for carbon emission reporting, heightened corporate sustainability initiatives, and growing investor demand for Environmental, Social, and Governance (ESG) disclosures. Key drivers include the rising adoption of cloud-based solutions for enhanced data management and analysis, coupled with advancements in carbon accounting methodologies and technologies. The market is segmented by end-user industries, such as oil and gas, power utilities, and construction & infrastructure, each contributing significantly to market demand based on their respective emission profiles and regulatory scrutiny. The preference for cloud-based solutions over on-premise systems reflects the industry's shift towards scalable and cost-effective solutions. North America and Europe currently hold significant market shares, driven by stringent environmental regulations and strong corporate social responsibility commitments. However, rapid growth is anticipated in the Asia-Pacific region, fueled by increasing industrialization and government policies promoting sustainable development.
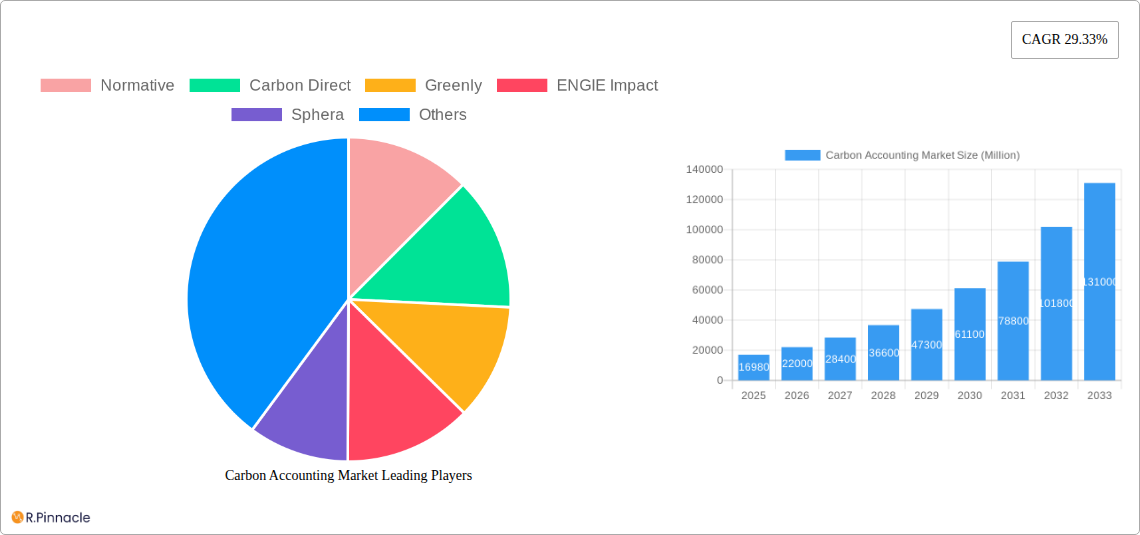
The competitive landscape is characterized by a mix of established players and innovative startups. Companies like Normative, Carbon Direct, and Greenly are leading the charge with specialized carbon accounting platforms and services. Larger corporations like IBM and Diligent are also expanding their offerings to cater to the growing demand. Future growth will depend on several factors, including technological advancements, the effectiveness of international climate agreements, and the evolving landscape of carbon pricing mechanisms. The market is expected to see increased consolidation through mergers and acquisitions as larger players seek to expand their market reach and capabilities. The continued focus on improving data accuracy, integrating with other ESG reporting frameworks, and offering more comprehensive solutions will be critical for continued success within this dynamic market.

Carbon Accounting Market Research Report - Market Size, Growth & Forecast

Carbon Accounting Market: A Comprehensive Report (2019-2033)

This comprehensive report provides an in-depth analysis of the Carbon Accounting Market, offering valuable insights for industry professionals, investors, and stakeholders. The study covers the period 2019-2033, with a focus on the forecast period 2025-2033 and a base year of 2025. The report leverages extensive market research and data analysis to present a clear picture of market dynamics, key players, and future trends. Expected market value in 2025 is estimated at $XX Million.

Carbon Accounting Market Market Structure & Innovation Trends

The Carbon Accounting market is experiencing significant growth driven by increasing regulatory pressure, heightened corporate social responsibility (CSR) initiatives, and advancements in data analytics and software solutions. Market concentration is moderate, with several key players holding substantial market share, while numerous smaller companies compete in niche segments. Normative, Carbon Direct, and Greenly are among the leading players, each vying for dominance with innovative product offerings and strategic partnerships. The market is characterized by continuous innovation, fueled by the need for more accurate, efficient, and user-friendly carbon accounting solutions.

  • Market Concentration: Moderate, with top 5 players holding approximately XX% of the market share in 2024.
  • Innovation Drivers: Demand for precise measurement, regulatory compliance, and improved data visualization.
  • Regulatory Frameworks: Stringent emission reduction targets and carbon reporting mandates are major growth catalysts.
  • Product Substitutes: Limited, as specialized carbon accounting solutions offer unique functionalities.
  • End-User Demographics: Primarily large enterprises across diverse sectors, with increasing adoption among SMEs.
  • M&A Activities: Several significant M&A transactions have occurred in recent years, with deal values exceeding $XX Million in the last 5 years, further consolidating the market.
Carbon Accounting Market Growth

Carbon Accounting Market Market Dynamics & Trends

The Carbon Accounting market is projected to exhibit a robust Compound Annual Growth Rate (CAGR) of XX% during the forecast period (2025-2033). This growth is driven by several factors:

  • Stringent environmental regulations: Governments worldwide are implementing stricter emission reduction targets, forcing companies to accurately measure and report their carbon footprint.
  • Growing investor interest: ESG (Environmental, Social, and Governance) investing is gaining momentum, increasing the demand for reliable carbon accounting data.
  • Technological advancements: Cloud-based solutions, AI-powered analytics, and improved data integration are enhancing the efficiency and accuracy of carbon accounting processes.
  • Increased corporate social responsibility: Companies are increasingly adopting sustainability initiatives, driving the adoption of carbon accounting tools.
  • Market penetration: The market penetration rate for carbon accounting solutions remains relatively low, indicating significant untapped potential.
Carbon Accounting Market Growth

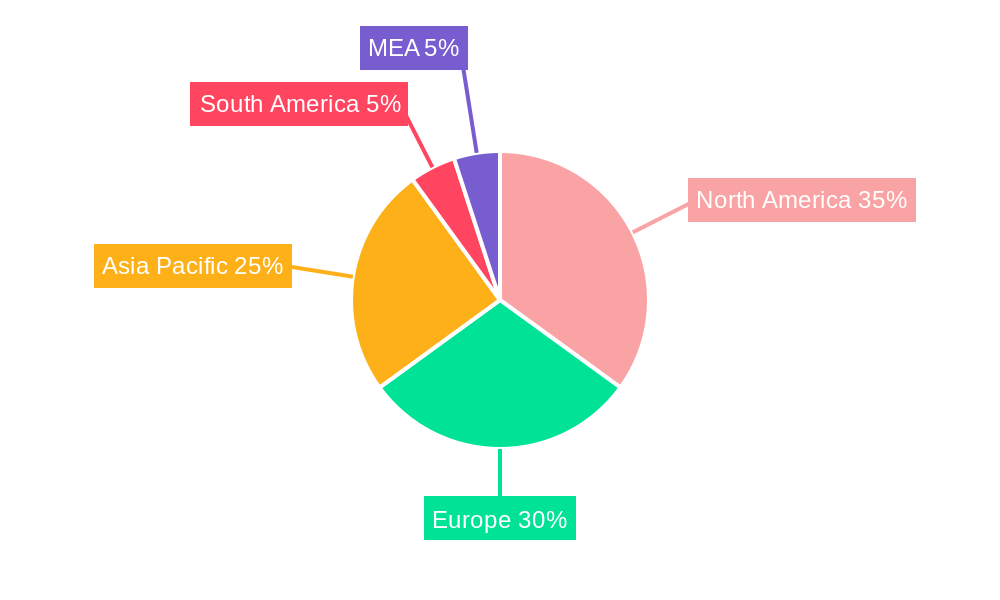
Dominant Regions & Segments in Carbon Accounting Market

The North American region currently dominates the Carbon Accounting market, followed by Europe. However, Asia-Pacific is expected to show significant growth over the forecast period. Within end-user segments, the Oil and Gas sector currently holds the largest market share, driven by stringent regulatory requirements and the industry's significant carbon footprint.

  • Dominant Region: North America

  • Key Drivers:

    • North America: Stringent environmental regulations, high corporate awareness of ESG concerns, and a well-developed technology infrastructure.
    • Europe: Stringent EU emissions regulations, strong focus on sustainability, and robust government incentives.
    • Asia-Pacific: Rapid economic growth, increasing industrialization, and growing awareness of climate change.
  • Dominant End-User Segments: Oil and Gas, followed by Power Utilities and Construction and Infrastructure.

  • Dominant Type: Cloud-based solutions are experiencing rapid growth due to their scalability, accessibility, and cost-effectiveness.

Carbon Accounting Market Product Innovations

Recent innovations in the Carbon Accounting market focus on improving data accuracy, automation, and user experience. Cloud-based solutions are becoming increasingly prevalent, offering scalability and seamless integration with other enterprise systems. AI-powered analytics are being incorporated to enhance data interpretation and provide more actionable insights. Furthermore, user-friendly interfaces are being developed to make carbon accounting accessible to a wider range of businesses.

Report Scope & Segmentation Analysis

This report segments the Carbon Accounting market based on end-users (Oil and Gas, Power Utilities, Construction and Infrastructure, Telecommunication, Food and Beverages, Other End Users) and deployment type (Cloud Based, On-Premise). Each segment's growth projections, market size, and competitive dynamics are analyzed. The Oil and Gas segment is expected to dominate the market throughout the forecast period, followed by the Power Utilities sector. Cloud-based solutions are anticipated to witness faster growth than on-premise deployments due to their scalability and accessibility.

Key Drivers of Carbon Accounting Market Growth

The growth of the Carbon Accounting market is propelled by several key factors:

  • Increasing regulatory pressure: Governments are implementing stricter emission reduction targets and mandatory carbon reporting regulations.
  • Growing corporate social responsibility: Businesses are increasingly adopting sustainable practices and prioritizing transparency in their environmental performance.
  • Advancements in technology: Cloud-based solutions, AI-powered analytics, and improved data integration are enhancing the efficiency and accuracy of carbon accounting.
  • Rising investor demand for ESG data: Investors are increasingly incorporating ESG factors into their investment decisions, increasing the demand for reliable carbon accounting data.

Challenges in the Carbon Accounting Market Sector

Despite the promising growth outlook, several challenges hinder the widespread adoption of carbon accounting solutions:

  • Data accuracy and consistency: Obtaining accurate and consistent data across complex value chains remains a challenge.
  • High implementation costs: Implementing sophisticated carbon accounting systems can be expensive, particularly for SMEs.
  • Lack of standardization: The absence of globally standardized methodologies creates challenges in comparing carbon footprints across different organizations.
  • Data security and privacy concerns: The increasing volume of data collected for carbon accounting raises concerns about data security and privacy.

Emerging Opportunities in Carbon Accounting Market

Several emerging trends present significant opportunities for growth in the Carbon Accounting market:

  • Expansion into emerging markets: Developing economies are increasingly adopting carbon accounting solutions as awareness of climate change grows.
  • Integration with other sustainability solutions: Integrating carbon accounting with other ESG software and platforms offers significant value to businesses.
  • Development of innovative technologies: AI, machine learning, and blockchain technology offer opportunities for improving data accuracy and efficiency.
  • Increased focus on Scope 3 emissions: Companies are increasingly focusing on measuring and reducing their Scope 3 emissions, creating a demand for more advanced carbon accounting solutions.

Leading Players in the Carbon Accounting Market Market

  • Normative
  • Carbon Direct
  • Greenly
  • ENGIE Impact
  • Sphera
  • SINAI Technologies
  • Persefoni AI
  • Emitwise
  • International Business Machines Corporation
  • Diligent Corporation

Key Developments in Carbon Accounting Market Industry

  • March 2024: Greenly secured USD 52 Million in Series B funding, aiming to enhance its carbon accounting methodologies and expand its global market share.
  • March 2024: Green Project Technologies launched its Green Project White Label solution, enabling ESG service providers to integrate carbon accounting into their offerings.

Future Outlook for Carbon Accounting Market Market

The Carbon Accounting market is poised for continued growth, driven by increasing regulatory pressure, heightened corporate sustainability initiatives, and technological advancements. The market's future potential is significant, particularly in emerging economies and among SMEs. Strategic partnerships, technological innovation, and a focus on data accuracy will be crucial for success in this rapidly evolving market.

Carbon Accounting Market Segmentation

  • 1. Type
    • 1.1. Cloud Based
    • 1.2. On Premise
  • 2. End Users
    • 2.1. Oil and Gas
    • 2.2. Power Utilities
    • 2.3. Construction and Infrastructure
    • 2.4. Telecommunication
    • 2.5. Food and Beverages
    • 2.6. Other End Users

Carbon Accounting Market Segmentation By Geography

  • 1. North America
    • 1.1. United States
    • 1.2. Canada
    • 1.3. Rest of North America
  • 2. Europe
    • 2.1. Germany
    • 2.2. France
    • 2.3. United Kingdom
    • 2.4. Italy
    • 2.5. Spain
    • 2.6. NORDIC
    • 2.7. Russia
    • 2.8. Turkey
    • 2.9. Rest of Europe
  • 3. Asia Pacific
    • 3.1. China
    • 3.2. India
    • 3.3. Australia
    • 3.4. Japan
    • 3.5. South Korea
    • 3.6. Malaysia
    • 3.7. Thailand
    • 3.8. Indonesia
    • 3.9. Vietnam
    • 3.10. Rest of Asia Pacific
  • 4. Middle East and Africa
    • 4.1. Saudi Arabia
    • 4.2. United Arab Emirates
    • 4.3. Nigeria
    • 4.4. Egypt
    • 4.5. Qatar
    • 4.6. South Africa
    • 4.7. Rest of Middle East and Africa
  • 5. South America
    • 5.1. Brazil
    • 5.2. Argentina
    • 5.3. Colombia
    • 5.4. Rest of South America
Carbon Accounting Market Regional Share


Carbon Accounting Market REPORT HIGHLIGHTS

AspectsDetails
Study Period 2019-2033
Base Year 2024
Estimated Year 2025
Forecast Period2025-2033
Historical Period2019-2024
Growth RateCAGR of 29.33% from 2019-2033
Segmentation
    • By Type
      • Cloud Based
      • On Premise
    • By End Users
      • Oil and Gas
      • Power Utilities
      • Construction and Infrastructure
      • Telecommunication
      • Food and Beverages
      • Other End Users
  • By Geography
    • North America
      • United States
      • Canada
      • Rest of North America
    • Europe
      • Germany
      • France
      • United Kingdom
      • Italy
      • Spain
      • NORDIC
      • Russia
      • Turkey
      • Rest of Europe
    • Asia Pacific
      • China
      • India
      • Australia
      • Japan
      • South Korea
      • Malaysia
      • Thailand
      • Indonesia
      • Vietnam
      • Rest of Asia Pacific
    • Middle East and Africa
      • Saudi Arabia
      • United Arab Emirates
      • Nigeria
      • Egypt
      • Qatar
      • South Africa
      • Rest of Middle East and Africa
    • South America
      • Brazil
      • Argentina
      • Colombia
      • Rest of South America


Table of Contents

  1. 1. Introduction
    • 1.1. Research Scope
    • 1.2. Market Segmentation
    • 1.3. Research Methodology
    • 1.4. Definitions and Assumptions
  2. 2. Executive Summary
    • 2.1. Introduction
  3. 3. Market Dynamics
    • 3.1. Introduction
      • 3.2. Market Drivers
        • 3.2.1. 4.; Corporate Sustainability Goals4.; Stringent Regultions and Compliance
      • 3.3. Market Restrains
        • 3.3.1. 4.; High Complexity in Carbon Accounting
      • 3.4. Market Trends
        • 3.4.1. The Power Utilities Segment to Witness Significant Growth
  4. 4. Market Factor Analysis
    • 4.1. Porters Five Forces
    • 4.2. Supply/Value Chain
    • 4.3. PESTEL analysis
    • 4.4. Market Entropy
    • 4.5. Patent/Trademark Analysis
  5. 5. Global Carbon Accounting Market Analysis, Insights and Forecast, 2019-2031
    • 5.1. Market Analysis, Insights and Forecast - by Type
      • 5.1.1. Cloud Based
      • 5.1.2. On Premise
    • 5.2. Market Analysis, Insights and Forecast - by End Users
      • 5.2.1. Oil and Gas
      • 5.2.2. Power Utilities
      • 5.2.3. Construction and Infrastructure
      • 5.2.4. Telecommunication
      • 5.2.5. Food and Beverages
      • 5.2.6. Other End Users
    • 5.3. Market Analysis, Insights and Forecast - by Region
      • 5.3.1. North America
      • 5.3.2. Europe
      • 5.3.3. Asia Pacific
      • 5.3.4. Middle East and Africa
      • 5.3.5. South America
  6. 6. North America Carbon Accounting Market Analysis, Insights and Forecast, 2019-2031
    • 6.1. Market Analysis, Insights and Forecast - by Type
      • 6.1.1. Cloud Based
      • 6.1.2. On Premise
    • 6.2. Market Analysis, Insights and Forecast - by End Users
      • 6.2.1. Oil and Gas
      • 6.2.2. Power Utilities
      • 6.2.3. Construction and Infrastructure
      • 6.2.4. Telecommunication
      • 6.2.5. Food and Beverages
      • 6.2.6. Other End Users
  7. 7. Europe Carbon Accounting Market Analysis, Insights and Forecast, 2019-2031
    • 7.1. Market Analysis, Insights and Forecast - by Type
      • 7.1.1. Cloud Based
      • 7.1.2. On Premise
    • 7.2. Market Analysis, Insights and Forecast - by End Users
      • 7.2.1. Oil and Gas
      • 7.2.2. Power Utilities
      • 7.2.3. Construction and Infrastructure
      • 7.2.4. Telecommunication
      • 7.2.5. Food and Beverages
      • 7.2.6. Other End Users
  8. 8. Asia Pacific Carbon Accounting Market Analysis, Insights and Forecast, 2019-2031
    • 8.1. Market Analysis, Insights and Forecast - by Type
      • 8.1.1. Cloud Based
      • 8.1.2. On Premise
    • 8.2. Market Analysis, Insights and Forecast - by End Users
      • 8.2.1. Oil and Gas
      • 8.2.2. Power Utilities
      • 8.2.3. Construction and Infrastructure
      • 8.2.4. Telecommunication
      • 8.2.5. Food and Beverages
      • 8.2.6. Other End Users
  9. 9. Middle East and Africa Carbon Accounting Market Analysis, Insights and Forecast, 2019-2031
    • 9.1. Market Analysis, Insights and Forecast - by Type
      • 9.1.1. Cloud Based
      • 9.1.2. On Premise
    • 9.2. Market Analysis, Insights and Forecast - by End Users
      • 9.2.1. Oil and Gas
      • 9.2.2. Power Utilities
      • 9.2.3. Construction and Infrastructure
      • 9.2.4. Telecommunication
      • 9.2.5. Food and Beverages
      • 9.2.6. Other End Users
  10. 10. South America Carbon Accounting Market Analysis, Insights and Forecast, 2019-2031
    • 10.1. Market Analysis, Insights and Forecast - by Type
      • 10.1.1. Cloud Based
      • 10.1.2. On Premise
    • 10.2. Market Analysis, Insights and Forecast - by End Users
      • 10.2.1. Oil and Gas
      • 10.2.2. Power Utilities
      • 10.2.3. Construction and Infrastructure
      • 10.2.4. Telecommunication
      • 10.2.5. Food and Beverages
      • 10.2.6. Other End Users
  11. 11. North America Carbon Accounting Market Analysis, Insights and Forecast, 2019-2031
      • 11.1. Market Analysis, Insights and Forecast - By Country/Sub-region
        • 11.1.1 United States
        • 11.1.2 Canada
        • 11.1.3 Mexico
  12. 12. Europe Carbon Accounting Market Analysis, Insights and Forecast, 2019-2031
      • 12.1. Market Analysis, Insights and Forecast - By Country/Sub-region
        • 12.1.1 Germany
        • 12.1.2 United Kingdom
        • 12.1.3 France
        • 12.1.4 Spain
        • 12.1.5 Italy
        • 12.1.6 Spain
        • 12.1.7 Belgium
        • 12.1.8 Netherland
        • 12.1.9 Nordics
        • 12.1.10 Rest of Europe
  13. 13. Asia Pacific Carbon Accounting Market Analysis, Insights and Forecast, 2019-2031
      • 13.1. Market Analysis, Insights and Forecast - By Country/Sub-region
        • 13.1.1 China
        • 13.1.2 Japan
        • 13.1.3 India
        • 13.1.4 South Korea
        • 13.1.5 Southeast Asia
        • 13.1.6 Australia
        • 13.1.7 Indonesia
        • 13.1.8 Phillipes
        • 13.1.9 Singapore
        • 13.1.10 Thailandc
        • 13.1.11 Rest of Asia Pacific
  14. 14. South America Carbon Accounting Market Analysis, Insights and Forecast, 2019-2031
      • 14.1. Market Analysis, Insights and Forecast - By Country/Sub-region
        • 14.1.1 Brazil
        • 14.1.2 Argentina
        • 14.1.3 Peru
        • 14.1.4 Chile
        • 14.1.5 Colombia
        • 14.1.6 Ecuador
        • 14.1.7 Venezuela
        • 14.1.8 Rest of South America
  15. 15. MEA Carbon Accounting Market Analysis, Insights and Forecast, 2019-2031
      • 15.1. Market Analysis, Insights and Forecast - By Country/Sub-region
        • 15.1.1 United Arab Emirates
        • 15.1.2 Saudi Arabia
        • 15.1.3 South Africa
        • 15.1.4 Rest of Middle East and Africa
  16. 16. Competitive Analysis
    • 16.1. Global Market Share Analysis 2024
      • 16.2. Company Profiles
        • 16.2.1 Normative
          • 16.2.1.1. Overview
          • 16.2.1.2. Products
          • 16.2.1.3. SWOT Analysis
          • 16.2.1.4. Recent Developments
          • 16.2.1.5. Financials (Based on Availability)
        • 16.2.2 Carbon Direct
          • 16.2.2.1. Overview
          • 16.2.2.2. Products
          • 16.2.2.3. SWOT Analysis
          • 16.2.2.4. Recent Developments
          • 16.2.2.5. Financials (Based on Availability)
        • 16.2.3 Greenly
          • 16.2.3.1. Overview
          • 16.2.3.2. Products
          • 16.2.3.3. SWOT Analysis
          • 16.2.3.4. Recent Developments
          • 16.2.3.5. Financials (Based on Availability)
        • 16.2.4 ENGIE Impact
          • 16.2.4.1. Overview
          • 16.2.4.2. Products
          • 16.2.4.3. SWOT Analysis
          • 16.2.4.4. Recent Developments
          • 16.2.4.5. Financials (Based on Availability)
        • 16.2.5 Sphera
          • 16.2.5.1. Overview
          • 16.2.5.2. Products
          • 16.2.5.3. SWOT Analysis
          • 16.2.5.4. Recent Developments
          • 16.2.5.5. Financials (Based on Availability)
        • 16.2.6 SINAI Technologies
          • 16.2.6.1. Overview
          • 16.2.6.2. Products
          • 16.2.6.3. SWOT Analysis
          • 16.2.6.4. Recent Developments
          • 16.2.6.5. Financials (Based on Availability)
        • 16.2.7 Persefoni AI
          • 16.2.7.1. Overview
          • 16.2.7.2. Products
          • 16.2.7.3. SWOT Analysis
          • 16.2.7.4. Recent Developments
          • 16.2.7.5. Financials (Based on Availability)
        • 16.2.8 Emitwise
          • 16.2.8.1. Overview
          • 16.2.8.2. Products
          • 16.2.8.3. SWOT Analysis
          • 16.2.8.4. Recent Developments
          • 16.2.8.5. Financials (Based on Availability)
        • 16.2.9 International Business Machines Corporation
          • 16.2.9.1. Overview
          • 16.2.9.2. Products
          • 16.2.9.3. SWOT Analysis
          • 16.2.9.4. Recent Developments
          • 16.2.9.5. Financials (Based on Availability)
        • 16.2.10 Diligent Corporation
          • 16.2.10.1. Overview
          • 16.2.10.2. Products
          • 16.2.10.3. SWOT Analysis
          • 16.2.10.4. Recent Developments
          • 16.2.10.5. Financials (Based on Availability)

List of Figures

  1. Figure 1: Global Carbon Accounting Market Revenue Breakdown (Million, %) by Region 2024 & 2032
  2. Figure 2: North America Carbon Accounting Market Revenue (Million), by Country 2024 & 2032
  3. Figure 3: North America Carbon Accounting Market Revenue Share (%), by Country 2024 & 2032
  4. Figure 4: Europe Carbon Accounting Market Revenue (Million), by Country 2024 & 2032
  5. Figure 5: Europe Carbon Accounting Market Revenue Share (%), by Country 2024 & 2032
  6. Figure 6: Asia Pacific Carbon Accounting Market Revenue (Million), by Country 2024 & 2032
  7. Figure 7: Asia Pacific Carbon Accounting Market Revenue Share (%), by Country 2024 & 2032
  8. Figure 8: South America Carbon Accounting Market Revenue (Million), by Country 2024 & 2032
  9. Figure 9: South America Carbon Accounting Market Revenue Share (%), by Country 2024 & 2032
  10. Figure 10: MEA Carbon Accounting Market Revenue (Million), by Country 2024 & 2032
  11. Figure 11: MEA Carbon Accounting Market Revenue Share (%), by Country 2024 & 2032
  12. Figure 12: North America Carbon Accounting Market Revenue (Million), by Type 2024 & 2032
  13. Figure 13: North America Carbon Accounting Market Revenue Share (%), by Type 2024 & 2032
  14. Figure 14: North America Carbon Accounting Market Revenue (Million), by End Users 2024 & 2032
  15. Figure 15: North America Carbon Accounting Market Revenue Share (%), by End Users 2024 & 2032
  16. Figure 16: North America Carbon Accounting Market Revenue (Million), by Country 2024 & 2032
  17. Figure 17: North America Carbon Accounting Market Revenue Share (%), by Country 2024 & 2032
  18. Figure 18: Europe Carbon Accounting Market Revenue (Million), by Type 2024 & 2032
  19. Figure 19: Europe Carbon Accounting Market Revenue Share (%), by Type 2024 & 2032
  20. Figure 20: Europe Carbon Accounting Market Revenue (Million), by End Users 2024 & 2032
  21. Figure 21: Europe Carbon Accounting Market Revenue Share (%), by End Users 2024 & 2032
  22. Figure 22: Europe Carbon Accounting Market Revenue (Million), by Country 2024 & 2032
  23. Figure 23: Europe Carbon Accounting Market Revenue Share (%), by Country 2024 & 2032
  24. Figure 24: Asia Pacific Carbon Accounting Market Revenue (Million), by Type 2024 & 2032
  25. Figure 25: Asia Pacific Carbon Accounting Market Revenue Share (%), by Type 2024 & 2032
  26. Figure 26: Asia Pacific Carbon Accounting Market Revenue (Million), by End Users 2024 & 2032
  27. Figure 27: Asia Pacific Carbon Accounting Market Revenue Share (%), by End Users 2024 & 2032
  28. Figure 28: Asia Pacific Carbon Accounting Market Revenue (Million), by Country 2024 & 2032
  29. Figure 29: Asia Pacific Carbon Accounting Market Revenue Share (%), by Country 2024 & 2032
  30. Figure 30: Middle East and Africa Carbon Accounting Market Revenue (Million), by Type 2024 & 2032
  31. Figure 31: Middle East and Africa Carbon Accounting Market Revenue Share (%), by Type 2024 & 2032
  32. Figure 32: Middle East and Africa Carbon Accounting Market Revenue (Million), by End Users 2024 & 2032
  33. Figure 33: Middle East and Africa Carbon Accounting Market Revenue Share (%), by End Users 2024 & 2032
  34. Figure 34: Middle East and Africa Carbon Accounting Market Revenue (Million), by Country 2024 & 2032
  35. Figure 35: Middle East and Africa Carbon Accounting Market Revenue Share (%), by Country 2024 & 2032
  36. Figure 36: South America Carbon Accounting Market Revenue (Million), by Type 2024 & 2032
  37. Figure 37: South America Carbon Accounting Market Revenue Share (%), by Type 2024 & 2032
  38. Figure 38: South America Carbon Accounting Market Revenue (Million), by End Users 2024 & 2032
  39. Figure 39: South America Carbon Accounting Market Revenue Share (%), by End Users 2024 & 2032
  40. Figure 40: South America Carbon Accounting Market Revenue (Million), by Country 2024 & 2032
  41. Figure 41: South America Carbon Accounting Market Revenue Share (%), by Country 2024 & 2032

List of Tables

  1. Table 1: Global Carbon Accounting Market Revenue Million Forecast, by Region 2019 & 2032
  2. Table 2: Global Carbon Accounting Market Revenue Million Forecast, by Type 2019 & 2032
  3. Table 3: Global Carbon Accounting Market Revenue Million Forecast, by End Users 2019 & 2032
  4. Table 4: Global Carbon Accounting Market Revenue Million Forecast, by Region 2019 & 2032
  5. Table 5: Global Carbon Accounting Market Revenue Million Forecast, by Country 2019 & 2032
  6. Table 6: United States Carbon Accounting Market Revenue (Million) Forecast, by Application 2019 & 2032
  7. Table 7: Canada Carbon Accounting Market Revenue (Million) Forecast, by Application 2019 & 2032
  8. Table 8: Mexico Carbon Accounting Market Revenue (Million) Forecast, by Application 2019 & 2032
  9. Table 9: Global Carbon Accounting Market Revenue Million Forecast, by Country 2019 & 2032
  10. Table 10: Germany Carbon Accounting Market Revenue (Million) Forecast, by Application 2019 & 2032
  11. Table 11: United Kingdom Carbon Accounting Market Revenue (Million) Forecast, by Application 2019 & 2032
  12. Table 12: France Carbon Accounting Market Revenue (Million) Forecast, by Application 2019 & 2032
  13. Table 13: Spain Carbon Accounting Market Revenue (Million) Forecast, by Application 2019 & 2032
  14. Table 14: Italy Carbon Accounting Market Revenue (Million) Forecast, by Application 2019 & 2032
  15. Table 15: Spain Carbon Accounting Market Revenue (Million) Forecast, by Application 2019 & 2032
  16. Table 16: Belgium Carbon Accounting Market Revenue (Million) Forecast, by Application 2019 & 2032
  17. Table 17: Netherland Carbon Accounting Market Revenue (Million) Forecast, by Application 2019 & 2032
  18. Table 18: Nordics Carbon Accounting Market Revenue (Million) Forecast, by Application 2019 & 2032
  19. Table 19: Rest of Europe Carbon Accounting Market Revenue (Million) Forecast, by Application 2019 & 2032
  20. Table 20: Global Carbon Accounting Market Revenue Million Forecast, by Country 2019 & 2032
  21. Table 21: China Carbon Accounting Market Revenue (Million) Forecast, by Application 2019 & 2032
  22. Table 22: Japan Carbon Accounting Market Revenue (Million) Forecast, by Application 2019 & 2032
  23. Table 23: India Carbon Accounting Market Revenue (Million) Forecast, by Application 2019 & 2032
  24. Table 24: South Korea Carbon Accounting Market Revenue (Million) Forecast, by Application 2019 & 2032
  25. Table 25: Southeast Asia Carbon Accounting Market Revenue (Million) Forecast, by Application 2019 & 2032
  26. Table 26: Australia Carbon Accounting Market Revenue (Million) Forecast, by Application 2019 & 2032
  27. Table 27: Indonesia Carbon Accounting Market Revenue (Million) Forecast, by Application 2019 & 2032
  28. Table 28: Phillipes Carbon Accounting Market Revenue (Million) Forecast, by Application 2019 & 2032
  29. Table 29: Singapore Carbon Accounting Market Revenue (Million) Forecast, by Application 2019 & 2032
  30. Table 30: Thailandc Carbon Accounting Market Revenue (Million) Forecast, by Application 2019 & 2032
  31. Table 31: Rest of Asia Pacific Carbon Accounting Market Revenue (Million) Forecast, by Application 2019 & 2032
  32. Table 32: Global Carbon Accounting Market Revenue Million Forecast, by Country 2019 & 2032
  33. Table 33: Brazil Carbon Accounting Market Revenue (Million) Forecast, by Application 2019 & 2032
  34. Table 34: Argentina Carbon Accounting Market Revenue (Million) Forecast, by Application 2019 & 2032
  35. Table 35: Peru Carbon Accounting Market Revenue (Million) Forecast, by Application 2019 & 2032
  36. Table 36: Chile Carbon Accounting Market Revenue (Million) Forecast, by Application 2019 & 2032
  37. Table 37: Colombia Carbon Accounting Market Revenue (Million) Forecast, by Application 2019 & 2032
  38. Table 38: Ecuador Carbon Accounting Market Revenue (Million) Forecast, by Application 2019 & 2032
  39. Table 39: Venezuela Carbon Accounting Market Revenue (Million) Forecast, by Application 2019 & 2032
  40. Table 40: Rest of South America Carbon Accounting Market Revenue (Million) Forecast, by Application 2019 & 2032
  41. Table 41: Global Carbon Accounting Market Revenue Million Forecast, by Country 2019 & 2032
  42. Table 42: United Arab Emirates Carbon Accounting Market Revenue (Million) Forecast, by Application 2019 & 2032
  43. Table 43: Saudi Arabia Carbon Accounting Market Revenue (Million) Forecast, by Application 2019 & 2032
  44. Table 44: South Africa Carbon Accounting Market Revenue (Million) Forecast, by Application 2019 & 2032
  45. Table 45: Rest of Middle East and Africa Carbon Accounting Market Revenue (Million) Forecast, by Application 2019 & 2032
  46. Table 46: Global Carbon Accounting Market Revenue Million Forecast, by Type 2019 & 2032
  47. Table 47: Global Carbon Accounting Market Revenue Million Forecast, by End Users 2019 & 2032
  48. Table 48: Global Carbon Accounting Market Revenue Million Forecast, by Country 2019 & 2032
  49. Table 49: United States Carbon Accounting Market Revenue (Million) Forecast, by Application 2019 & 2032
  50. Table 50: Canada Carbon Accounting Market Revenue (Million) Forecast, by Application 2019 & 2032
  51. Table 51: Rest of North America Carbon Accounting Market Revenue (Million) Forecast, by Application 2019 & 2032
  52. Table 52: Global Carbon Accounting Market Revenue Million Forecast, by Type 2019 & 2032
  53. Table 53: Global Carbon Accounting Market Revenue Million Forecast, by End Users 2019 & 2032
  54. Table 54: Global Carbon Accounting Market Revenue Million Forecast, by Country 2019 & 2032
  55. Table 55: Germany Carbon Accounting Market Revenue (Million) Forecast, by Application 2019 & 2032
  56. Table 56: France Carbon Accounting Market Revenue (Million) Forecast, by Application 2019 & 2032
  57. Table 57: United Kingdom Carbon Accounting Market Revenue (Million) Forecast, by Application 2019 & 2032
  58. Table 58: Italy Carbon Accounting Market Revenue (Million) Forecast, by Application 2019 & 2032
  59. Table 59: Spain Carbon Accounting Market Revenue (Million) Forecast, by Application 2019 & 2032
  60. Table 60: NORDIC Carbon Accounting Market Revenue (Million) Forecast, by Application 2019 & 2032
  61. Table 61: Russia Carbon Accounting Market Revenue (Million) Forecast, by Application 2019 & 2032
  62. Table 62: Turkey Carbon Accounting Market Revenue (Million) Forecast, by Application 2019 & 2032
  63. Table 63: Rest of Europe Carbon Accounting Market Revenue (Million) Forecast, by Application 2019 & 2032
  64. Table 64: Global Carbon Accounting Market Revenue Million Forecast, by Type 2019 & 2032
  65. Table 65: Global Carbon Accounting Market Revenue Million Forecast, by End Users 2019 & 2032
  66. Table 66: Global Carbon Accounting Market Revenue Million Forecast, by Country 2019 & 2032
  67. Table 67: China Carbon Accounting Market Revenue (Million) Forecast, by Application 2019 & 2032
  68. Table 68: India Carbon Accounting Market Revenue (Million) Forecast, by Application 2019 & 2032
  69. Table 69: Australia Carbon Accounting Market Revenue (Million) Forecast, by Application 2019 & 2032
  70. Table 70: Japan Carbon Accounting Market Revenue (Million) Forecast, by Application 2019 & 2032
  71. Table 71: South Korea Carbon Accounting Market Revenue (Million) Forecast, by Application 2019 & 2032
  72. Table 72: Malaysia Carbon Accounting Market Revenue (Million) Forecast, by Application 2019 & 2032
  73. Table 73: Thailand Carbon Accounting Market Revenue (Million) Forecast, by Application 2019 & 2032
  74. Table 74: Indonesia Carbon Accounting Market Revenue (Million) Forecast, by Application 2019 & 2032
  75. Table 75: Vietnam Carbon Accounting Market Revenue (Million) Forecast, by Application 2019 & 2032
  76. Table 76: Rest of Asia Pacific Carbon Accounting Market Revenue (Million) Forecast, by Application 2019 & 2032
  77. Table 77: Global Carbon Accounting Market Revenue Million Forecast, by Type 2019 & 2032
  78. Table 78: Global Carbon Accounting Market Revenue Million Forecast, by End Users 2019 & 2032
  79. Table 79: Global Carbon Accounting Market Revenue Million Forecast, by Country 2019 & 2032
  80. Table 80: Saudi Arabia Carbon Accounting Market Revenue (Million) Forecast, by Application 2019 & 2032
  81. Table 81: United Arab Emirates Carbon Accounting Market Revenue (Million) Forecast, by Application 2019 & 2032
  82. Table 82: Nigeria Carbon Accounting Market Revenue (Million) Forecast, by Application 2019 & 2032
  83. Table 83: Egypt Carbon Accounting Market Revenue (Million) Forecast, by Application 2019 & 2032
  84. Table 84: Qatar Carbon Accounting Market Revenue (Million) Forecast, by Application 2019 & 2032
  85. Table 85: South Africa Carbon Accounting Market Revenue (Million) Forecast, by Application 2019 & 2032
  86. Table 86: Rest of Middle East and Africa Carbon Accounting Market Revenue (Million) Forecast, by Application 2019 & 2032
  87. Table 87: Global Carbon Accounting Market Revenue Million Forecast, by Type 2019 & 2032
  88. Table 88: Global Carbon Accounting Market Revenue Million Forecast, by End Users 2019 & 2032
  89. Table 89: Global Carbon Accounting Market Revenue Million Forecast, by Country 2019 & 2032
  90. Table 90: Brazil Carbon Accounting Market Revenue (Million) Forecast, by Application 2019 & 2032
  91. Table 91: Argentina Carbon Accounting Market Revenue (Million) Forecast, by Application 2019 & 2032
  92. Table 92: Colombia Carbon Accounting Market Revenue (Million) Forecast, by Application 2019 & 2032
  93. Table 93: Rest of South America Carbon Accounting Market Revenue (Million) Forecast, by Application 2019 & 2032


Frequently Asked Questions

1. What is the projected Compound Annual Growth Rate (CAGR) of the Carbon Accounting Market?

The projected CAGR is approximately 29.33%.

2. Which companies are prominent players in the Carbon Accounting Market?

Key companies in the market include Normative, Carbon Direct, Greenly, ENGIE Impact, Sphera, SINAI Technologies, Persefoni AI, Emitwise, International Business Machines Corporation, Diligent Corporation.

3. What are the main segments of the Carbon Accounting Market?

The market segments include Type, End Users.

4. Can you provide details about the market size?

The market size is estimated to be USD 16.98 Million as of 2022.

5. What are some drivers contributing to market growth?

4.; Corporate Sustainability Goals4.; Stringent Regultions and Compliance.

6. What are the notable trends driving market growth?

The Power Utilities Segment to Witness Significant Growth.

7. Are there any restraints impacting market growth?

4.; High Complexity in Carbon Accounting.

8. Can you provide examples of recent developments in the market?

March 2024: Greenly, a significant carbon accounting startup, announced that it secured funding for its series B round. The company raised USD 52 million in its Series B round. Investors aim to develop more precise carbon accounting methodologies and accurately deploy these solutions to increase the company’s market share globally.

9. What pricing options are available for accessing the report?

Pricing options include single-user, multi-user, and enterprise licenses priced at USD 4750, USD 5250, and USD 8750 respectively.

10. Is the market size provided in terms of value or volume?

The market size is provided in terms of value, measured in Million.

11. Are there any specific market keywords associated with the report?

Yes, the market keyword associated with the report is "Carbon Accounting Market," which aids in identifying and referencing the specific market segment covered.

12. How do I determine which pricing option suits my needs best?

The pricing options vary based on user requirements and access needs. Individual users may opt for single-user licenses, while businesses requiring broader access may choose multi-user or enterprise licenses for cost-effective access to the report.

13. Are there any additional resources or data provided in the Carbon Accounting Market report?

While the report offers comprehensive insights, it's advisable to review the specific contents or supplementary materials provided to ascertain if additional resources or data are available.

14. How can I stay updated on further developments or reports in the Carbon Accounting Market?

To stay informed about further developments, trends, and reports in the Carbon Accounting Market, consider subscribing to industry newsletters, following relevant companies and organizations, or regularly checking reputable industry news sources and publications.


Methodology

Step 1 - Identification of Relevant Samples Size from Population Database

Step Chart
Bar Chart
Method Chart

Step 2 - Approaches for Defining Global Market Size (Value, Volume* & Price*)

Approach Chart
Top-down and bottom-up approaches are used to validate the global market size and estimate the market size for manufactures, regional segments, product, and application.

Note*: In applicable scenarios

Step 3 - Data Sources

Primary Research

  • Web Analytics
  • Survey Reports
  • Research Institute
  • Latest Research Reports
  • Opinion Leaders

Secondary Research

  • Annual Reports
  • White Paper
  • Latest Press Release
  • Industry Association
  • Paid Database
  • Investor Presentations
Analyst Chart

Step 4 - Data Triangulation

Involves using different sources of information in order to increase the validity of a study

These sources are likely to be stakeholders in a program - participants, other researchers, program staff, other community members, and so on.

Then we put all data in single framework & apply various statistical tools to find out the dynamic on the market.

During the analysis stage, feedback from the stakeholder groups would be compared to determine areas of agreement as well as areas of divergence

Additionally, after gathering mixed and scattered data from a wide range of sources, data is triangulated and correlated to come up with estimated figures which are further validated through primary mediums or industry experts, opinion leaders.

About Report Pinnacle

Report Pinnacle provides top-tier market research, industry intelligence, and actionable insights for finance, technology, healthcare, and consumer sectors. Our reports empower you to make informed decisions and achieve business success.

Our expert team combines primary research, data analytics, and industry knowledge to deliver insights you can trust. We offer syndicated reports, custom research, and consulting services tailored to your unique business needs.

At Report Pinnacle, we are committed to quality, transparency, and client satisfaction. Every report is rigorously validated to ensure accuracy and relevance. Our global perspective and local expertise help you understand both broad trends and detailed market shifts.

Stay ahead with Report Pinnacle. Subscribe to our newsletter for the latest insights and research highlights, and follow us on social media for real-time updates.

Report Pinnacle – Your Partner for Reaching the Top in Market Intelligence.

artwork spiralartwork spiralRelated Reports
artwork underline

Asia-Pacific Coal Market Strategic Dynamics: Competitor Analysis 2025-2033

Discover the latest insights on the booming Asia-Pacific coal market. This comprehensive analysis reveals a CAGR exceeding 3%, driven by energy demand in China and India, yet facing constraints from environmental regulations. Explore market segmentation, key players, and future growth projections until 2033.

September 2025
Base Year: 2024
No Of Pages: 234
Price: $4750

Consumer Trends in Power Market in Japan Market 2025-2033

Discover the dynamic Japanese power market forecast to 2033, analyzing its 1.27% CAGR, key players (Tokyo Electric Power, Kansai Electric Power, etc.), growth drivers, and regional trends. Explore the shift towards renewables and the challenges impacting this vital sector.

September 2025
Base Year: 2024
No Of Pages: 197
Price: $3800

Air Quality Monitoring Device Market Strategic Insights: Analysis 2025 and Forecasts 2033

The Air Quality Monitoring Device market is booming, projected to reach \$5.08 billion by 2025, with a 5.79% CAGR. Driven by stricter regulations, technological advancements, and growing environmental concerns, this market offers lucrative opportunities across residential, commercial, and industrial sectors. Explore key trends, market segments, and leading companies shaping this dynamic landscape.

September 2025
Base Year: 2024
No Of Pages: 234
Price: $4750

PDC Drill Bits Industry Navigating Dynamics Comprehensive Analysis and Forecasts 2025-2033

The global PDC drill bit market is booming, with a CAGR exceeding 4% and a projected value exceeding $7 billion by 2033. Driven by oil & gas exploration, technological advancements, and unconventional resource development, this market analysis explores key trends, segments (matrix body, steel body, onshore/offshore), and leading companies like Schlumberger and Halliburton.

August 2025
Base Year: 2024
No Of Pages: 234
Price: $4750

South America Pumped Hydro Storage Market Growth Projections: Trends to Watch

Discover the booming South American Pumped Hydro Storage market! This comprehensive analysis reveals a CAGR of 5.40% through 2033, driven by renewable energy growth and government initiatives. Explore market size, segmentation, key players, and challenges in Brazil, Argentina, Colombia, and beyond.

August 2025
Base Year: 2024
No Of Pages: 234
Price: $4750

India Micro Batteries Market 2025 Trends and Forecasts 2033: Analyzing Growth Opportunities

Discover the booming India micro batteries market! Projected to reach $80.64 million by 2033 with a 17.09% CAGR, this report analyzes key drivers, trends, restraints, and leading companies across segments like lithium-ion and automotive applications. Get insights into regional market share and future growth potential.

August 2025
Base Year: 2024
No Of Pages: 180
Price: $3800

South Korea Smart Grid Technology Market Market’s Evolution: Key Growth Drivers 2025-2033

Discover the booming South Korea smart grid technology market! This comprehensive analysis reveals market size, CAGR, key drivers, trends, and restraints, along with insights into leading companies and regional growth projections through 2033. Explore the impact of smart meters, smart grid software, and renewable energy integration on the future of energy in South Korea.

August 2025
Base Year: 2024
No Of Pages: 197
Price: $3800

Middle-East Enhanced Oil Recovery Market Trends and Forecasts: Comprehensive Insights

Discover the booming Middle East Enhanced Oil Recovery (EOR) market! This report analyzes market size, growth (CAGR >6%), key drivers, trends, and regional breakdowns (Saudi Arabia, UAE, etc.), featuring leading companies and innovative techniques like thermal, gas, and chemical injection. Explore the opportunities and challenges in this lucrative sector projected to reach [estimated 2033 market size] by 2033.

August 2025
Base Year: 2024
No Of Pages: 234
Price: $4750

Nuclear Power Reactor Decommissioning Market Growth Forecast and Consumer Insights

The global Nuclear Power Reactor Decommissioning market is booming, with a 13.80% CAGR. Explore market trends, key players (Aecom, Orano, Westinghouse), regional insights, and future projections for this rapidly expanding sector. Learn about the challenges and opportunities in nuclear plant dismantling and waste management.

August 2025
Base Year: 2024
No Of Pages: 234
Price: $4750

Middle East and Africa Compressor Industry Strategic Market Opportunities: Trends 2025-2033

The Middle East & Africa compressor market is booming, projected to surpass $5.25 billion by 2033, driven by oil & gas, manufacturing, and power sectors. Discover key trends, regional insights, and leading companies shaping this dynamic industry.

August 2025
Base Year: 2024
No Of Pages: 234
Price: $4750

Japan Combined Heat and Power Market in Emerging Markets: Analysis and Projections 2025-2033

Discover the booming Japan Combined Heat and Power (CHP) market. This in-depth analysis reveals a CAGR exceeding 3.77%, driven by energy efficiency goals and government initiatives. Explore market size, key players (ABB, Mitsubishi, Siemens), regional trends (Kanto, Kansai), and future projections through 2033.

August 2025
Base Year: 2024
No Of Pages: 197
Price: $3800

UAE Oil and Gas Upstream Market Analysis Report 2025: Market to Grow by a CAGR of XX to 2033, Driven by Government Incentives, Popularity of Virtual Assistants, and Strategic Partnerships

The UAE Oil & Gas Upstream Market is booming, projected to reach $14.26 billion by 2033 with a 5.20% CAGR. This in-depth analysis covers market size, key players (ADNOC, ExxonMobil, Schlumberger), growth drivers, and future trends in onshore and offshore projects. Discover investment opportunities and market insights now.

August 2025
Base Year: 2024
No Of Pages: 197
Price: $3800

Seismic Survey Equipment Market Trends and Forecast 2025-2033

Discover the future of the seismic survey equipment market. This comprehensive analysis reveals a $XX million market poised for 2.80% CAGR growth through 2033, driven by energy exploration, mining, and technological advancements. Explore key trends, regional insights, and leading companies shaping this dynamic industry.

August 2025
Base Year: 2024
No Of Pages: 234
Price: $4750

Navigating Gas Generator Industry Market Trends: Competitor Analysis and Growth 2025-2033

Discover the booming gas generator market forecast to 2033! This comprehensive analysis reveals key drivers, trends, restraints, and regional market shares, including insights into major players like Cummins, Caterpillar, and Generac. Explore the growth opportunities in industrial, commercial, and residential sectors.

August 2025
Base Year: 2024
No Of Pages: 234
Price: $4750

Russia Hydro Power Plants Market Size, Share, and Growth Report: In-Depth Analysis and Forecast to 2033

Discover the booming Russia Hydro Power Plants market, projected to reach $16.25 billion by 2033. Analyze market drivers, trends, and restraints impacting growth, along with key players and regional insights. Explore the potential of hydroelectric power in Russia and its implications for renewable energy.

August 2025
Base Year: 2024
No Of Pages: 197
Price: $3800

Drivers of Change in Indonesia Oil and Gas Midstream Market Market 2025-2033

Discover the booming Indonesia Oil & Gas Midstream Market! Explore market size, growth projections (2025-2033), regional insights, and key drivers fueling this dynamic sector. Learn about investment opportunities and challenges in this crucial energy market.

August 2025
Base Year: 2024
No Of Pages: 197
Price: $3800

Market Projections for Excitation Systems Industry Industry 2025-2033

Discover the booming excitation systems market! Learn about its 4.35%+ CAGR, key drivers (renewable energy, grid modernization), regional trends (North America, Europe, Asia-Pacific), leading companies (ABB, Siemens, GE), and future growth projections to 2033. Explore market segmentation and investment opportunities in this vital sector of the power generation industry.

August 2025
Base Year: 2024
No Of Pages: 234
Price: $4750

Opportunities in Emerging Commercial Aircraft Aviation Fuel Market Industry Markets

The Commercial Aircraft Aviation Fuel market is booming, projected to reach \$220.1 billion by 2025 with a CAGR exceeding 20.86%. Discover key trends driving growth, including the rise of sustainable aviation fuels (SAFs) and the leading players shaping this dynamic industry. Explore regional market shares and future projections for this rapidly expanding sector.

August 2025
Base Year: 2024
No Of Pages: 180
Price: $4750

Strategic Growth Drivers for Myanmar Battery Industry Market

Discover the booming Myanmar battery market! This comprehensive analysis reveals a $50M (2025) industry with a CAGR >1.5%, driven by automotive, industrial, and consumer electronics growth. Explore market trends, key players, and future forecasts for lead-acid and lithium-ion batteries in Myanmar (2019-2033).

August 2025
Base Year: 2024
No Of Pages: 197
Price: $3800

Spain Solar Rooftop Industry Growth Opportunities and Market Forecast 2025-2033: A Strategic Analysis

Discover the booming Spain solar rooftop industry! This in-depth analysis reveals a €37.27B market in 2025, growing at a CAGR exceeding 9.50% through 2033. Learn about key drivers, trends, and leading companies shaping this dynamic sector.

August 2025
Base Year: 2024
No Of Pages: 180
Price: $3800

Technological Advances in Equatorial Guinea Power EPC Market Market: Trends and Opportunities 2025-2033

Discover the booming Equatorial Guinea power EPC market! Projected to reach $71.26 million by 2033 with a CAGR exceeding 4.5%, this report analyzes market drivers, trends, and key players like Wärtsilä and Power Construction Corporation of China. Learn about investment opportunities in this rapidly expanding African energy sector.

August 2025
Base Year: 2024
No Of Pages: 197
Price: $3800

Strategic Growth Drivers for India Transformer Market Market

Discover the booming India Transformer Market! This in-depth analysis reveals a $4.26 billion market in 2025, projected to exceed $6 billion by 2033, driven by infrastructure development and renewable energy adoption. Explore market segments, key players (ABB, CG Power, Siemens), and regional growth trends.

August 2025
Base Year: 2024
No Of Pages: 197
Price: $3800

Future-Ready Strategies for Pumped Hydro Storage Industry Market Growth

The Pumped Hydro Storage (PHS) market is booming, projected to reach $XX million by 2033, driven by renewable energy integration and grid stability needs. Learn about market trends, key players (Siemens, GE, EDF), and regional growth in this comprehensive analysis.

August 2025
Base Year: 2024
No Of Pages: 234
Price: $4750

Brazil Biofuel Market Insightful Analysis: Trends, Competitor Dynamics, and Opportunities 2025-2033

Discover the booming Brazil biofuel market! Our comprehensive analysis reveals a steady CAGR of 3.49% through 2033, driven by government initiatives and growing environmental awareness. Explore key players, market segments (biodiesel, ethanol, feedstocks), and future growth projections for this dynamic sector.

August 2025
Base Year: 2024
No Of Pages: 197
Price: $3800

Japan Uninterrupted Power Supply (UPS) Market Strategic Insights for 2025 and Forecasts to 2033: Market Trends

Discover the booming Japan Uninterrupted Power Supply (UPS) market. This in-depth analysis reveals key growth drivers, market segmentation, leading companies, and regional trends from 2019-2033. Learn about the CAGR, market size, and future projections for this essential technology sector in Japan.

August 2025
Base Year: 2024
No Of Pages: 197
Price: $3800

Exploring Growth Avenues in Denmark Geothermal Energy Market Market

Discover the booming Denmark geothermal energy market forecast to 2033! Explore market size, CAGR, key drivers, restraints, and leading companies. Learn about lithium-ion, flow, and other battery technologies driving growth in EV, energy storage, and consumer electronics sectors.

August 2025
Base Year: 2024
No Of Pages: 197
Price: $3800

Exploring Opportunities in Middle East And Africa Internal Combustion Engines Market Sector

The Middle East & Africa Internal Combustion Engine (ICE) market is booming, projected to reach $76.6 million by 2033 with a 16.30% CAGR. Discover key drivers, trends, and restraints shaping this dynamic market, including regional breakdowns and leading companies. Learn more about ICE engine capacity segments, fuel types (gasoline, diesel), and future projections.

August 2025
Base Year: 2024
No Of Pages: 234
Price: $4750

Europe Turbo Generator Market: Disruptive Technologies Driving Market Growth 2025-2033

The European turbo generator market is booming, with a CAGR exceeding 3.5% through 2033. Driven by rising electricity demand and power infrastructure upgrades, this market is segmented by end-user and type (steam & gas). Key players like Siemens and GE are navigating challenges like environmental regulations to capitalize on this growth. Explore market trends, forecasts, and key players in this detailed analysis.

August 2025
Base Year: 2024
No Of Pages: 234
Price: $4750

Emerging Natural Gas Distribution Market Trends and Opportunities

The global natural gas distribution market is booming, with a CAGR exceeding 3.20% and projected growth to $XXX million by 2033. Driven by rising energy demand and the shift to cleaner fuels, this market analysis explores key trends, challenges, and regional variations, highlighting major players like TC Energy and National Grid. Discover insights on CNG, PNG, and future growth projections.

August 2025
Base Year: 2024
No Of Pages: 234
Price: $4750

Asia-Pacific Steam Turbine Market Market Dynamics and Growth Analysis

The Asia-Pacific steam turbine market is booming, projected to reach $11 billion by 2033, driven by rising energy demands and industrialization. Explore market trends, key players (GE, Siemens, Mitsubishi), and regional breakdowns in this comprehensive analysis. Discover growth opportunities in this dynamic sector.

August 2025
Base Year: 2024
No Of Pages: 234
Price: $4750

Well Testing Services Industry Market’s Consumer Preferences: Trends and Analysis 2025-2033

The Well Testing Services market is booming, with a CAGR exceeding 2.00% and a projected value of $15 Billion+ by 2025. Explore key trends, drivers, restraints, and regional analysis in this comprehensive market report covering major players like Schlumberger and Halliburton. Discover growth opportunities in onshore and offshore exploration and production.

August 2025
Base Year: 2024
No Of Pages: 234
Price: $4750

Decoding North America FLNG Market’s Market Size Potential by 2033

Discover the booming North American Floating LNG (FLNG) market. This in-depth analysis reveals projected growth exceeding 3% CAGR to 2033, driven by offshore gas exploration and energy diversification. Learn about key players, market segmentation (by capacity, propulsion, and deployment), and future trends.

August 2025
Base Year: 2024
No Of Pages: 234
Price: $4750

Strategic Trends in North America Rotor Blade Market Market 2025-2033

The North American rotor blade market is booming, projected to exceed a CAGR of 6% through 2033. Driven by renewable energy adoption and technological advancements, key players like Vestas and Siemens Gamesa are shaping a dynamic landscape of onshore and offshore wind energy. Learn more about market trends, segmentation (carbon fiber, glass fiber), and key growth drivers.

August 2025
Base Year: 2024
No Of Pages: 234
Price: $4750

Strategic Projections for France Electric Vehicles Market Market Expansion

Discover the booming France electric vehicle market! This comprehensive analysis reveals key trends, market size projections (2025-2033), leading players (Tesla, Renault, Volkswagen, etc.), and growth drivers. Explore the segmentations by propulsion, vehicle type, and charging type, and understand the future of electric mobility in France.

August 2025
Base Year: 2024
No Of Pages: 197
Price: $3800

Emerging Markets for Shale Gas Industry Industry

Discover the booming shale gas market! This comprehensive analysis reveals key trends, drivers, and challenges shaping the industry's growth through 2033, with insights into regional market shares, major players (Equinor, Shell, ExxonMobil), and technological advancements in shale gas extraction. Explore the future of shale gas and its impact on the global energy landscape.

August 2025
Base Year: 2024
No Of Pages: 234
Price: $4750

Strategic Roadmap for India Retail Fuel Market Industry

Discover the latest insights on the booming India retail fuel market. This comprehensive analysis reveals market size, CAGR, key drivers, trends, and regional breakdowns, profiling major players like Indian Oil, Reliance Industries, and Shell. Explore growth projections to 2033 and understand the competitive landscape.

August 2025
Base Year: 2024
No Of Pages: 197
Price: $3800

Air Filters Market Market Consumption Trends: Growth Analysis 2025-2033

The global air filter market is booming, driven by rising pollution, IAQ concerns, and stricter regulations. Explore market size, CAGR, key segments (HEPA filters, cartridge filters, etc.), top players (Whirlpool, Daikin, Donaldson), and regional trends (North America, Europe, Asia-Pacific) in this comprehensive analysis projecting growth to 2033.

August 2025
Base Year: 2024
No Of Pages: 234
Price: $4750

Regional Insights into Egypt Oil And Gas Upstream Market Market Growth

Discover the promising future of the Egypt Oil and Gas Upstream Market. This in-depth analysis reveals key growth drivers, market segmentation, and leading companies, projecting substantial growth from 2025-2033. Learn about market size, CAGR, and investment opportunities in Egypt's energy sector.

August 2025
Base Year: 2024
No Of Pages: 197
Price: $3800

Process Gas Compressors Industry Market Demand and Consumption Trends: Outlook 2025-2033

The process gas compressor market is booming, projected to reach $XX million by 2033 with a CAGR of 3.71%. Discover key market drivers, trends, and restraints shaping this dynamic industry, including regional analysis and insights from leading players like Howden Group and Ingersoll Rand. Explore oil-injected vs. oil-free compressors and their applications across diverse sectors.

August 2025
Base Year: 2024
No Of Pages: 234
Price: $4750

South Korea Renewable Energy Industry Projected to Grow at XX CAGR: Insights and Forecasts 2025-2033

South Korea's renewable energy market is booming, with a projected CAGR exceeding 5.5% through 2033. Driven by government initiatives and technological advancements, solar and wind power lead the charge. Learn about market size, key players, and growth projections in this comprehensive analysis.

August 2025
Base Year: 2024
No Of Pages: 197
Price: $3800

Emerging Trends in APAC Floating Production Industry: A Technology Perspective 2025-2033

Discover the booming APAC floating production industry! This in-depth analysis reveals market size, CAGR, key drivers, and trends shaping the future of FPSO, SPAR, and other offshore platforms in Asia-Pacific, with forecasts to 2033. Learn about leading companies and regional market shares.

August 2025
Base Year: 2024
No Of Pages: 234
Price: $4750

Africa Oil Refining Market Projected to Grow at XX CAGR: Insights and Forecasts 2025-2033

The Africa Oil Refining Market, projected at $31.8B in 2025, is booming, driven by rising energy demand & industrialization. Discover key trends, major players (Oryx Energies, Midoil Refining), and regional insights in this comprehensive market analysis forecasting growth to 2033.

August 2025
Base Year: 2024
No Of Pages: 180
Price: $4750

Power Transformer Market in India Navigating Dynamics Comprehensive Analysis and Forecasts 2025-2033

The Indian power transformer market is booming, projected to reach [estimated 2033 market size based on CAGR] by 2033. Driven by renewable energy expansion and infrastructure development, this market offers lucrative opportunities for players like ABB, Siemens, and CG Power. Explore key trends, regional insights, and segment analysis in our comprehensive report.

August 2025
Base Year: 2024
No Of Pages: 197
Price: $3800

Market Deep Dive: Exploring Brazil Combined Heat and Power Market Trends 2025-2033

Discover the booming Brazilian Combined Heat & Power (CHP) market! Learn about its impressive growth (CAGR >2%), key drivers, major players (Cummins, Caterpillar, GE), and future trends in this insightful market analysis covering the period 2019-2033. Explore the potential of natural gas, biomass, and other fuel types across residential, commercial, and industrial sectors.

August 2025
Base Year: 2024
No Of Pages: 197
Price: $3800

Drill Pipe Industry Market Expansion: Growth Outlook 2025-2033

Discover the booming global drill pipe market forecast to 2033! This comprehensive analysis reveals key drivers, trends, restraints, and regional insights, including North America, Europe, Asia-Pacific, and more. Learn about leading companies and explore the growth opportunities within standard, heavy-weight, and drill collar segments.

August 2025
Base Year: 2024
No Of Pages: 234
Price: $4750

SLI Battery Market Industry Growth Trends and Analysis

The global SLI battery market is booming, projected to reach \$50.17 billion by 2033, fueled by automotive growth and technological advancements. Explore key trends, market drivers, leading companies (GS Yuasa, Exide, Clarios), and regional analysis in this comprehensive market report.

August 2025
Base Year: 2024
No Of Pages: 234
Price: $4750

East Africa Petroleum Product Industry Strategic Market Roadmap: Analysis and Forecasts 2025-2033

Discover the booming East African petroleum product market! This in-depth analysis reveals a CAGR exceeding 3.5% driven by industrialization and urbanization, impacting demand for light, middle, and heavy distillates. Learn about key players, regional trends, and growth projections through 2033.

August 2025
Base Year: 2024
No Of Pages: 234
Price: $4750

Market Projections for Indonesia Oilfield Equipment Rental Industry Industry 2025-2033

Discover the booming Indonesian oilfield equipment rental market! This in-depth analysis reveals a market projected to reach significant value by 2033, driven by rising energy demand and technological advancements. Explore market size, growth forecasts, key players, and segment trends.

August 2025
Base Year: 2024
No Of Pages: 197
Price: $3800

Europe AUV and ROV Market Growth Opportunities and Market Forecast 2025-2033: A Strategic Analysis

Discover the booming European AUV & ROV market! This comprehensive analysis reveals key trends, growth drivers, and leading companies in underwater robotics, projecting substantial expansion through 2033. Learn about market segmentation by activity, vehicle type, application (oil & gas, defense), and regional insights.

August 2025
Base Year: 2024
No Of Pages: 234
Price: $4750

Frac Stack Industry Market’s Strategic Roadmap: Insights for 2025-2033

Discover the booming frac stack market analysis and forecast to 2033. Explore key drivers, restraints, and regional trends in this comprehensive report covering onshore, offshore, and various well types. Learn about leading companies and investment opportunities in the hydraulic fracturing industry.

August 2025
Base Year: 2024
No Of Pages: 234
Price: $4750
  • Home
  • About Us
  • Industries
    • Aerospace & Defense
    • Agriculture
    • Animal Nutrition & Wellness
    • Automotive
    • Chemicals & Materials
    • Consumer Goods and Services
    • Energy & Power
    • Financial Services and Investment Intelligence
    • Food & Beverage
    • Home and Property Improvement
    • Hospitality and Tourism
    • Logistics
    • Manufacturing Products and Services
    • Packaging
    • Professional and Commercial Services
    • Real Estate and Construction
    • Retail
    • Technology, Media and Telecom
    • Healthcare
  • Services
  • Contact
Main Logo
  • Home
  • About Us
  • Industries
    • Aerospace & Defense
    • Agriculture
    • Animal Nutrition & Wellness
    • Automotive
    • Chemicals & Materials
    • Consumer Goods and Services
    • Energy & Power
    • Financial Services and Investment Intelligence
    • Food & Beverage
    • Home and Property Improvement
    • Hospitality and Tourism
    • Logistics
    • Manufacturing Products and Services
    • Packaging
    • Professional and Commercial Services
    • Real Estate and Construction
    • Retail
    • Technology, Media and Telecom
    • Healthcare
  • Services
  • Contact
+17162654855
[email protected]

+17162654855

[email protected]

Business Address

Head Office

Ansec House 3 rd floor Tank Road, Yerwada, Pune, Maharashtra 411014

Contact Information

Craig Francis

Business Development Head

+17162654855

[email protected]

Secure Payment Partners

payment image
RetailLogisticsPackagingAutomotiveHealthcareAgricultureEnergy & PowerFood & BeverageAerospace & DefenseChemicals & MaterialsHospitality and TourismAnimal Nutrition & WellnessConsumer Goods and ServicesReal Estate and ConstructionHome and Property ImprovementTechnology, Media and TelecomManufacturing Products and ServicesFinancial Services and Investment Intelligence

© 2025 PRDUA Research & Media Private Limited, All rights reserved

Privacy Policy
Terms and Conditions
FAQ