

Key Insights
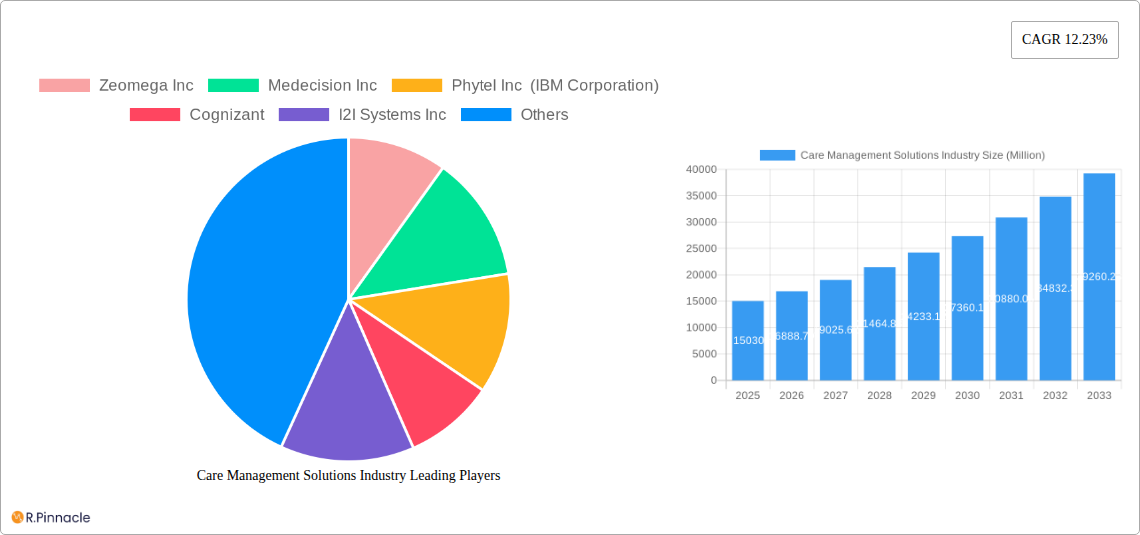
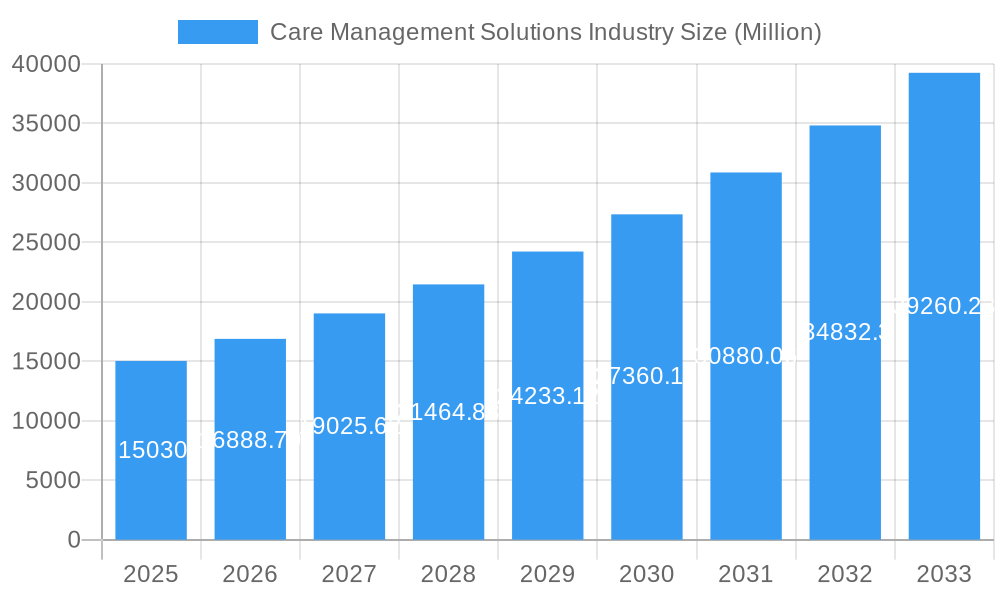
The global Care Management Solutions market, valued at $15.03 billion in 2025, is poised for significant growth, exhibiting a Compound Annual Growth Rate (CAGR) of 12.23% from 2025 to 2033. This robust expansion is fueled by several key drivers. The increasing prevalence of chronic diseases, coupled with the rising demand for efficient and cost-effective healthcare delivery, is significantly boosting market adoption. Technological advancements, particularly in cloud-based and web-based solutions, are enhancing accessibility and improving the overall efficiency of care management programs. Furthermore, the growing emphasis on value-based care models and the increasing adoption of telehealth are further contributing to market growth. Key market segments include Chronic Care Management, Disease Management, and Utilization Management applications, served by a diverse range of players, including established healthcare IT companies and specialized care management solution providers. The market's growth is further segmented by end-users (healthcare payers, providers, and other end-users), components (software and services), and delivery modes (cloud-based, web-based, and on-premise).
Care Management Solutions Industry Market Size (In Billion)
North America currently holds a dominant market share, driven by advanced healthcare infrastructure and high adoption rates of innovative technologies. However, the Asia-Pacific region is anticipated to witness substantial growth over the forecast period, propelled by rising healthcare expenditure, expanding internet penetration, and increasing awareness of advanced care management solutions. While market expansion is strong, potential restraints include data privacy concerns, the high cost of implementation and integration, and the need for skilled professionals to effectively manage these systems. Overcoming these challenges will require collaborative efforts between technology providers, healthcare payers, providers, and policymakers to ensure seamless integration and widespread adoption of care management solutions, leading to improved patient outcomes and a more efficient healthcare system.
Care Management Solutions Industry Company Market Share
Care Management Solutions Industry Report: 2019-2033
This comprehensive report provides a detailed analysis of the Care Management Solutions industry, projecting a market valuation exceeding $XX Million by 2033. Designed for industry professionals, investors, and strategic planners, this report offers actionable insights into market dynamics, competitive landscapes, and future growth opportunities. The study period spans 2019-2033, with 2025 serving as the base and estimated year. The forecast period covers 2025-2033, and the historical period encompasses 2019-2024.
Care Management Solutions Industry Market Structure & Innovation Trends
The Care Management Solutions market exhibits a moderately concentrated structure, with key players like Optum Inc, IBM Corporation (Phytel Inc), and Cognizant holding significant market share. However, numerous smaller companies and specialized providers contribute to a dynamic competitive landscape. Market share fluctuates based on technological advancements, successful product launches, and strategic mergers and acquisitions (M&A). Recent M&A activity, valued at approximately $XX Million in the last three years, signifies consolidation within the industry. Innovation is driven by the increasing need for remote patient monitoring, improved chronic disease management, and the growing adoption of telehealth solutions. Regulatory frameworks, such as HIPAA compliance and data privacy regulations, significantly impact the industry, shaping product development and market access. Substitutes for care management solutions exist but often lack the integrated capabilities and comprehensive data analytics offered by established providers. End-user demographics are shifting towards an older, more technology-savvy population, driving demand for user-friendly, accessible solutions.
Care Management Solutions Industry Market Dynamics & Trends
The Care Management Solutions market is experiencing robust growth, projected to achieve a Compound Annual Growth Rate (CAGR) of XX% during the forecast period (2025-2033). Key growth drivers include the rising prevalence of chronic diseases, increasing healthcare costs, and the expanding adoption of value-based care models. Technological advancements, such as Artificial Intelligence (AI) and machine learning, are transforming care management capabilities, leading to more personalized and efficient interventions. Consumer preferences are shifting towards convenient, remote-access solutions that integrate seamlessly with existing healthcare systems. The competitive landscape is characterized by intense rivalry among established players and emerging startups, leading to continuous innovation and pricing pressures. Market penetration is steadily increasing across various segments, driven by improved awareness of care management benefits and wider healthcare system adoption.
Dominant Regions & Segments in Care Management Solutions Industry
Leading Region: North America currently dominates the market, driven by advanced healthcare infrastructure, high technological adoption, and favorable regulatory environments. Europe follows, showing significant growth potential.
Leading Segment (By Application): Chronic Care Management commands the largest market share due to the high prevalence of chronic conditions and the significant cost savings associated with effective management.
Leading Segment (By End User): Healthcare Payers are major adopters, leveraging care management solutions to improve patient outcomes and reduce overall healthcare expenditures.
Leading Segment (By Component): Software solutions comprise the largest segment, providing the core functionality for care management programs.
Leading Segment (By Delivery Mode): Cloud-based and web-based solutions are gaining traction due to their scalability, accessibility, and cost-effectiveness.
The dominance of North America is attributed to a robust healthcare ecosystem, high levels of digital literacy and technological investment, alongside government incentives for telehealth adoption. Europe's growth is propelled by increasing healthcare spending, coupled with initiatives to improve healthcare access and quality. The Chronic Care Management segment's leading position reflects the substantial costs associated with managing chronic illnesses and the potential for significant cost savings through proactive interventions. Healthcare Payers' preference for software solutions is driven by the desire to leverage data-driven insights for improved risk management and personalized care plans. Finally, the dominance of cloud-based and web-based solutions underscores the growing trend of remote monitoring and accessibility.
Care Management Solutions Industry Product Innovations
Recent product developments focus on leveraging AI, machine learning, and telehealth technologies to enhance remote patient monitoring, personalized care plans, and predictive analytics. New applications include sophisticated social determinants of health (SDOH) assessments and integrated care coordination platforms. Competitive advantages are increasingly driven by data security and privacy features, user experience improvements, and seamless integration with existing healthcare systems. These innovations are enhancing the value proposition for healthcare providers and payers, leading to improved patient outcomes, increased efficiency, and reduced healthcare costs.
Report Scope & Segmentation Analysis
This report comprehensively analyzes the Care Management Solutions market across various segments:
By Application: Chronic Care Management, Disease Management, Utilization Management. Each segment displays unique growth projections, market sizes, and competitive dynamics, shaped by specific clinical needs and technological capabilities.
By End User: Healthcare Payers, Healthcare Providers, Other End Users (e.g., employers). The market size and growth rates vary significantly depending on the end user's strategic priorities, budgetary constraints, and technological infrastructure.
By Component: Software, Services. Software is a key driver, offering core functionality, while services encompass implementation, training, and support, impacting overall market value.
By Delivery Mode: Cloud-based and Web-based, On-premise. Cloud solutions dominate due to scalability and cost-effectiveness.
Each segment's growth is influenced by factors specific to its application, end-user needs, and delivery mode. The report offers detailed insights into market size, competitive landscapes, and growth trajectories for each segment.
Key Drivers of Care Management Solutions Industry Growth
Several factors fuel the Care Management Solutions industry's growth:
Technological Advancements: AI, machine learning, and IoT-enabled devices enable remote patient monitoring and personalized interventions.
Rising Prevalence of Chronic Diseases: The increasing burden of chronic conditions necessitates effective management strategies.
Shift to Value-Based Care: Providers and payers are incentivized to improve patient outcomes and reduce costs, driving adoption.
Government Initiatives and Regulations: Policies promoting telehealth and digital health further enhance market growth.
These factors collectively contribute to the significant expansion of the Care Management Solutions market.
Challenges in the Care Management Solutions Industry Sector
Significant challenges hinder growth:
Data Security and Privacy Concerns: Protecting sensitive patient data is crucial, necessitating robust security measures.
Interoperability Issues: Seamless data exchange between systems remains a challenge, impacting efficiency.
High Implementation Costs: Implementing complex systems can be expensive, particularly for smaller providers.
Resistance to Change: Adopting new technologies and workflows requires overcoming inherent resistance within healthcare organizations. These factors can impact market adoption rates and overall industry growth.
Emerging Opportunities in Care Management Solutions Industry
The industry presents lucrative opportunities:
Expansion into Emerging Markets: Untapped potential exists in developing countries with growing healthcare needs.
Integration of Wearable Technology: Integrating data from wearables can enhance remote patient monitoring and personalized care.
Focus on SDOH: Addressing social determinants of health can improve patient outcomes and reduce healthcare disparities.
Development of AI-powered Predictive Analytics: Predictive analytics can help identify patients at risk and facilitate proactive interventions.
Leading Players in the Care Management Solutions Industry Market
- Zeomega Inc
- Medecision Inc
- Phytel Inc (IBM Corporation)
- Cognizant
- I2I Systems Inc
- Centene Corporation (Evolve)
- Veradigm
- InfoMC
- Infosys Limited
- Convey Health Solutions
- Optum Inc
- EPIC Corporation Inc
- Exl Healthcare
- Hinduja Global Solutions Limited
Key Developments in Care Management Solutions Industry
April 2023: Medecision launched Aerial Social Care Coordinator, enhancing SDOH assessment capabilities. This launch reflects a market trend towards more holistic care management approaches.
March 2023: Royal Philips introduced Philips Virtual Care Management, offering a comprehensive suite of remote patient monitoring and engagement tools. This indicates a market push towards scalable and accessible solutions.
Future Outlook for Care Management Solutions Industry Market
The Care Management Solutions market is poised for sustained growth, driven by technological advancements, expanding telehealth adoption, and the increasing focus on value-based care. Strategic opportunities exist for companies that can effectively integrate AI, machine learning, and data analytics to deliver personalized and efficient care management solutions. The market's future is bright, with substantial potential for innovation and expansion across various segments and geographies.
Care Management Solutions Industry Segmentation
-
1. Component
- 1.1. Software
- 1.2. Services
-
2. Delivery Mode
- 2.1. Cloud-based and Web-based
- 2.2. On-premise
-
3. Application
- 3.1. Chronic Care Management
- 3.2. Disease Management
- 3.3. Utilization Management
-
4. End User
- 4.1. Healthcare Payers
- 4.2. Healthcare Providers
- 4.3. Other End Users
Care Management Solutions Industry Segmentation By Geography
-
1. North America
- 1.1. United States
- 1.2. Canada
- 1.3. Mexico
-
2. Europe
- 2.1. Germany
- 2.2. United Kindom
- 2.3. France
- 2.4. Italy
- 2.5. Spain
- 2.6. Rest of Europe
-
3. Asia Pacific
- 3.1. China
- 3.2. Japan
- 3.3. India
- 3.4. Australia
- 3.5. South Korea
- 3.6. Rest of Asia Pacific
- 4. Middle East
-
5. GCC
- 5.1. South Africa
- 5.2. Rest of Middle East and Africa
-
6. South America
- 6.1. Brazil
- 6.2. Argentina
- 6.3. Rest of South America
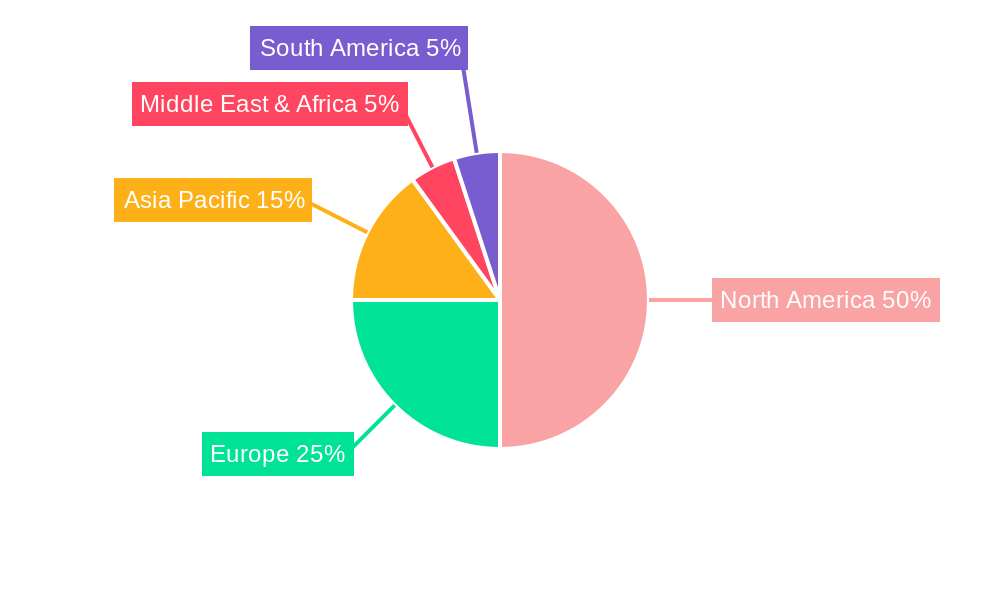
Care Management Solutions Industry Regional Market Share
Geographic Coverage of Care Management Solutions Industry
Care Management Solutions Industry REPORT HIGHLIGHTS
| Aspects | Details |
|---|---|
| Study Period | 2020-2034 |
| Base Year | 2025 |
| Estimated Year | 2026 |
| Forecast Period | 2026-2034 |
| Historical Period | 2020-2025 |
| Growth Rate | CAGR of 12.23% from 2020-2034 |
| Segmentation |
|
Table of Contents
- 1. Introduction
- 1.1. Research Scope
- 1.2. Market Segmentation
- 1.3. Research Objective
- 1.4. Definitions and Assumptions
- 2. Executive Summary
- 2.1. Market Snapshot
- 3. Market Dynamics
- 3.1. Market Drivers
- 3.2. Market Restrains
- 3.3. Market Trends
- 3.4. Market Opportunities
- 4. Market Factor Analysis
- 4.1. Porters Five Forces
- 4.1.1. Bargaining Power of Suppliers
- 4.1.2. Bargaining Power of Buyers
- 4.1.3. Threat of New Entrants
- 4.1.4. Threat of Substitutes
- 4.1.5. Competitive Rivalry
- 4.2. PESTEL analysis
- 4.3. BCG Analysis
- 4.3.1. Stars (High Growth, High Market Share)
- 4.3.2. Cash Cows (Low Growth, High Market Share)
- 4.3.3. Question Mark (High Growth, Low Market Share)
- 4.3.4. Dogs (Low Growth, Low Market Share)
- 4.4. Ansoff Matrix Analysis
- 4.5. Supply Chain Analysis
- 4.6. Regulatory Landscape
- 4.7. Current Market Potential and Opportunity Assessment (TAM–SAM–SOM Framework)
- 4.8. PRI Analyst Note
- 4.1. Porters Five Forces
- 5. Market Analysis, Insights and Forecast 2021-2033
- 5.1. Market Analysis, Insights and Forecast - by Component
- 5.1.1. Software
- 5.1.2. Services
- 5.2. Market Analysis, Insights and Forecast - by Delivery Mode
- 5.2.1. Cloud-based and Web-based
- 5.2.2. On-premise
- 5.3. Market Analysis, Insights and Forecast - by Application
- 5.3.1. Chronic Care Management
- 5.3.2. Disease Management
- 5.3.3. Utilization Management
- 5.4. Market Analysis, Insights and Forecast - by End User
- 5.4.1. Healthcare Payers
- 5.4.2. Healthcare Providers
- 5.4.3. Other End Users
- 5.5. Market Analysis, Insights and Forecast - by Region
- 5.5.1. North America
- 5.5.2. Europe
- 5.5.3. Asia Pacific
- 5.5.4. Middle East
- 5.5.5. GCC
- 5.5.6. South America
- 5.1. Market Analysis, Insights and Forecast - by Component
- 6. Global Care Management Solutions Industry Analysis, Insights and Forecast, 2021-2033
- 6.1. Market Analysis, Insights and Forecast - by Component
- 6.1.1. Software
- 6.1.2. Services
- 6.2. Market Analysis, Insights and Forecast - by Delivery Mode
- 6.2.1. Cloud-based and Web-based
- 6.2.2. On-premise
- 6.3. Market Analysis, Insights and Forecast - by Application
- 6.3.1. Chronic Care Management
- 6.3.2. Disease Management
- 6.3.3. Utilization Management
- 6.4. Market Analysis, Insights and Forecast - by End User
- 6.4.1. Healthcare Payers
- 6.4.2. Healthcare Providers
- 6.4.3. Other End Users
- 6.1. Market Analysis, Insights and Forecast - by Component
- 7. North America Care Management Solutions Industry Analysis, Insights and Forecast, 2020-2032
- 7.1. Market Analysis, Insights and Forecast - by Component
- 7.1.1. Software
- 7.1.2. Services
- 7.2. Market Analysis, Insights and Forecast - by Delivery Mode
- 7.2.1. Cloud-based and Web-based
- 7.2.2. On-premise
- 7.3. Market Analysis, Insights and Forecast - by Application
- 7.3.1. Chronic Care Management
- 7.3.2. Disease Management
- 7.3.3. Utilization Management
- 7.4. Market Analysis, Insights and Forecast - by End User
- 7.4.1. Healthcare Payers
- 7.4.2. Healthcare Providers
- 7.4.3. Other End Users
- 7.1. Market Analysis, Insights and Forecast - by Component
- 8. Europe Care Management Solutions Industry Analysis, Insights and Forecast, 2020-2032
- 8.1. Market Analysis, Insights and Forecast - by Component
- 8.1.1. Software
- 8.1.2. Services
- 8.2. Market Analysis, Insights and Forecast - by Delivery Mode
- 8.2.1. Cloud-based and Web-based
- 8.2.2. On-premise
- 8.3. Market Analysis, Insights and Forecast - by Application
- 8.3.1. Chronic Care Management
- 8.3.2. Disease Management
- 8.3.3. Utilization Management
- 8.4. Market Analysis, Insights and Forecast - by End User
- 8.4.1. Healthcare Payers
- 8.4.2. Healthcare Providers
- 8.4.3. Other End Users
- 8.1. Market Analysis, Insights and Forecast - by Component
- 9. Asia Pacific Care Management Solutions Industry Analysis, Insights and Forecast, 2020-2032
- 9.1. Market Analysis, Insights and Forecast - by Component
- 9.1.1. Software
- 9.1.2. Services
- 9.2. Market Analysis, Insights and Forecast - by Delivery Mode
- 9.2.1. Cloud-based and Web-based
- 9.2.2. On-premise
- 9.3. Market Analysis, Insights and Forecast - by Application
- 9.3.1. Chronic Care Management
- 9.3.2. Disease Management
- 9.3.3. Utilization Management
- 9.4. Market Analysis, Insights and Forecast - by End User
- 9.4.1. Healthcare Payers
- 9.4.2. Healthcare Providers
- 9.4.3. Other End Users
- 9.1. Market Analysis, Insights and Forecast - by Component
- 10. Middle East Care Management Solutions Industry Analysis, Insights and Forecast, 2020-2032
- 10.1. Market Analysis, Insights and Forecast - by Component
- 10.1.1. Software
- 10.1.2. Services
- 10.2. Market Analysis, Insights and Forecast - by Delivery Mode
- 10.2.1. Cloud-based and Web-based
- 10.2.2. On-premise
- 10.3. Market Analysis, Insights and Forecast - by Application
- 10.3.1. Chronic Care Management
- 10.3.2. Disease Management
- 10.3.3. Utilization Management
- 10.4. Market Analysis, Insights and Forecast - by End User
- 10.4.1. Healthcare Payers
- 10.4.2. Healthcare Providers
- 10.4.3. Other End Users
- 10.1. Market Analysis, Insights and Forecast - by Component
- 11. GCC Care Management Solutions Industry Analysis, Insights and Forecast, 2020-2032
- 11.1. Market Analysis, Insights and Forecast - by Component
- 11.1.1. Software
- 11.1.2. Services
- 11.2. Market Analysis, Insights and Forecast - by Delivery Mode
- 11.2.1. Cloud-based and Web-based
- 11.2.2. On-premise
- 11.3. Market Analysis, Insights and Forecast - by Application
- 11.3.1. Chronic Care Management
- 11.3.2. Disease Management
- 11.3.3. Utilization Management
- 11.4. Market Analysis, Insights and Forecast - by End User
- 11.4.1. Healthcare Payers
- 11.4.2. Healthcare Providers
- 11.4.3. Other End Users
- 11.1. Market Analysis, Insights and Forecast - by Component
- 12. South America Care Management Solutions Industry Analysis, Insights and Forecast, 2020-2032
- 12.1. Market Analysis, Insights and Forecast - by Component
- 12.1.1. Software
- 12.1.2. Services
- 12.2. Market Analysis, Insights and Forecast - by Delivery Mode
- 12.2.1. Cloud-based and Web-based
- 12.2.2. On-premise
- 12.3. Market Analysis, Insights and Forecast - by Application
- 12.3.1. Chronic Care Management
- 12.3.2. Disease Management
- 12.3.3. Utilization Management
- 12.4. Market Analysis, Insights and Forecast - by End User
- 12.4.1. Healthcare Payers
- 12.4.2. Healthcare Providers
- 12.4.3. Other End Users
- 12.1. Market Analysis, Insights and Forecast - by Component
- 13. Competitive Analysis
- 13.1. Company Profiles
- 13.1.1 Zeomega Inc
- 13.1.1.1. Company Overview
- 13.1.1.2. Products
- 13.1.1.3. Company Financials
- 13.1.1.4. SWOT Analysis
- 13.1.2 Medecision Inc
- 13.1.2.1. Company Overview
- 13.1.2.2. Products
- 13.1.2.3. Company Financials
- 13.1.2.4. SWOT Analysis
- 13.1.3 Phytel Inc (IBM Corporation)
- 13.1.3.1. Company Overview
- 13.1.3.2. Products
- 13.1.3.3. Company Financials
- 13.1.3.4. SWOT Analysis
- 13.1.4 Cognizant
- 13.1.4.1. Company Overview
- 13.1.4.2. Products
- 13.1.4.3. Company Financials
- 13.1.4.4. SWOT Analysis
- 13.1.5 I2I Systems Inc
- 13.1.5.1. Company Overview
- 13.1.5.2. Products
- 13.1.5.3. Company Financials
- 13.1.5.4. SWOT Analysis
- 13.1.6 Centene Corporation (Evolve)
- 13.1.6.1. Company Overview
- 13.1.6.2. Products
- 13.1.6.3. Company Financials
- 13.1.6.4. SWOT Analysis
- 13.1.7 Veradigm
- 13.1.7.1. Company Overview
- 13.1.7.2. Products
- 13.1.7.3. Company Financials
- 13.1.7.4. SWOT Analysis
- 13.1.8 InfoMC
- 13.1.8.1. Company Overview
- 13.1.8.2. Products
- 13.1.8.3. Company Financials
- 13.1.8.4. SWOT Analysis
- 13.1.9 Infosys Limited
- 13.1.9.1. Company Overview
- 13.1.9.2. Products
- 13.1.9.3. Company Financials
- 13.1.9.4. SWOT Analysis
- 13.1.10 Convey Health Solutions
- 13.1.10.1. Company Overview
- 13.1.10.2. Products
- 13.1.10.3. Company Financials
- 13.1.10.4. SWOT Analysis
- 13.1.11 Optum Inc
- 13.1.11.1. Company Overview
- 13.1.11.2. Products
- 13.1.11.3. Company Financials
- 13.1.11.4. SWOT Analysis
- 13.1.12 EPIC Corporation Inc
- 13.1.12.1. Company Overview
- 13.1.12.2. Products
- 13.1.12.3. Company Financials
- 13.1.12.4. SWOT Analysis
- 13.1.13 Exl Healthcare
- 13.1.13.1. Company Overview
- 13.1.13.2. Products
- 13.1.13.3. Company Financials
- 13.1.13.4. SWOT Analysis
- 13.1.14 Hinduja Global Solutions Limited
- 13.1.14.1. Company Overview
- 13.1.14.2. Products
- 13.1.14.3. Company Financials
- 13.1.14.4. SWOT Analysis
- 13.1.1 Zeomega Inc
- 13.2. Market Entropy
- 13.2.1 Company's Key Areas Served
- 13.2.2 Recent Developments
- 13.3. Company Market Share Analysis 2025
- 13.3.1 Top 5 Companies Market Share Analysis
- 13.3.2 Top 3 Companies Market Share Analysis
- 13.4. List of Potential Customers
- 14. Research Methodology
List of Figures
- Figure 1: Global Care Management Solutions Industry Revenue Breakdown (Million, %) by Region 2025 & 2033
- Figure 2: Global Care Management Solutions Industry Volume Breakdown (K Unit, %) by Region 2025 & 2033
- Figure 3: North America Care Management Solutions Industry Revenue (Million), by Component 2025 & 2033
- Figure 4: North America Care Management Solutions Industry Volume (K Unit), by Component 2025 & 2033
- Figure 5: North America Care Management Solutions Industry Revenue Share (%), by Component 2025 & 2033
- Figure 6: North America Care Management Solutions Industry Volume Share (%), by Component 2025 & 2033
- Figure 7: North America Care Management Solutions Industry Revenue (Million), by Delivery Mode 2025 & 2033
- Figure 8: North America Care Management Solutions Industry Volume (K Unit), by Delivery Mode 2025 & 2033
- Figure 9: North America Care Management Solutions Industry Revenue Share (%), by Delivery Mode 2025 & 2033
- Figure 10: North America Care Management Solutions Industry Volume Share (%), by Delivery Mode 2025 & 2033
- Figure 11: North America Care Management Solutions Industry Revenue (Million), by Application 2025 & 2033
- Figure 12: North America Care Management Solutions Industry Volume (K Unit), by Application 2025 & 2033
- Figure 13: North America Care Management Solutions Industry Revenue Share (%), by Application 2025 & 2033
- Figure 14: North America Care Management Solutions Industry Volume Share (%), by Application 2025 & 2033
- Figure 15: North America Care Management Solutions Industry Revenue (Million), by End User 2025 & 2033
- Figure 16: North America Care Management Solutions Industry Volume (K Unit), by End User 2025 & 2033
- Figure 17: North America Care Management Solutions Industry Revenue Share (%), by End User 2025 & 2033
- Figure 18: North America Care Management Solutions Industry Volume Share (%), by End User 2025 & 2033
- Figure 19: North America Care Management Solutions Industry Revenue (Million), by Country 2025 & 2033
- Figure 20: North America Care Management Solutions Industry Volume (K Unit), by Country 2025 & 2033
- Figure 21: North America Care Management Solutions Industry Revenue Share (%), by Country 2025 & 2033
- Figure 22: North America Care Management Solutions Industry Volume Share (%), by Country 2025 & 2033
- Figure 23: Europe Care Management Solutions Industry Revenue (Million), by Component 2025 & 2033
- Figure 24: Europe Care Management Solutions Industry Volume (K Unit), by Component 2025 & 2033
- Figure 25: Europe Care Management Solutions Industry Revenue Share (%), by Component 2025 & 2033
- Figure 26: Europe Care Management Solutions Industry Volume Share (%), by Component 2025 & 2033
- Figure 27: Europe Care Management Solutions Industry Revenue (Million), by Delivery Mode 2025 & 2033
- Figure 28: Europe Care Management Solutions Industry Volume (K Unit), by Delivery Mode 2025 & 2033
- Figure 29: Europe Care Management Solutions Industry Revenue Share (%), by Delivery Mode 2025 & 2033
- Figure 30: Europe Care Management Solutions Industry Volume Share (%), by Delivery Mode 2025 & 2033
- Figure 31: Europe Care Management Solutions Industry Revenue (Million), by Application 2025 & 2033
- Figure 32: Europe Care Management Solutions Industry Volume (K Unit), by Application 2025 & 2033
- Figure 33: Europe Care Management Solutions Industry Revenue Share (%), by Application 2025 & 2033
- Figure 34: Europe Care Management Solutions Industry Volume Share (%), by Application 2025 & 2033
- Figure 35: Europe Care Management Solutions Industry Revenue (Million), by End User 2025 & 2033
- Figure 36: Europe Care Management Solutions Industry Volume (K Unit), by End User 2025 & 2033
- Figure 37: Europe Care Management Solutions Industry Revenue Share (%), by End User 2025 & 2033
- Figure 38: Europe Care Management Solutions Industry Volume Share (%), by End User 2025 & 2033
- Figure 39: Europe Care Management Solutions Industry Revenue (Million), by Country 2025 & 2033
- Figure 40: Europe Care Management Solutions Industry Volume (K Unit), by Country 2025 & 2033
- Figure 41: Europe Care Management Solutions Industry Revenue Share (%), by Country 2025 & 2033
- Figure 42: Europe Care Management Solutions Industry Volume Share (%), by Country 2025 & 2033
- Figure 43: Asia Pacific Care Management Solutions Industry Revenue (Million), by Component 2025 & 2033
- Figure 44: Asia Pacific Care Management Solutions Industry Volume (K Unit), by Component 2025 & 2033
- Figure 45: Asia Pacific Care Management Solutions Industry Revenue Share (%), by Component 2025 & 2033
- Figure 46: Asia Pacific Care Management Solutions Industry Volume Share (%), by Component 2025 & 2033
- Figure 47: Asia Pacific Care Management Solutions Industry Revenue (Million), by Delivery Mode 2025 & 2033
- Figure 48: Asia Pacific Care Management Solutions Industry Volume (K Unit), by Delivery Mode 2025 & 2033
- Figure 49: Asia Pacific Care Management Solutions Industry Revenue Share (%), by Delivery Mode 2025 & 2033
- Figure 50: Asia Pacific Care Management Solutions Industry Volume Share (%), by Delivery Mode 2025 & 2033
- Figure 51: Asia Pacific Care Management Solutions Industry Revenue (Million), by Application 2025 & 2033
- Figure 52: Asia Pacific Care Management Solutions Industry Volume (K Unit), by Application 2025 & 2033
- Figure 53: Asia Pacific Care Management Solutions Industry Revenue Share (%), by Application 2025 & 2033
- Figure 54: Asia Pacific Care Management Solutions Industry Volume Share (%), by Application 2025 & 2033
- Figure 55: Asia Pacific Care Management Solutions Industry Revenue (Million), by End User 2025 & 2033
- Figure 56: Asia Pacific Care Management Solutions Industry Volume (K Unit), by End User 2025 & 2033
- Figure 57: Asia Pacific Care Management Solutions Industry Revenue Share (%), by End User 2025 & 2033
- Figure 58: Asia Pacific Care Management Solutions Industry Volume Share (%), by End User 2025 & 2033
- Figure 59: Asia Pacific Care Management Solutions Industry Revenue (Million), by Country 2025 & 2033
- Figure 60: Asia Pacific Care Management Solutions Industry Volume (K Unit), by Country 2025 & 2033
- Figure 61: Asia Pacific Care Management Solutions Industry Revenue Share (%), by Country 2025 & 2033
- Figure 62: Asia Pacific Care Management Solutions Industry Volume Share (%), by Country 2025 & 2033
- Figure 63: Middle East Care Management Solutions Industry Revenue (Million), by Component 2025 & 2033
- Figure 64: Middle East Care Management Solutions Industry Volume (K Unit), by Component 2025 & 2033
- Figure 65: Middle East Care Management Solutions Industry Revenue Share (%), by Component 2025 & 2033
- Figure 66: Middle East Care Management Solutions Industry Volume Share (%), by Component 2025 & 2033
- Figure 67: Middle East Care Management Solutions Industry Revenue (Million), by Delivery Mode 2025 & 2033
- Figure 68: Middle East Care Management Solutions Industry Volume (K Unit), by Delivery Mode 2025 & 2033
- Figure 69: Middle East Care Management Solutions Industry Revenue Share (%), by Delivery Mode 2025 & 2033
- Figure 70: Middle East Care Management Solutions Industry Volume Share (%), by Delivery Mode 2025 & 2033
- Figure 71: Middle East Care Management Solutions Industry Revenue (Million), by Application 2025 & 2033
- Figure 72: Middle East Care Management Solutions Industry Volume (K Unit), by Application 2025 & 2033
- Figure 73: Middle East Care Management Solutions Industry Revenue Share (%), by Application 2025 & 2033
- Figure 74: Middle East Care Management Solutions Industry Volume Share (%), by Application 2025 & 2033
- Figure 75: Middle East Care Management Solutions Industry Revenue (Million), by End User 2025 & 2033
- Figure 76: Middle East Care Management Solutions Industry Volume (K Unit), by End User 2025 & 2033
- Figure 77: Middle East Care Management Solutions Industry Revenue Share (%), by End User 2025 & 2033
- Figure 78: Middle East Care Management Solutions Industry Volume Share (%), by End User 2025 & 2033
- Figure 79: Middle East Care Management Solutions Industry Revenue (Million), by Country 2025 & 2033
- Figure 80: Middle East Care Management Solutions Industry Volume (K Unit), by Country 2025 & 2033
- Figure 81: Middle East Care Management Solutions Industry Revenue Share (%), by Country 2025 & 2033
- Figure 82: Middle East Care Management Solutions Industry Volume Share (%), by Country 2025 & 2033
- Figure 83: GCC Care Management Solutions Industry Revenue (Million), by Component 2025 & 2033
- Figure 84: GCC Care Management Solutions Industry Volume (K Unit), by Component 2025 & 2033
- Figure 85: GCC Care Management Solutions Industry Revenue Share (%), by Component 2025 & 2033
- Figure 86: GCC Care Management Solutions Industry Volume Share (%), by Component 2025 & 2033
- Figure 87: GCC Care Management Solutions Industry Revenue (Million), by Delivery Mode 2025 & 2033
- Figure 88: GCC Care Management Solutions Industry Volume (K Unit), by Delivery Mode 2025 & 2033
- Figure 89: GCC Care Management Solutions Industry Revenue Share (%), by Delivery Mode 2025 & 2033
- Figure 90: GCC Care Management Solutions Industry Volume Share (%), by Delivery Mode 2025 & 2033
- Figure 91: GCC Care Management Solutions Industry Revenue (Million), by Application 2025 & 2033
- Figure 92: GCC Care Management Solutions Industry Volume (K Unit), by Application 2025 & 2033
- Figure 93: GCC Care Management Solutions Industry Revenue Share (%), by Application 2025 & 2033
- Figure 94: GCC Care Management Solutions Industry Volume Share (%), by Application 2025 & 2033
- Figure 95: GCC Care Management Solutions Industry Revenue (Million), by End User 2025 & 2033
- Figure 96: GCC Care Management Solutions Industry Volume (K Unit), by End User 2025 & 2033
- Figure 97: GCC Care Management Solutions Industry Revenue Share (%), by End User 2025 & 2033
- Figure 98: GCC Care Management Solutions Industry Volume Share (%), by End User 2025 & 2033
- Figure 99: GCC Care Management Solutions Industry Revenue (Million), by Country 2025 & 2033
- Figure 100: GCC Care Management Solutions Industry Volume (K Unit), by Country 2025 & 2033
- Figure 101: GCC Care Management Solutions Industry Revenue Share (%), by Country 2025 & 2033
- Figure 102: GCC Care Management Solutions Industry Volume Share (%), by Country 2025 & 2033
- Figure 103: South America Care Management Solutions Industry Revenue (Million), by Component 2025 & 2033
- Figure 104: South America Care Management Solutions Industry Volume (K Unit), by Component 2025 & 2033
- Figure 105: South America Care Management Solutions Industry Revenue Share (%), by Component 2025 & 2033
- Figure 106: South America Care Management Solutions Industry Volume Share (%), by Component 2025 & 2033
- Figure 107: South America Care Management Solutions Industry Revenue (Million), by Delivery Mode 2025 & 2033
- Figure 108: South America Care Management Solutions Industry Volume (K Unit), by Delivery Mode 2025 & 2033
- Figure 109: South America Care Management Solutions Industry Revenue Share (%), by Delivery Mode 2025 & 2033
- Figure 110: South America Care Management Solutions Industry Volume Share (%), by Delivery Mode 2025 & 2033
- Figure 111: South America Care Management Solutions Industry Revenue (Million), by Application 2025 & 2033
- Figure 112: South America Care Management Solutions Industry Volume (K Unit), by Application 2025 & 2033
- Figure 113: South America Care Management Solutions Industry Revenue Share (%), by Application 2025 & 2033
- Figure 114: South America Care Management Solutions Industry Volume Share (%), by Application 2025 & 2033
- Figure 115: South America Care Management Solutions Industry Revenue (Million), by End User 2025 & 2033
- Figure 116: South America Care Management Solutions Industry Volume (K Unit), by End User 2025 & 2033
- Figure 117: South America Care Management Solutions Industry Revenue Share (%), by End User 2025 & 2033
- Figure 118: South America Care Management Solutions Industry Volume Share (%), by End User 2025 & 2033
- Figure 119: South America Care Management Solutions Industry Revenue (Million), by Country 2025 & 2033
- Figure 120: South America Care Management Solutions Industry Volume (K Unit), by Country 2025 & 2033
- Figure 121: South America Care Management Solutions Industry Revenue Share (%), by Country 2025 & 2033
- Figure 122: South America Care Management Solutions Industry Volume Share (%), by Country 2025 & 2033
List of Tables
- Table 1: Global Care Management Solutions Industry Revenue Million Forecast, by Component 2020 & 2033
- Table 2: Global Care Management Solutions Industry Volume K Unit Forecast, by Component 2020 & 2033
- Table 3: Global Care Management Solutions Industry Revenue Million Forecast, by Delivery Mode 2020 & 2033
- Table 4: Global Care Management Solutions Industry Volume K Unit Forecast, by Delivery Mode 2020 & 2033
- Table 5: Global Care Management Solutions Industry Revenue Million Forecast, by Application 2020 & 2033
- Table 6: Global Care Management Solutions Industry Volume K Unit Forecast, by Application 2020 & 2033
- Table 7: Global Care Management Solutions Industry Revenue Million Forecast, by End User 2020 & 2033
- Table 8: Global Care Management Solutions Industry Volume K Unit Forecast, by End User 2020 & 2033
- Table 9: Global Care Management Solutions Industry Revenue Million Forecast, by Region 2020 & 2033
- Table 10: Global Care Management Solutions Industry Volume K Unit Forecast, by Region 2020 & 2033
- Table 11: Global Care Management Solutions Industry Revenue Million Forecast, by Component 2020 & 2033
- Table 12: Global Care Management Solutions Industry Volume K Unit Forecast, by Component 2020 & 2033
- Table 13: Global Care Management Solutions Industry Revenue Million Forecast, by Delivery Mode 2020 & 2033
- Table 14: Global Care Management Solutions Industry Volume K Unit Forecast, by Delivery Mode 2020 & 2033
- Table 15: Global Care Management Solutions Industry Revenue Million Forecast, by Application 2020 & 2033
- Table 16: Global Care Management Solutions Industry Volume K Unit Forecast, by Application 2020 & 2033
- Table 17: Global Care Management Solutions Industry Revenue Million Forecast, by End User 2020 & 2033
- Table 18: Global Care Management Solutions Industry Volume K Unit Forecast, by End User 2020 & 2033
- Table 19: Global Care Management Solutions Industry Revenue Million Forecast, by Country 2020 & 2033
- Table 20: Global Care Management Solutions Industry Volume K Unit Forecast, by Country 2020 & 2033
- Table 21: United States Care Management Solutions Industry Revenue (Million) Forecast, by Application 2020 & 2033
- Table 22: United States Care Management Solutions Industry Volume (K Unit) Forecast, by Application 2020 & 2033
- Table 23: Canada Care Management Solutions Industry Revenue (Million) Forecast, by Application 2020 & 2033
- Table 24: Canada Care Management Solutions Industry Volume (K Unit) Forecast, by Application 2020 & 2033
- Table 25: Mexico Care Management Solutions Industry Revenue (Million) Forecast, by Application 2020 & 2033
- Table 26: Mexico Care Management Solutions Industry Volume (K Unit) Forecast, by Application 2020 & 2033
- Table 27: Global Care Management Solutions Industry Revenue Million Forecast, by Component 2020 & 2033
- Table 28: Global Care Management Solutions Industry Volume K Unit Forecast, by Component 2020 & 2033
- Table 29: Global Care Management Solutions Industry Revenue Million Forecast, by Delivery Mode 2020 & 2033
- Table 30: Global Care Management Solutions Industry Volume K Unit Forecast, by Delivery Mode 2020 & 2033
- Table 31: Global Care Management Solutions Industry Revenue Million Forecast, by Application 2020 & 2033
- Table 32: Global Care Management Solutions Industry Volume K Unit Forecast, by Application 2020 & 2033
- Table 33: Global Care Management Solutions Industry Revenue Million Forecast, by End User 2020 & 2033
- Table 34: Global Care Management Solutions Industry Volume K Unit Forecast, by End User 2020 & 2033
- Table 35: Global Care Management Solutions Industry Revenue Million Forecast, by Country 2020 & 2033
- Table 36: Global Care Management Solutions Industry Volume K Unit Forecast, by Country 2020 & 2033
- Table 37: Germany Care Management Solutions Industry Revenue (Million) Forecast, by Application 2020 & 2033
- Table 38: Germany Care Management Solutions Industry Volume (K Unit) Forecast, by Application 2020 & 2033
- Table 39: United Kindom Care Management Solutions Industry Revenue (Million) Forecast, by Application 2020 & 2033
- Table 40: United Kindom Care Management Solutions Industry Volume (K Unit) Forecast, by Application 2020 & 2033
- Table 41: France Care Management Solutions Industry Revenue (Million) Forecast, by Application 2020 & 2033
- Table 42: France Care Management Solutions Industry Volume (K Unit) Forecast, by Application 2020 & 2033
- Table 43: Italy Care Management Solutions Industry Revenue (Million) Forecast, by Application 2020 & 2033
- Table 44: Italy Care Management Solutions Industry Volume (K Unit) Forecast, by Application 2020 & 2033
- Table 45: Spain Care Management Solutions Industry Revenue (Million) Forecast, by Application 2020 & 2033
- Table 46: Spain Care Management Solutions Industry Volume (K Unit) Forecast, by Application 2020 & 2033
- Table 47: Rest of Europe Care Management Solutions Industry Revenue (Million) Forecast, by Application 2020 & 2033
- Table 48: Rest of Europe Care Management Solutions Industry Volume (K Unit) Forecast, by Application 2020 & 2033
- Table 49: Global Care Management Solutions Industry Revenue Million Forecast, by Component 2020 & 2033
- Table 50: Global Care Management Solutions Industry Volume K Unit Forecast, by Component 2020 & 2033
- Table 51: Global Care Management Solutions Industry Revenue Million Forecast, by Delivery Mode 2020 & 2033
- Table 52: Global Care Management Solutions Industry Volume K Unit Forecast, by Delivery Mode 2020 & 2033
- Table 53: Global Care Management Solutions Industry Revenue Million Forecast, by Application 2020 & 2033
- Table 54: Global Care Management Solutions Industry Volume K Unit Forecast, by Application 2020 & 2033
- Table 55: Global Care Management Solutions Industry Revenue Million Forecast, by End User 2020 & 2033
- Table 56: Global Care Management Solutions Industry Volume K Unit Forecast, by End User 2020 & 2033
- Table 57: Global Care Management Solutions Industry Revenue Million Forecast, by Country 2020 & 2033
- Table 58: Global Care Management Solutions Industry Volume K Unit Forecast, by Country 2020 & 2033
- Table 59: China Care Management Solutions Industry Revenue (Million) Forecast, by Application 2020 & 2033
- Table 60: China Care Management Solutions Industry Volume (K Unit) Forecast, by Application 2020 & 2033
- Table 61: Japan Care Management Solutions Industry Revenue (Million) Forecast, by Application 2020 & 2033
- Table 62: Japan Care Management Solutions Industry Volume (K Unit) Forecast, by Application 2020 & 2033
- Table 63: India Care Management Solutions Industry Revenue (Million) Forecast, by Application 2020 & 2033
- Table 64: India Care Management Solutions Industry Volume (K Unit) Forecast, by Application 2020 & 2033
- Table 65: Australia Care Management Solutions Industry Revenue (Million) Forecast, by Application 2020 & 2033
- Table 66: Australia Care Management Solutions Industry Volume (K Unit) Forecast, by Application 2020 & 2033
- Table 67: South Korea Care Management Solutions Industry Revenue (Million) Forecast, by Application 2020 & 2033
- Table 68: South Korea Care Management Solutions Industry Volume (K Unit) Forecast, by Application 2020 & 2033
- Table 69: Rest of Asia Pacific Care Management Solutions Industry Revenue (Million) Forecast, by Application 2020 & 2033
- Table 70: Rest of Asia Pacific Care Management Solutions Industry Volume (K Unit) Forecast, by Application 2020 & 2033
- Table 71: Global Care Management Solutions Industry Revenue Million Forecast, by Component 2020 & 2033
- Table 72: Global Care Management Solutions Industry Volume K Unit Forecast, by Component 2020 & 2033
- Table 73: Global Care Management Solutions Industry Revenue Million Forecast, by Delivery Mode 2020 & 2033
- Table 74: Global Care Management Solutions Industry Volume K Unit Forecast, by Delivery Mode 2020 & 2033
- Table 75: Global Care Management Solutions Industry Revenue Million Forecast, by Application 2020 & 2033
- Table 76: Global Care Management Solutions Industry Volume K Unit Forecast, by Application 2020 & 2033
- Table 77: Global Care Management Solutions Industry Revenue Million Forecast, by End User 2020 & 2033
- Table 78: Global Care Management Solutions Industry Volume K Unit Forecast, by End User 2020 & 2033
- Table 79: Global Care Management Solutions Industry Revenue Million Forecast, by Country 2020 & 2033
- Table 80: Global Care Management Solutions Industry Volume K Unit Forecast, by Country 2020 & 2033
- Table 81: Global Care Management Solutions Industry Revenue Million Forecast, by Component 2020 & 2033
- Table 82: Global Care Management Solutions Industry Volume K Unit Forecast, by Component 2020 & 2033
- Table 83: Global Care Management Solutions Industry Revenue Million Forecast, by Delivery Mode 2020 & 2033
- Table 84: Global Care Management Solutions Industry Volume K Unit Forecast, by Delivery Mode 2020 & 2033
- Table 85: Global Care Management Solutions Industry Revenue Million Forecast, by Application 2020 & 2033
- Table 86: Global Care Management Solutions Industry Volume K Unit Forecast, by Application 2020 & 2033
- Table 87: Global Care Management Solutions Industry Revenue Million Forecast, by End User 2020 & 2033
- Table 88: Global Care Management Solutions Industry Volume K Unit Forecast, by End User 2020 & 2033
- Table 89: Global Care Management Solutions Industry Revenue Million Forecast, by Country 2020 & 2033
- Table 90: Global Care Management Solutions Industry Volume K Unit Forecast, by Country 2020 & 2033
- Table 91: South Africa Care Management Solutions Industry Revenue (Million) Forecast, by Application 2020 & 2033
- Table 92: South Africa Care Management Solutions Industry Volume (K Unit) Forecast, by Application 2020 & 2033
- Table 93: Rest of Middle East and Africa Care Management Solutions Industry Revenue (Million) Forecast, by Application 2020 & 2033
- Table 94: Rest of Middle East and Africa Care Management Solutions Industry Volume (K Unit) Forecast, by Application 2020 & 2033
- Table 95: Global Care Management Solutions Industry Revenue Million Forecast, by Component 2020 & 2033
- Table 96: Global Care Management Solutions Industry Volume K Unit Forecast, by Component 2020 & 2033
- Table 97: Global Care Management Solutions Industry Revenue Million Forecast, by Delivery Mode 2020 & 2033
- Table 98: Global Care Management Solutions Industry Volume K Unit Forecast, by Delivery Mode 2020 & 2033
- Table 99: Global Care Management Solutions Industry Revenue Million Forecast, by Application 2020 & 2033
- Table 100: Global Care Management Solutions Industry Volume K Unit Forecast, by Application 2020 & 2033
- Table 101: Global Care Management Solutions Industry Revenue Million Forecast, by End User 2020 & 2033
- Table 102: Global Care Management Solutions Industry Volume K Unit Forecast, by End User 2020 & 2033
- Table 103: Global Care Management Solutions Industry Revenue Million Forecast, by Country 2020 & 2033
- Table 104: Global Care Management Solutions Industry Volume K Unit Forecast, by Country 2020 & 2033
- Table 105: Brazil Care Management Solutions Industry Revenue (Million) Forecast, by Application 2020 & 2033
- Table 106: Brazil Care Management Solutions Industry Volume (K Unit) Forecast, by Application 2020 & 2033
- Table 107: Argentina Care Management Solutions Industry Revenue (Million) Forecast, by Application 2020 & 2033
- Table 108: Argentina Care Management Solutions Industry Volume (K Unit) Forecast, by Application 2020 & 2033
- Table 109: Rest of South America Care Management Solutions Industry Revenue (Million) Forecast, by Application 2020 & 2033
- Table 110: Rest of South America Care Management Solutions Industry Volume (K Unit) Forecast, by Application 2020 & 2033
Frequently Asked Questions
1. What is the projected Compound Annual Growth Rate (CAGR) of the Care Management Solutions Industry?
The projected CAGR is approximately 12.23%.
2. Which companies are prominent players in the Care Management Solutions Industry?
Key companies in the market include Zeomega Inc, Medecision Inc, Phytel Inc (IBM Corporation), Cognizant, I2I Systems Inc, Centene Corporation (Evolve), Veradigm, InfoMC, Infosys Limited, Convey Health Solutions, Optum Inc, EPIC Corporation Inc, Exl Healthcare, Hinduja Global Solutions Limited.
3. What are the main segments of the Care Management Solutions Industry?
The market segments include Component, Delivery Mode, Application, End User.
4. Can you provide details about the market size?
The market size is estimated to be USD 15.03 Million as of 2022.
5. What are some drivers contributing to market growth?
Rising Geriatric Population and Burden of Chronic Diseases; Care Management Solutions Offer a Means to Reduce Healthcare Costs; Government Initiatives on Healthcare Services and Infrastructure.
6. What are the notable trends driving market growth?
Chronic Care Management Segment Expected to Hold a Significant Share in the Care Management Solutions Market.
7. Are there any restraints impacting market growth?
High Investments Required for Supporting Infrastructure; Data Security Concerns Related to Cloud-based Solutions.
8. Can you provide examples of recent developments in the market?
April 2023: Medecision, a provider of digital care management solutions and services, launched Aerial Social Care Coordinator, a cutting-edge solution designed to provide health plans and healthcare providers with immediate insight into individuals' social determinants of health barriers.
9. What pricing options are available for accessing the report?
Pricing options include single-user, multi-user, and enterprise licenses priced at USD 4750, USD 5250, and USD 8750 respectively.
10. Is the market size provided in terms of value or volume?
The market size is provided in terms of value, measured in Million and volume, measured in K Unit.
11. Are there any specific market keywords associated with the report?
Yes, the market keyword associated with the report is "Care Management Solutions Industry," which aids in identifying and referencing the specific market segment covered.
12. How do I determine which pricing option suits my needs best?
The pricing options vary based on user requirements and access needs. Individual users may opt for single-user licenses, while businesses requiring broader access may choose multi-user or enterprise licenses for cost-effective access to the report.
13. Are there any additional resources or data provided in the Care Management Solutions Industry report?
While the report offers comprehensive insights, it's advisable to review the specific contents or supplementary materials provided to ascertain if additional resources or data are available.
14. How can I stay updated on further developments or reports in the Care Management Solutions Industry?
To stay informed about further developments, trends, and reports in the Care Management Solutions Industry, consider subscribing to industry newsletters, following relevant companies and organizations, or regularly checking reputable industry news sources and publications.
Methodology
Step 1 - Identification of Relevant Samples Size from Population Database


Step 2 - Approaches for Defining Global Market Size (Value, Volume* & Price*)

Note*: In applicable scenarios
Step 3 - Data Sources
Primary Research
- Web Analytics
- Survey Reports
- Research Institute
- Latest Research Reports
- Opinion Leaders
Secondary Research
- Annual Reports
- White Paper
- Latest Press Release
- Industry Association
- Paid Database
- Investor Presentations

Step 4 - Data Triangulation
Involves using different sources of information in order to increase the validity of a study
These sources are likely to be stakeholders in a program - participants, other researchers, program staff, other community members, and so on.
Then we put all data in single framework & apply various statistical tools to find out the dynamic on the market.
During the analysis stage, feedback from the stakeholder groups would be compared to determine areas of agreement as well as areas of divergence