
Key Insights
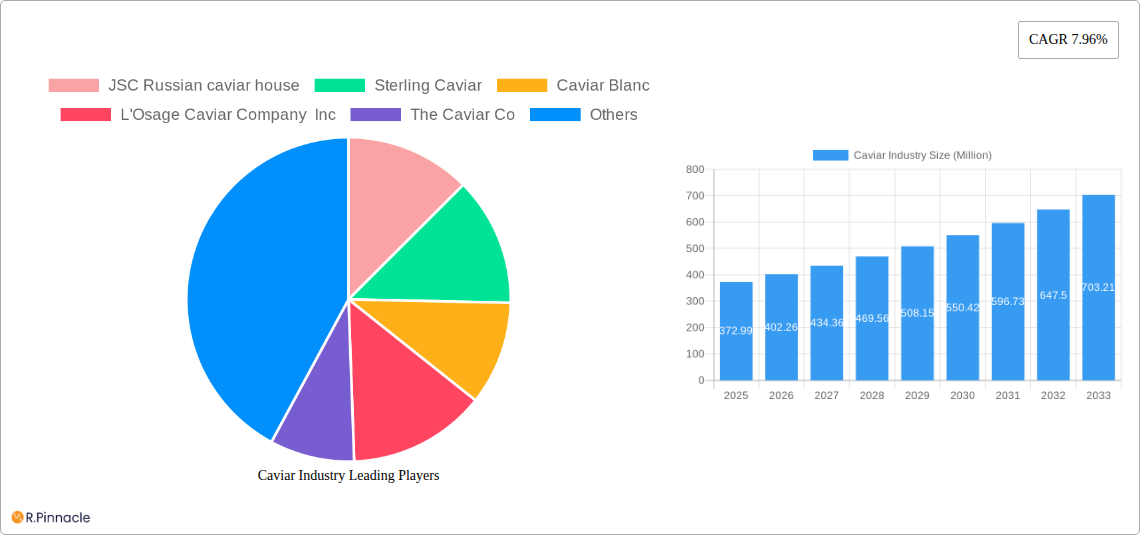
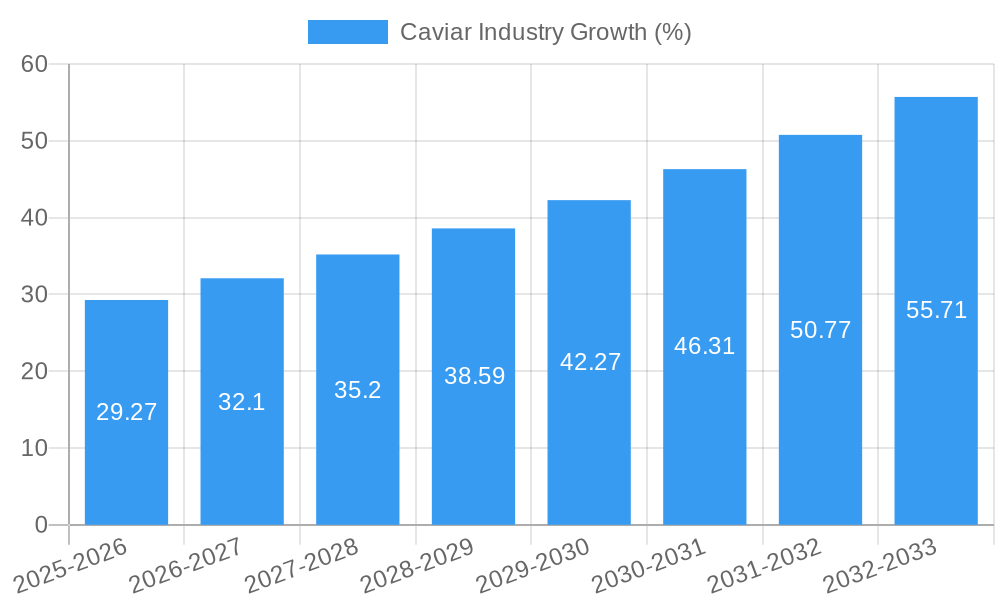
The global caviar market, valued at $372.99 million in 2025, is projected to experience robust growth, exhibiting a Compound Annual Growth Rate (CAGR) of 7.96% from 2025 to 2033. This expansion is driven by several key factors. Increasing disposable incomes in emerging economies, coupled with a rising appreciation for luxury foods and gourmet experiences, fuels demand for caviar, particularly in regions like Asia-Pacific and North America. The growing popularity of caviar in culinary applications, beyond traditional uses, further contributes to market growth. Furthermore, innovative packaging and distribution methods are enhancing product accessibility and preserving quality, expanding the market reach to a wider consumer base. However, the market faces challenges such as stringent regulations surrounding caviar production and sustainability concerns regarding sturgeon populations, potentially impacting supply and pricing. Specific segmental performance is expected to vary; for example, Beluga caviar, despite its premium price point, will likely maintain strong growth due to its high-end market appeal. The "fresh" form will likely dominate the form segment, although growth in processed forms like frozen caviar caters to convenience and broader consumer segments. The off-trade channel (retail, online sales) is poised for considerable growth driven by e-commerce expansion and greater accessibility.
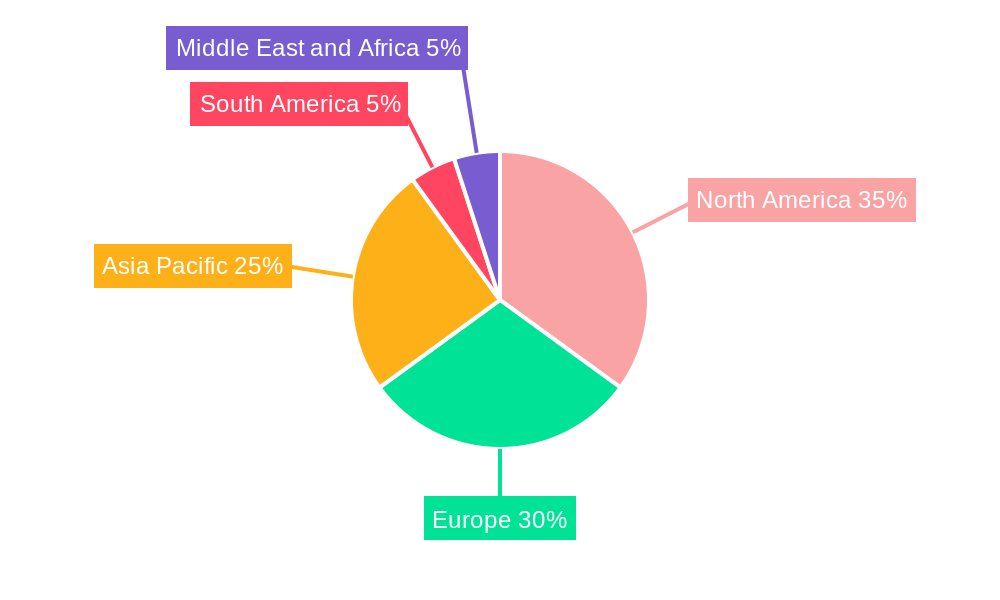
The regional landscape exhibits significant diversity. North America and Europe are currently the largest markets, benefiting from established consumer preferences and robust distribution networks. However, Asia-Pacific is expected to witness the fastest growth rate due to rising affluence and changing consumer tastes. Competition within the industry is intense, with a mixture of established players like JSC Russian Caviar House and Labeyrie Fine Food, and newer entrants focused on sustainable practices and innovative product offerings. Strategic partnerships, product diversification, and investments in sustainable aquaculture will be crucial for companies aiming to capitalize on the market's growth potential and address sustainability concerns. Long-term market prospects remain positive, subject to consistent management of sturgeon populations and adaptation to evolving consumer demands.
Caviar Industry Market Report: 2019-2033 - A Comprehensive Analysis
This comprehensive report provides an in-depth analysis of the global caviar industry, covering the period 2019-2033, with a focus on market dynamics, key players, and future growth opportunities. The report utilizes a robust methodology, incorporating historical data (2019-2024), a base year of 2025, and projections extending to 2033. This data-driven analysis offers invaluable insights for industry professionals, investors, and anyone seeking a detailed understanding of this luxury food market. The global caviar market is estimated to be worth xx Million in 2025 and projected to reach xx Million by 2033.
Caviar Industry Market Structure & Innovation Trends
This section analyzes the competitive landscape of the caviar industry, examining market concentration, innovation drivers, regulatory frameworks, product substitutes, end-user demographics, and merger and acquisition (M&A) activities. The report includes a detailed evaluation of market share held by key players, including JSC Russian caviar house, Sterling Caviar, Caviar Blanc, L'Osage Caviar Company Inc, The Caviar Co, Black River Caviar, Labeyrie Fine Food, Sepehr Dad Caviar GmbH, Caviar Creator Inc, and Sasanian Caviar Inc. For example, the estimated market share of JSC Russian Caviar House in 2025 is xx%.
- Market Concentration: The caviar market exhibits a moderately concentrated structure, with a few major players holding significant market share.
- Innovation Drivers: Sustainability initiatives, technological advancements in farming techniques, and diversification of product offerings are key innovation drivers.
- Regulatory Frameworks: Government regulations concerning caviar production, trade, and sustainability significantly influence market dynamics.
- Product Substitutes: The market faces competition from alternative luxury foods and protein sources.
- End-User Demographics: High-net-worth individuals and upscale restaurants represent the primary consumer base.
- M&A Activities: The report analyzes recent M&A activities, including deal values and their impact on market consolidation. For example, the total value of M&A deals in the caviar industry between 2019 and 2024 is estimated at xx Million.
Caviar Industry Market Dynamics & Trends
This section delves into the key factors driving market growth, technological disruptions, evolving consumer preferences, and the competitive dynamics within the caviar industry. The Compound Annual Growth Rate (CAGR) for the forecast period (2025-2033) is projected at xx%, reflecting the market's growth trajectory. Market penetration of various caviar types across different regions is also analyzed. Factors influencing market dynamics include fluctuating consumer spending habits, changing dietary preferences, and the ongoing efforts to ensure sustainable caviar production.
Dominant Regions & Segments in Caviar Industry
This section identifies the leading regions, countries, and segments within the caviar market based on Type (Sevruga, Osetra, Beluga, Sterlet, Other Types), Form (Fresh, Dried, Frozen), and Sales Channel (On-Trade, Off-Trade). Specific drivers behind regional dominance, such as economic policies and infrastructure, are discussed. For instance, the dominance of a specific region is attributed to factors like:
- High Disposable Incomes: Strong purchasing power fuels demand in these areas.
- Developed Restaurant Infrastructure: A robust restaurant network supports high caviar consumption.
- Favorable Government Policies: Supportive regulations promote caviar production and trade.
The Beluga caviar segment is projected to hold the largest market share in 2025, while the On-Trade sales channel is expected to maintain its dominance.
Caviar Industry Product Innovations
Recent advancements in caviar production and processing techniques, including sustainable farming practices and improved preservation methods, have enhanced product quality and expanded market reach. This has resulted in the introduction of new caviar products with unique flavor profiles and extended shelf life. New applications for caviar, such as incorporating it into gourmet food products, have also emerged, broadening the market appeal.
Report Scope & Segmentation Analysis
This report comprehensively segments the caviar market by Type (Sevruga, Osetra, Beluga, Sterlet, Other Types), Form (Fresh, Dried, Frozen), and Sales Channel (On-Trade, Off-Trade). Each segment's growth projections, market size, and competitive dynamics are analyzed. For example, the market size of the Beluga caviar segment is estimated at xx Million in 2025.
Key Drivers of Caviar Industry Growth
Key drivers of growth include rising disposable incomes in key markets, increasing demand for luxury foods, and technological advancements enabling sustainable and efficient caviar farming. Government policies promoting aquaculture and sustainable practices also support industry expansion.
Challenges in the Caviar Industry Sector
The caviar industry faces challenges such as stringent regulations, supply chain complexities, and intense competition. Fluctuations in raw material costs and environmental concerns related to sturgeon farming also pose significant hurdles. These factors could potentially impact the overall market growth by xx% during the forecast period.
Emerging Opportunities in Caviar Industry
Emerging opportunities include the expansion into new markets with growing affluence, the development of innovative caviar-based products, and the adoption of sustainable farming practices to address environmental concerns.
Leading Players in the Caviar Industry Market
- JSC Russian caviar house
- Sterling Caviar
- Caviar Blanc
- L'Osage Caviar Company Inc
- The Caviar Co
- Black River Caviar
- Labeyrie Fine Food
- Sepehr Dad Caviar GmbH
- Caviar Creator Inc
- Sasanian Caviar Inc
Key Developments in Caviar Industry
- 2022 Q4: Labeyrie Fine Food launched a new line of sustainably sourced caviar.
- 2023 Q1: A significant investment was made in advanced caviar farming technology by an undisclosed company.
- 2024 Q2: New regulations regarding caviar imports were implemented in a major market.
Future Outlook for Caviar Industry Market
The caviar market is projected to experience steady growth over the forecast period, driven by factors such as increasing consumer demand for premium foods and ongoing innovation in sustainable production practices. This translates to significant opportunities for industry players to expand their market share through product diversification and strategic partnerships.
Caviar Industry Segmentation
-
1. Type
- 1.1. Sevruga
- 1.2. Osetra
- 1.3. Beluga
- 1.4. Sterlet
- 1.5. Other Types
-
2. Form
- 2.1. Fresh
- 2.2. Dried
- 2.3. Frozen
-
3. Sales Channel
- 3.1. On-Trade
- 3.2. Off-Trade
Caviar Industry Segmentation By Geography
-
1. North America
- 1.1. United States
- 1.2. Canada
- 1.3. Mexico
- 1.4. Rest of North America
-
2. Europe
- 2.1. Spain
- 2.2. United Kingdom
- 2.3. Germany
- 2.4. France
- 2.5. Italy
- 2.6. Russia
- 2.7. Rest of Europe
-
3. Asia Pacific
- 3.1. China
- 3.2. Japan
- 3.3. India
- 3.4. Australia
- 3.5. Rest of Asia Pacific
-
4. South America
- 4.1. Brazil
- 4.2. Argentina
- 4.3. Rest of South America
-
5. Middle East and Africa
- 5.1. South Africa
- 5.2. Saudi Arabia
- 5.3. Rest of Middle East and Africa
Caviar Industry REPORT HIGHLIGHTS
| Aspects | Details |
|---|---|
| Study Period | 2019-2033 |
| Base Year | 2024 |
| Estimated Year | 2025 |
| Forecast Period | 2025-2033 |
| Historical Period | 2019-2024 |
| Growth Rate | CAGR of 7.96% from 2019-2033 |
| Segmentation |
|
Table of Contents
- 1. Introduction
- 1.1. Research Scope
- 1.2. Market Segmentation
- 1.3. Research Methodology
- 1.4. Definitions and Assumptions
- 2. Executive Summary
- 2.1. Introduction
- 3. Market Dynamics
- 3.1. Introduction
- 3.2. Market Drivers
- 3.2.1. Caviar's use in high-end cuisine and gourmet dining boosts its market presence
- 3.3. Market Restrains
- 3.3.1. High price of caviar limits its market to premium segment
- 3.4. Market Trends
- 3.4.1. Advances in aquaculture technology improve caviar quality and production efficiency
- 4. Market Factor Analysis
- 4.1. Porters Five Forces
- 4.2. Supply/Value Chain
- 4.3. PESTEL analysis
- 4.4. Market Entropy
- 4.5. Patent/Trademark Analysis
- 5. Global Caviar Industry Analysis, Insights and Forecast, 2019-2031
- 5.1. Market Analysis, Insights and Forecast - by Type
- 5.1.1. Sevruga
- 5.1.2. Osetra
- 5.1.3. Beluga
- 5.1.4. Sterlet
- 5.1.5. Other Types
- 5.2. Market Analysis, Insights and Forecast - by Form
- 5.2.1. Fresh
- 5.2.2. Dried
- 5.2.3. Frozen
- 5.3. Market Analysis, Insights and Forecast - by Sales Channel
- 5.3.1. On-Trade
- 5.3.2. Off-Trade
- 5.4. Market Analysis, Insights and Forecast - by Region
- 5.4.1. North America
- 5.4.2. Europe
- 5.4.3. Asia Pacific
- 5.4.4. South America
- 5.4.5. Middle East and Africa
- 5.1. Market Analysis, Insights and Forecast - by Type
- 6. North America Caviar Industry Analysis, Insights and Forecast, 2019-2031
- 6.1. Market Analysis, Insights and Forecast - by Type
- 6.1.1. Sevruga
- 6.1.2. Osetra
- 6.1.3. Beluga
- 6.1.4. Sterlet
- 6.1.5. Other Types
- 6.2. Market Analysis, Insights and Forecast - by Form
- 6.2.1. Fresh
- 6.2.2. Dried
- 6.2.3. Frozen
- 6.3. Market Analysis, Insights and Forecast - by Sales Channel
- 6.3.1. On-Trade
- 6.3.2. Off-Trade
- 6.1. Market Analysis, Insights and Forecast - by Type
- 7. Europe Caviar Industry Analysis, Insights and Forecast, 2019-2031
- 7.1. Market Analysis, Insights and Forecast - by Type
- 7.1.1. Sevruga
- 7.1.2. Osetra
- 7.1.3. Beluga
- 7.1.4. Sterlet
- 7.1.5. Other Types
- 7.2. Market Analysis, Insights and Forecast - by Form
- 7.2.1. Fresh
- 7.2.2. Dried
- 7.2.3. Frozen
- 7.3. Market Analysis, Insights and Forecast - by Sales Channel
- 7.3.1. On-Trade
- 7.3.2. Off-Trade
- 7.1. Market Analysis, Insights and Forecast - by Type
- 8. Asia Pacific Caviar Industry Analysis, Insights and Forecast, 2019-2031
- 8.1. Market Analysis, Insights and Forecast - by Type
- 8.1.1. Sevruga
- 8.1.2. Osetra
- 8.1.3. Beluga
- 8.1.4. Sterlet
- 8.1.5. Other Types
- 8.2. Market Analysis, Insights and Forecast - by Form
- 8.2.1. Fresh
- 8.2.2. Dried
- 8.2.3. Frozen
- 8.3. Market Analysis, Insights and Forecast - by Sales Channel
- 8.3.1. On-Trade
- 8.3.2. Off-Trade
- 8.1. Market Analysis, Insights and Forecast - by Type
- 9. South America Caviar Industry Analysis, Insights and Forecast, 2019-2031
- 9.1. Market Analysis, Insights and Forecast - by Type
- 9.1.1. Sevruga
- 9.1.2. Osetra
- 9.1.3. Beluga
- 9.1.4. Sterlet
- 9.1.5. Other Types
- 9.2. Market Analysis, Insights and Forecast - by Form
- 9.2.1. Fresh
- 9.2.2. Dried
- 9.2.3. Frozen
- 9.3. Market Analysis, Insights and Forecast - by Sales Channel
- 9.3.1. On-Trade
- 9.3.2. Off-Trade
- 9.1. Market Analysis, Insights and Forecast - by Type
- 10. Middle East and Africa Caviar Industry Analysis, Insights and Forecast, 2019-2031
- 10.1. Market Analysis, Insights and Forecast - by Type
- 10.1.1. Sevruga
- 10.1.2. Osetra
- 10.1.3. Beluga
- 10.1.4. Sterlet
- 10.1.5. Other Types
- 10.2. Market Analysis, Insights and Forecast - by Form
- 10.2.1. Fresh
- 10.2.2. Dried
- 10.2.3. Frozen
- 10.3. Market Analysis, Insights and Forecast - by Sales Channel
- 10.3.1. On-Trade
- 10.3.2. Off-Trade
- 10.1. Market Analysis, Insights and Forecast - by Type
- 11. North America Caviar Industry Analysis, Insights and Forecast, 2019-2031
- 11.1. Market Analysis, Insights and Forecast - By Country/Sub-region
- 11.1.1 United States
- 11.1.2 Canada
- 11.1.3 Mexico
- 11.1.4 Rest of North America
- 12. Europe Caviar Industry Analysis, Insights and Forecast, 2019-2031
- 12.1. Market Analysis, Insights and Forecast - By Country/Sub-region
- 12.1.1 Spain
- 12.1.2 United Kingdom
- 12.1.3 Germany
- 12.1.4 France
- 12.1.5 Italy
- 12.1.6 Russia
- 12.1.7 Rest of Europe
- 13. Asia Pacific Caviar Industry Analysis, Insights and Forecast, 2019-2031
- 13.1. Market Analysis, Insights and Forecast - By Country/Sub-region
- 13.1.1 China
- 13.1.2 Japan
- 13.1.3 India
- 13.1.4 Australia
- 13.1.5 Rest of Asia Pacific
- 14. South America Caviar Industry Analysis, Insights and Forecast, 2019-2031
- 14.1. Market Analysis, Insights and Forecast - By Country/Sub-region
- 14.1.1 Brazil
- 14.1.2 Argentina
- 14.1.3 Rest of South America
- 15. Middle East and Africa Caviar Industry Analysis, Insights and Forecast, 2019-2031
- 15.1. Market Analysis, Insights and Forecast - By Country/Sub-region
- 15.1.1 South Africa
- 15.1.2 Saudi Arabia
- 15.1.3 Rest of Middle East and Africa
- 16. Competitive Analysis
- 16.1. Global Market Share Analysis 2024
- 16.2. Company Profiles
- 16.2.1 JSC Russian caviar house
- 16.2.1.1. Overview
- 16.2.1.2. Products
- 16.2.1.3. SWOT Analysis
- 16.2.1.4. Recent Developments
- 16.2.1.5. Financials (Based on Availability)
- 16.2.2 Sterling Caviar
- 16.2.2.1. Overview
- 16.2.2.2. Products
- 16.2.2.3. SWOT Analysis
- 16.2.2.4. Recent Developments
- 16.2.2.5. Financials (Based on Availability)
- 16.2.3 Caviar Blanc
- 16.2.3.1. Overview
- 16.2.3.2. Products
- 16.2.3.3. SWOT Analysis
- 16.2.3.4. Recent Developments
- 16.2.3.5. Financials (Based on Availability)
- 16.2.4 L'Osage Caviar Company Inc
- 16.2.4.1. Overview
- 16.2.4.2. Products
- 16.2.4.3. SWOT Analysis
- 16.2.4.4. Recent Developments
- 16.2.4.5. Financials (Based on Availability)
- 16.2.5 The Caviar Co
- 16.2.5.1. Overview
- 16.2.5.2. Products
- 16.2.5.3. SWOT Analysis
- 16.2.5.4. Recent Developments
- 16.2.5.5. Financials (Based on Availability)
- 16.2.6 Black River Caviar
- 16.2.6.1. Overview
- 16.2.6.2. Products
- 16.2.6.3. SWOT Analysis
- 16.2.6.4. Recent Developments
- 16.2.6.5. Financials (Based on Availability)
- 16.2.7 Labeyrie Fine Food
- 16.2.7.1. Overview
- 16.2.7.2. Products
- 16.2.7.3. SWOT Analysis
- 16.2.7.4. Recent Developments
- 16.2.7.5. Financials (Based on Availability)
- 16.2.8 Sepehr Dad Caviar GmbH
- 16.2.8.1. Overview
- 16.2.8.2. Products
- 16.2.8.3. SWOT Analysis
- 16.2.8.4. Recent Developments
- 16.2.8.5. Financials (Based on Availability)
- 16.2.9 Caviar Creator Inc
- 16.2.9.1. Overview
- 16.2.9.2. Products
- 16.2.9.3. SWOT Analysis
- 16.2.9.4. Recent Developments
- 16.2.9.5. Financials (Based on Availability)
- 16.2.10 Sasanian Caviar Inc
- 16.2.10.1. Overview
- 16.2.10.2. Products
- 16.2.10.3. SWOT Analysis
- 16.2.10.4. Recent Developments
- 16.2.10.5. Financials (Based on Availability)
- 16.2.1 JSC Russian caviar house
List of Figures
- Figure 1: Global Caviar Industry Revenue Breakdown (Million, %) by Region 2024 & 2032
- Figure 2: North America Caviar Industry Revenue (Million), by Country 2024 & 2032
- Figure 3: North America Caviar Industry Revenue Share (%), by Country 2024 & 2032
- Figure 4: Europe Caviar Industry Revenue (Million), by Country 2024 & 2032
- Figure 5: Europe Caviar Industry Revenue Share (%), by Country 2024 & 2032
- Figure 6: Asia Pacific Caviar Industry Revenue (Million), by Country 2024 & 2032
- Figure 7: Asia Pacific Caviar Industry Revenue Share (%), by Country 2024 & 2032
- Figure 8: South America Caviar Industry Revenue (Million), by Country 2024 & 2032
- Figure 9: South America Caviar Industry Revenue Share (%), by Country 2024 & 2032
- Figure 10: Middle East and Africa Caviar Industry Revenue (Million), by Country 2024 & 2032
- Figure 11: Middle East and Africa Caviar Industry Revenue Share (%), by Country 2024 & 2032
- Figure 12: North America Caviar Industry Revenue (Million), by Type 2024 & 2032
- Figure 13: North America Caviar Industry Revenue Share (%), by Type 2024 & 2032
- Figure 14: North America Caviar Industry Revenue (Million), by Form 2024 & 2032
- Figure 15: North America Caviar Industry Revenue Share (%), by Form 2024 & 2032
- Figure 16: North America Caviar Industry Revenue (Million), by Sales Channel 2024 & 2032
- Figure 17: North America Caviar Industry Revenue Share (%), by Sales Channel 2024 & 2032
- Figure 18: North America Caviar Industry Revenue (Million), by Country 2024 & 2032
- Figure 19: North America Caviar Industry Revenue Share (%), by Country 2024 & 2032
- Figure 20: Europe Caviar Industry Revenue (Million), by Type 2024 & 2032
- Figure 21: Europe Caviar Industry Revenue Share (%), by Type 2024 & 2032
- Figure 22: Europe Caviar Industry Revenue (Million), by Form 2024 & 2032
- Figure 23: Europe Caviar Industry Revenue Share (%), by Form 2024 & 2032
- Figure 24: Europe Caviar Industry Revenue (Million), by Sales Channel 2024 & 2032
- Figure 25: Europe Caviar Industry Revenue Share (%), by Sales Channel 2024 & 2032
- Figure 26: Europe Caviar Industry Revenue (Million), by Country 2024 & 2032
- Figure 27: Europe Caviar Industry Revenue Share (%), by Country 2024 & 2032
- Figure 28: Asia Pacific Caviar Industry Revenue (Million), by Type 2024 & 2032
- Figure 29: Asia Pacific Caviar Industry Revenue Share (%), by Type 2024 & 2032
- Figure 30: Asia Pacific Caviar Industry Revenue (Million), by Form 2024 & 2032
- Figure 31: Asia Pacific Caviar Industry Revenue Share (%), by Form 2024 & 2032
- Figure 32: Asia Pacific Caviar Industry Revenue (Million), by Sales Channel 2024 & 2032
- Figure 33: Asia Pacific Caviar Industry Revenue Share (%), by Sales Channel 2024 & 2032
- Figure 34: Asia Pacific Caviar Industry Revenue (Million), by Country 2024 & 2032
- Figure 35: Asia Pacific Caviar Industry Revenue Share (%), by Country 2024 & 2032
- Figure 36: South America Caviar Industry Revenue (Million), by Type 2024 & 2032
- Figure 37: South America Caviar Industry Revenue Share (%), by Type 2024 & 2032
- Figure 38: South America Caviar Industry Revenue (Million), by Form 2024 & 2032
- Figure 39: South America Caviar Industry Revenue Share (%), by Form 2024 & 2032
- Figure 40: South America Caviar Industry Revenue (Million), by Sales Channel 2024 & 2032
- Figure 41: South America Caviar Industry Revenue Share (%), by Sales Channel 2024 & 2032
- Figure 42: South America Caviar Industry Revenue (Million), by Country 2024 & 2032
- Figure 43: South America Caviar Industry Revenue Share (%), by Country 2024 & 2032
- Figure 44: Middle East and Africa Caviar Industry Revenue (Million), by Type 2024 & 2032
- Figure 45: Middle East and Africa Caviar Industry Revenue Share (%), by Type 2024 & 2032
- Figure 46: Middle East and Africa Caviar Industry Revenue (Million), by Form 2024 & 2032
- Figure 47: Middle East and Africa Caviar Industry Revenue Share (%), by Form 2024 & 2032
- Figure 48: Middle East and Africa Caviar Industry Revenue (Million), by Sales Channel 2024 & 2032
- Figure 49: Middle East and Africa Caviar Industry Revenue Share (%), by Sales Channel 2024 & 2032
- Figure 50: Middle East and Africa Caviar Industry Revenue (Million), by Country 2024 & 2032
- Figure 51: Middle East and Africa Caviar Industry Revenue Share (%), by Country 2024 & 2032
List of Tables
- Table 1: Global Caviar Industry Revenue Million Forecast, by Region 2019 & 2032
- Table 2: Global Caviar Industry Revenue Million Forecast, by Type 2019 & 2032
- Table 3: Global Caviar Industry Revenue Million Forecast, by Form 2019 & 2032
- Table 4: Global Caviar Industry Revenue Million Forecast, by Sales Channel 2019 & 2032
- Table 5: Global Caviar Industry Revenue Million Forecast, by Region 2019 & 2032
- Table 6: Global Caviar Industry Revenue Million Forecast, by Country 2019 & 2032
- Table 7: United States Caviar Industry Revenue (Million) Forecast, by Application 2019 & 2032
- Table 8: Canada Caviar Industry Revenue (Million) Forecast, by Application 2019 & 2032
- Table 9: Mexico Caviar Industry Revenue (Million) Forecast, by Application 2019 & 2032
- Table 10: Rest of North America Caviar Industry Revenue (Million) Forecast, by Application 2019 & 2032
- Table 11: Global Caviar Industry Revenue Million Forecast, by Country 2019 & 2032
- Table 12: Spain Caviar Industry Revenue (Million) Forecast, by Application 2019 & 2032
- Table 13: United Kingdom Caviar Industry Revenue (Million) Forecast, by Application 2019 & 2032
- Table 14: Germany Caviar Industry Revenue (Million) Forecast, by Application 2019 & 2032
- Table 15: France Caviar Industry Revenue (Million) Forecast, by Application 2019 & 2032
- Table 16: Italy Caviar Industry Revenue (Million) Forecast, by Application 2019 & 2032
- Table 17: Russia Caviar Industry Revenue (Million) Forecast, by Application 2019 & 2032
- Table 18: Rest of Europe Caviar Industry Revenue (Million) Forecast, by Application 2019 & 2032
- Table 19: Global Caviar Industry Revenue Million Forecast, by Country 2019 & 2032
- Table 20: China Caviar Industry Revenue (Million) Forecast, by Application 2019 & 2032
- Table 21: Japan Caviar Industry Revenue (Million) Forecast, by Application 2019 & 2032
- Table 22: India Caviar Industry Revenue (Million) Forecast, by Application 2019 & 2032
- Table 23: Australia Caviar Industry Revenue (Million) Forecast, by Application 2019 & 2032
- Table 24: Rest of Asia Pacific Caviar Industry Revenue (Million) Forecast, by Application 2019 & 2032
- Table 25: Global Caviar Industry Revenue Million Forecast, by Country 2019 & 2032
- Table 26: Brazil Caviar Industry Revenue (Million) Forecast, by Application 2019 & 2032
- Table 27: Argentina Caviar Industry Revenue (Million) Forecast, by Application 2019 & 2032
- Table 28: Rest of South America Caviar Industry Revenue (Million) Forecast, by Application 2019 & 2032
- Table 29: Global Caviar Industry Revenue Million Forecast, by Country 2019 & 2032
- Table 30: South Africa Caviar Industry Revenue (Million) Forecast, by Application 2019 & 2032
- Table 31: Saudi Arabia Caviar Industry Revenue (Million) Forecast, by Application 2019 & 2032
- Table 32: Rest of Middle East and Africa Caviar Industry Revenue (Million) Forecast, by Application 2019 & 2032
- Table 33: Global Caviar Industry Revenue Million Forecast, by Type 2019 & 2032
- Table 34: Global Caviar Industry Revenue Million Forecast, by Form 2019 & 2032
- Table 35: Global Caviar Industry Revenue Million Forecast, by Sales Channel 2019 & 2032
- Table 36: Global Caviar Industry Revenue Million Forecast, by Country 2019 & 2032
- Table 37: United States Caviar Industry Revenue (Million) Forecast, by Application 2019 & 2032
- Table 38: Canada Caviar Industry Revenue (Million) Forecast, by Application 2019 & 2032
- Table 39: Mexico Caviar Industry Revenue (Million) Forecast, by Application 2019 & 2032
- Table 40: Rest of North America Caviar Industry Revenue (Million) Forecast, by Application 2019 & 2032
- Table 41: Global Caviar Industry Revenue Million Forecast, by Type 2019 & 2032
- Table 42: Global Caviar Industry Revenue Million Forecast, by Form 2019 & 2032
- Table 43: Global Caviar Industry Revenue Million Forecast, by Sales Channel 2019 & 2032
- Table 44: Global Caviar Industry Revenue Million Forecast, by Country 2019 & 2032
- Table 45: Spain Caviar Industry Revenue (Million) Forecast, by Application 2019 & 2032
- Table 46: United Kingdom Caviar Industry Revenue (Million) Forecast, by Application 2019 & 2032
- Table 47: Germany Caviar Industry Revenue (Million) Forecast, by Application 2019 & 2032
- Table 48: France Caviar Industry Revenue (Million) Forecast, by Application 2019 & 2032
- Table 49: Italy Caviar Industry Revenue (Million) Forecast, by Application 2019 & 2032
- Table 50: Russia Caviar Industry Revenue (Million) Forecast, by Application 2019 & 2032
- Table 51: Rest of Europe Caviar Industry Revenue (Million) Forecast, by Application 2019 & 2032
- Table 52: Global Caviar Industry Revenue Million Forecast, by Type 2019 & 2032
- Table 53: Global Caviar Industry Revenue Million Forecast, by Form 2019 & 2032
- Table 54: Global Caviar Industry Revenue Million Forecast, by Sales Channel 2019 & 2032
- Table 55: Global Caviar Industry Revenue Million Forecast, by Country 2019 & 2032
- Table 56: China Caviar Industry Revenue (Million) Forecast, by Application 2019 & 2032
- Table 57: Japan Caviar Industry Revenue (Million) Forecast, by Application 2019 & 2032
- Table 58: India Caviar Industry Revenue (Million) Forecast, by Application 2019 & 2032
- Table 59: Australia Caviar Industry Revenue (Million) Forecast, by Application 2019 & 2032
- Table 60: Rest of Asia Pacific Caviar Industry Revenue (Million) Forecast, by Application 2019 & 2032
- Table 61: Global Caviar Industry Revenue Million Forecast, by Type 2019 & 2032
- Table 62: Global Caviar Industry Revenue Million Forecast, by Form 2019 & 2032
- Table 63: Global Caviar Industry Revenue Million Forecast, by Sales Channel 2019 & 2032
- Table 64: Global Caviar Industry Revenue Million Forecast, by Country 2019 & 2032
- Table 65: Brazil Caviar Industry Revenue (Million) Forecast, by Application 2019 & 2032
- Table 66: Argentina Caviar Industry Revenue (Million) Forecast, by Application 2019 & 2032
- Table 67: Rest of South America Caviar Industry Revenue (Million) Forecast, by Application 2019 & 2032
- Table 68: Global Caviar Industry Revenue Million Forecast, by Type 2019 & 2032
- Table 69: Global Caviar Industry Revenue Million Forecast, by Form 2019 & 2032
- Table 70: Global Caviar Industry Revenue Million Forecast, by Sales Channel 2019 & 2032
- Table 71: Global Caviar Industry Revenue Million Forecast, by Country 2019 & 2032
- Table 72: South Africa Caviar Industry Revenue (Million) Forecast, by Application 2019 & 2032
- Table 73: Saudi Arabia Caviar Industry Revenue (Million) Forecast, by Application 2019 & 2032
- Table 74: Rest of Middle East and Africa Caviar Industry Revenue (Million) Forecast, by Application 2019 & 2032
Frequently Asked Questions
1. What is the projected Compound Annual Growth Rate (CAGR) of the Caviar Industry?
The projected CAGR is approximately 7.96%.
2. Which companies are prominent players in the Caviar Industry?
Key companies in the market include JSC Russian caviar house, Sterling Caviar, Caviar Blanc, L'Osage Caviar Company Inc, The Caviar Co, Black River Caviar, Labeyrie Fine Food, Sepehr Dad Caviar GmbH, Caviar Creator Inc, Sasanian Caviar Inc.
3. What are the main segments of the Caviar Industry?
The market segments include Type, Form, Sales Channel.
4. Can you provide details about the market size?
The market size is estimated to be USD 372.99 Million as of 2022.
5. What are some drivers contributing to market growth?
Caviar's use in high-end cuisine and gourmet dining boosts its market presence.
6. What are the notable trends driving market growth?
Advances in aquaculture technology improve caviar quality and production efficiency.
7. Are there any restraints impacting market growth?
High price of caviar limits its market to premium segment.
8. Can you provide examples of recent developments in the market?
N/A
9. What pricing options are available for accessing the report?
Pricing options include single-user, multi-user, and enterprise licenses priced at USD 4750, USD 5250, and USD 8750 respectively.
10. Is the market size provided in terms of value or volume?
The market size is provided in terms of value, measured in Million.
11. Are there any specific market keywords associated with the report?
Yes, the market keyword associated with the report is "Caviar Industry," which aids in identifying and referencing the specific market segment covered.
12. How do I determine which pricing option suits my needs best?
The pricing options vary based on user requirements and access needs. Individual users may opt for single-user licenses, while businesses requiring broader access may choose multi-user or enterprise licenses for cost-effective access to the report.
13. Are there any additional resources or data provided in the Caviar Industry report?
While the report offers comprehensive insights, it's advisable to review the specific contents or supplementary materials provided to ascertain if additional resources or data are available.
14. How can I stay updated on further developments or reports in the Caviar Industry?
To stay informed about further developments, trends, and reports in the Caviar Industry, consider subscribing to industry newsletters, following relevant companies and organizations, or regularly checking reputable industry news sources and publications.
Methodology
Step 1 - Identification of Relevant Samples Size from Population Database


Step 2 - Approaches for Defining Global Market Size (Value, Volume* & Price*)

Note*: In applicable scenarios
Step 3 - Data Sources
Primary Research
- Web Analytics
- Survey Reports
- Research Institute
- Latest Research Reports
- Opinion Leaders
Secondary Research
- Annual Reports
- White Paper
- Latest Press Release
- Industry Association
- Paid Database
- Investor Presentations

Step 4 - Data Triangulation
Involves using different sources of information in order to increase the validity of a study
These sources are likely to be stakeholders in a program - participants, other researchers, program staff, other community members, and so on.
Then we put all data in single framework & apply various statistical tools to find out the dynamic on the market.
During the analysis stage, feedback from the stakeholder groups would be compared to determine areas of agreement as well as areas of divergence


