
Key Insights
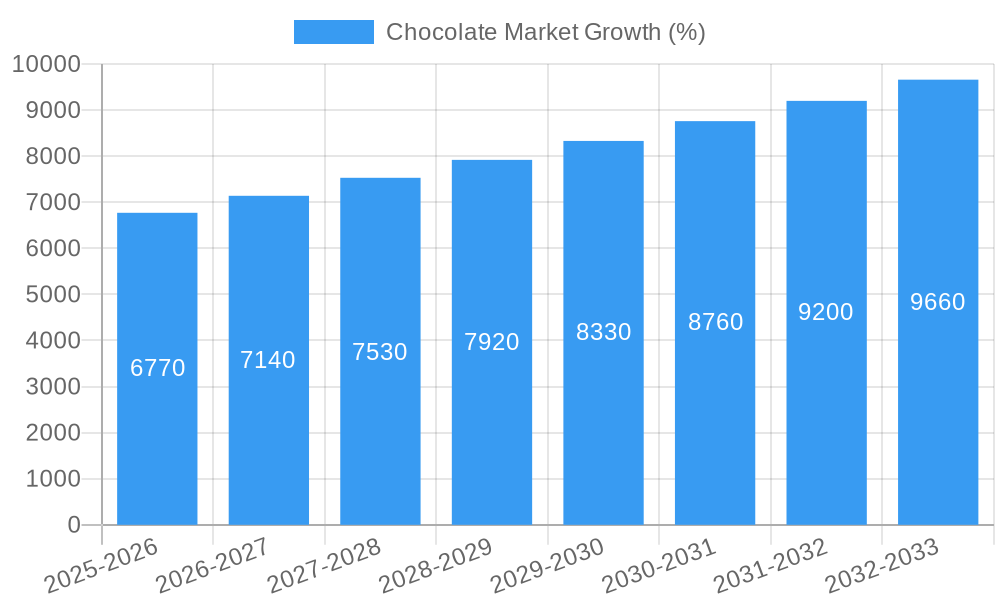
The global chocolate market, valued at $119.23 billion in 2025, is projected to experience robust growth, driven by increasing consumer demand for premium chocolate varieties, expanding online retail channels, and the rising popularity of chocolate confectionery in emerging markets. The 5.45% CAGR indicates a steady expansion over the forecast period (2025-2033). Key growth drivers include the increasing disposable incomes in developing economies fueling higher discretionary spending on confectionery items, innovative product launches catering to diverse consumer preferences (e.g., organic, vegan, and sugar-free options), and successful marketing strategies emphasizing the emotional connection consumers have with chocolate. Dark chocolate, with its health-related attributes, is experiencing particularly strong growth within the confectionery segment. The distribution channel analysis shows a healthy mix, with supermarkets/hypermarkets holding a significant share, complemented by increasing online sales and the convenience offered by convenience stores. Major players like Nestlé, Mars, and Ferrero continue to dominate the market through their strong brand recognition, extensive distribution networks, and continuous innovation. However, smaller niche players focusing on specialty and artisanal chocolates are also emerging, adding further diversity to the market landscape.
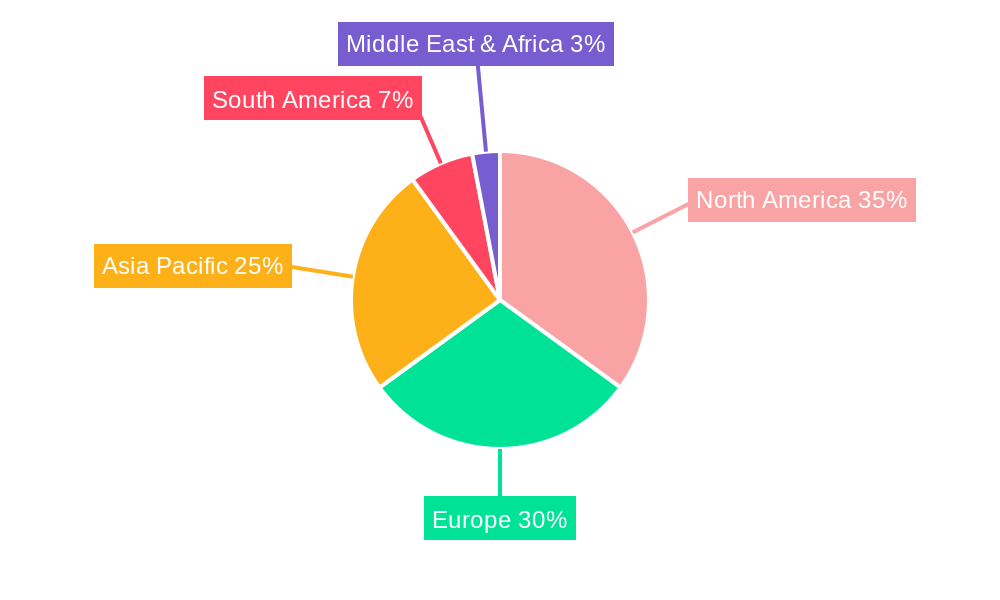
The competitive landscape is characterized by a mix of established multinational corporations and regional players. The geographical distribution of market share indicates strong performance in North America and Europe, which are mature markets with high per capita chocolate consumption. However, the Asia-Pacific region is anticipated to exhibit substantial growth in the coming years, driven by rising middle-class populations and increasing urbanization in countries like China and India. Growth in South America is also expected, albeit at a potentially slower pace compared to Asia-Pacific. Challenges such as fluctuating cocoa bean prices, stringent regulatory environments regarding food safety and labeling, and increasing health consciousness among consumers regarding sugar intake pose potential restraints on market expansion. However, the industry's adaptability and constant innovation suggest a positive outlook for continued growth throughout the forecast period.

Deep Dive into the Global Chocolate Market: 2019-2033
This comprehensive report provides a detailed analysis of the global chocolate market, offering actionable insights for industry professionals and investors. With a study period spanning 2019-2033, a base year of 2025, and a forecast period of 2025-2033, this report illuminates the market's current state and future trajectory. The report leverages extensive market research to provide a granular understanding of market size (in Millions), segmentation, key players, and emerging trends.
Chocolate Market Structure & Innovation Trends
The global chocolate market is characterized by a moderately concentrated structure, with a few major players commanding significant market share. Cargill Incorporated, Nestlé SA, and Mars Incorporated, among others, hold substantial positions, influencing pricing and innovation. However, smaller regional players and niche brands also contribute significantly. The market’s innovation is driven by consumer demand for healthier options, sustainable sourcing, and unique flavor profiles. Regulatory frameworks regarding labeling, ingredients, and sustainability significantly impact market operations. Product substitutes, such as fruit-based snacks and confectionery alternatives, exert competitive pressure. The end-user demographic is broad, encompassing all age groups and income levels, though specific segments show varying preferences. M&A activities, like the recent Ferrero acquisition of Dori Alimentos, demonstrate the industry’s dynamic consolidation.
- Market Concentration: Top 5 players hold approximately xx% market share (2025 estimate).
- Innovation Drivers: Healthier options (e.g., dark chocolate with high cocoa content), sustainable sourcing initiatives, premiumization.
- Regulatory Impact: Growing focus on sugar content regulations, ethical sourcing, and labeling transparency.
- M&A Activity: Total deal value for chocolate M&A in the past 5 years totaled approximately $xx Million.
Chocolate Market Dynamics & Trends
The global chocolate market is experiencing steady growth, driven by increasing disposable incomes, particularly in emerging economies. The CAGR for the period 2025-2033 is projected to be xx%. Technological disruptions, such as improved processing techniques and innovative packaging solutions, enhance efficiency and product quality. Consumer preferences are shifting towards premium, organic, and ethically sourced chocolate. Competitive dynamics are intense, with established players investing in product diversification and expansion into new markets, while smaller players focus on niche products and sustainable practices. Market penetration is high in developed countries, with growth opportunities concentrated in emerging markets.
Dominant Regions & Segments in Chocolate Market
The North American region currently holds the largest market share, followed by Europe and Asia-Pacific. Within confectionery variants, milk chocolate remains the most dominant segment, although dark chocolate is experiencing faster growth driven by health consciousness. Supermarket/hypermarkets constitute the leading distribution channel, followed by online retail.
- Key Drivers for North America: Strong consumer demand, established distribution networks, high disposable income.
- Key Drivers for Europe: Established chocolate-consuming culture, diverse product offerings, high consumer awareness.
- Key Drivers for Asia-Pacific: Growing middle class, rising disposable incomes, increasing Westernization of dietary habits.
- Milk Chocolate Dominance: Driven by broad consumer appeal and affordability.
- Dark Chocolate Growth: Driven by health benefits and premiumization trends.
- Supermarket/Hypermarket Dominance: Wide availability and established consumer shopping habits.
Chocolate Market Product Innovations
Recent product innovations include vegan chocolate, sugar-reduced options, and functional chocolates infused with health-promoting ingredients. These innovations cater to changing consumer preferences and address health concerns. The integration of technology, such as blockchain for traceability, strengthens supply chain transparency and brand image.
Report Scope & Segmentation Analysis
This report segments the chocolate market based on confectionery variant (dark, milk, and white chocolate), and distribution channel (convenience stores, online retail stores, supermarket/hypermarkets, and others). Each segment's growth projection, market size (in Millions), and competitive dynamics are analyzed. For example, the online retail segment is expected to experience significant growth due to increasing e-commerce penetration.
Key Drivers of Chocolate Market Growth
Key growth drivers include rising disposable incomes in developing economies, increasing demand for premium and specialized chocolate products, and the growth of online retail channels. Favorable government policies supporting the food processing industry also boost market growth.
Challenges in the Chocolate Market Sector
Major challenges include fluctuating cocoa bean prices, stringent regulations related to food safety and labeling, and intense competition from both established players and emerging brands. Supply chain disruptions and sustainability concerns pose additional challenges.
Emerging Opportunities in Chocolate Market
Emerging opportunities include the increasing demand for organic and sustainably sourced chocolate, the growth of the vegan chocolate market, and the development of innovative product formats and flavors. Expansion into emerging markets also presents substantial opportunities.
Leading Players in the Chocolate Market Market
- Cargill Incorporated
- Nestlé SA
- Chocoladefabriken Lindt & Sprüngli AG
- Morinaga & Co Ltd
- August Storck KG
- Ferrero International SA
- Mars Incorporated
- Yıldız Holding A.Ş.
- Arcor S.A.I.C.
- Lotte Corporation
- Barry Callebaut AG
- Mondelēz International Inc
- Meiji Holdings Company Ltd
- ITC Limited
- The Hershey Company
Key Developments in Chocolate Market Industry
- August 2023: Lotte Corporation partners with DLT Labs to enhance cacao bean supply chain sustainability and traceability using blockchain technology. This significantly impacts consumer perception and ethical sourcing.
- July 2023: Ferrero's acquisition of Dori Alimentos expands its presence in the Brazilian confectionery market, increasing market share and product portfolio.
- February 2023: The Hershey Company's limited-edition chocolate bars for International Women’s Day drive sales and strengthen brand image through targeted marketing.
Future Outlook for Chocolate Market Market
The future of the chocolate market looks promising, driven by continuous innovation, growing consumer demand, and expansion into new markets. Strategic partnerships and acquisitions will play a crucial role in shaping the market landscape. The focus on sustainability and ethical sourcing will further drive market dynamics.
Chocolate Market Segmentation
-
1. Confectionery Variant
- 1.1. Dark Chocolate
- 1.2. Milk and White Chocolate
-
2. Distribution Channel
- 2.1. Convenience Store
- 2.2. Online Retail Store
- 2.3. Supermarket/Hypermarket
- 2.4. Others
Chocolate Market Segmentation By Geography
-
1. North America
- 1.1. United States
- 1.2. Canada
- 1.3. Mexico
-
2. South America
- 2.1. Brazil
- 2.2. Argentina
- 2.3. Rest of South America
-
3. Europe
- 3.1. United Kingdom
- 3.2. Germany
- 3.3. France
- 3.4. Italy
- 3.5. Spain
- 3.6. Russia
- 3.7. Benelux
- 3.8. Nordics
- 3.9. Rest of Europe
-
4. Middle East & Africa
- 4.1. Turkey
- 4.2. Israel
- 4.3. GCC
- 4.4. North Africa
- 4.5. South Africa
- 4.6. Rest of Middle East & Africa
-
5. Asia Pacific
- 5.1. China
- 5.2. India
- 5.3. Japan
- 5.4. South Korea
- 5.5. ASEAN
- 5.6. Oceania
- 5.7. Rest of Asia Pacific
Chocolate Market REPORT HIGHLIGHTS
| Aspects | Details |
|---|---|
| Study Period | 2019-2033 |
| Base Year | 2024 |
| Estimated Year | 2025 |
| Forecast Period | 2025-2033 |
| Historical Period | 2019-2024 |
| Growth Rate | CAGR of 5.45% from 2019-2033 |
| Segmentation |
|
Table of Contents
- 1. Introduction
- 1.1. Research Scope
- 1.2. Market Segmentation
- 1.3. Research Methodology
- 1.4. Definitions and Assumptions
- 2. Executive Summary
- 2.1. Introduction
- 3. Market Dynamics
- 3.1. Introduction
- 3.2. Market Drivers
- 3.2.1. Increasing demand for meat alternatives
- 3.3. Market Restrains
- 3.3.1. Presence of numerous alternatives in the plant proteins
- 3.4. Market Trends
- 3.4.1. OTHER KEY INDUSTRY TRENDS COVERED IN THE REPORT
- 4. Market Factor Analysis
- 4.1. Porters Five Forces
- 4.2. Supply/Value Chain
- 4.3. PESTEL analysis
- 4.4. Market Entropy
- 4.5. Patent/Trademark Analysis
- 5. Global Chocolate Market Analysis, Insights and Forecast, 2019-2031
- 5.1. Market Analysis, Insights and Forecast - by Confectionery Variant
- 5.1.1. Dark Chocolate
- 5.1.2. Milk and White Chocolate
- 5.2. Market Analysis, Insights and Forecast - by Distribution Channel
- 5.2.1. Convenience Store
- 5.2.2. Online Retail Store
- 5.2.3. Supermarket/Hypermarket
- 5.2.4. Others
- 5.3. Market Analysis, Insights and Forecast - by Region
- 5.3.1. North America
- 5.3.2. South America
- 5.3.3. Europe
- 5.3.4. Middle East & Africa
- 5.3.5. Asia Pacific
- 5.1. Market Analysis, Insights and Forecast - by Confectionery Variant
- 6. North America Chocolate Market Analysis, Insights and Forecast, 2019-2031
- 6.1. Market Analysis, Insights and Forecast - by Confectionery Variant
- 6.1.1. Dark Chocolate
- 6.1.2. Milk and White Chocolate
- 6.2. Market Analysis, Insights and Forecast - by Distribution Channel
- 6.2.1. Convenience Store
- 6.2.2. Online Retail Store
- 6.2.3. Supermarket/Hypermarket
- 6.2.4. Others
- 6.1. Market Analysis, Insights and Forecast - by Confectionery Variant
- 7. South America Chocolate Market Analysis, Insights and Forecast, 2019-2031
- 7.1. Market Analysis, Insights and Forecast - by Confectionery Variant
- 7.1.1. Dark Chocolate
- 7.1.2. Milk and White Chocolate
- 7.2. Market Analysis, Insights and Forecast - by Distribution Channel
- 7.2.1. Convenience Store
- 7.2.2. Online Retail Store
- 7.2.3. Supermarket/Hypermarket
- 7.2.4. Others
- 7.1. Market Analysis, Insights and Forecast - by Confectionery Variant
- 8. Europe Chocolate Market Analysis, Insights and Forecast, 2019-2031
- 8.1. Market Analysis, Insights and Forecast - by Confectionery Variant
- 8.1.1. Dark Chocolate
- 8.1.2. Milk and White Chocolate
- 8.2. Market Analysis, Insights and Forecast - by Distribution Channel
- 8.2.1. Convenience Store
- 8.2.2. Online Retail Store
- 8.2.3. Supermarket/Hypermarket
- 8.2.4. Others
- 8.1. Market Analysis, Insights and Forecast - by Confectionery Variant
- 9. Middle East & Africa Chocolate Market Analysis, Insights and Forecast, 2019-2031
- 9.1. Market Analysis, Insights and Forecast - by Confectionery Variant
- 9.1.1. Dark Chocolate
- 9.1.2. Milk and White Chocolate
- 9.2. Market Analysis, Insights and Forecast - by Distribution Channel
- 9.2.1. Convenience Store
- 9.2.2. Online Retail Store
- 9.2.3. Supermarket/Hypermarket
- 9.2.4. Others
- 9.1. Market Analysis, Insights and Forecast - by Confectionery Variant
- 10. Asia Pacific Chocolate Market Analysis, Insights and Forecast, 2019-2031
- 10.1. Market Analysis, Insights and Forecast - by Confectionery Variant
- 10.1.1. Dark Chocolate
- 10.1.2. Milk and White Chocolate
- 10.2. Market Analysis, Insights and Forecast - by Distribution Channel
- 10.2.1. Convenience Store
- 10.2.2. Online Retail Store
- 10.2.3. Supermarket/Hypermarket
- 10.2.4. Others
- 10.1. Market Analysis, Insights and Forecast - by Confectionery Variant
- 11. Middle East Chocolate Market Analysis, Insights and Forecast, 2019-2031
- 11.1. Market Analysis, Insights and Forecast - By Country/Sub-region
- 11.1.1 Middle East
- 11.1.2 Africa
- 12. North America Chocolate Market Analysis, Insights and Forecast, 2019-2031
- 12.1. Market Analysis, Insights and Forecast - By Country/Sub-region
- 12.1.1 United States
- 12.1.2 Canada
- 12.1.3 Mexico
- 12.1.4 Rest of North America
- 13. Asia Pacific Chocolate Market Analysis, Insights and Forecast, 2019-2031
- 13.1. Market Analysis, Insights and Forecast - By Country/Sub-region
- 13.1.1 China
- 13.1.2 Japan
- 13.1.3 India
- 13.1.4 South Korea
- 13.1.5 Taiwan
- 13.1.6 Australia
- 13.1.7 Rest of Asia-Pacific
- 14. Europe Chocolate Market Analysis, Insights and Forecast, 2019-2031
- 14.1. Market Analysis, Insights and Forecast - By Country/Sub-region
- 14.1.1. Germany
- 15. South America Chocolate Market Analysis, Insights and Forecast, 2019-2031
- 15.1. Market Analysis, Insights and Forecast - By Country/Sub-region
- 15.1.1 Brazil
- 15.1.2 Argentina
- 15.1.3 Rest of South America
- 16. Competitive Analysis
- 16.1. Global Market Share Analysis 2024
- 16.2. Company Profiles
- 16.2.1 Cargill Incorporated
- 16.2.1.1. Overview
- 16.2.1.2. Products
- 16.2.1.3. SWOT Analysis
- 16.2.1.4. Recent Developments
- 16.2.1.5. Financials (Based on Availability)
- 16.2.2 Nestlé SA
- 16.2.2.1. Overview
- 16.2.2.2. Products
- 16.2.2.3. SWOT Analysis
- 16.2.2.4. Recent Developments
- 16.2.2.5. Financials (Based on Availability)
- 16.2.3 Chocoladefabriken Lindt & Sprüngli AG
- 16.2.3.1. Overview
- 16.2.3.2. Products
- 16.2.3.3. SWOT Analysis
- 16.2.3.4. Recent Developments
- 16.2.3.5. Financials (Based on Availability)
- 16.2.4 Morinaga & Co Ltd
- 16.2.4.1. Overview
- 16.2.4.2. Products
- 16.2.4.3. SWOT Analysis
- 16.2.4.4. Recent Developments
- 16.2.4.5. Financials (Based on Availability)
- 16.2.5 August Storck KG
- 16.2.5.1. Overview
- 16.2.5.2. Products
- 16.2.5.3. SWOT Analysis
- 16.2.5.4. Recent Developments
- 16.2.5.5. Financials (Based on Availability)
- 16.2.6 Ferrero International SA
- 16.2.6.1. Overview
- 16.2.6.2. Products
- 16.2.6.3. SWOT Analysis
- 16.2.6.4. Recent Developments
- 16.2.6.5. Financials (Based on Availability)
- 16.2.7 Mars Incorporated
- 16.2.7.1. Overview
- 16.2.7.2. Products
- 16.2.7.3. SWOT Analysis
- 16.2.7.4. Recent Developments
- 16.2.7.5. Financials (Based on Availability)
- 16.2.8 Yıldız Holding A
- 16.2.8.1. Overview
- 16.2.8.2. Products
- 16.2.8.3. SWOT Analysis
- 16.2.8.4. Recent Developments
- 16.2.8.5. Financials (Based on Availability)
- 16.2.9 Arcor S A I C
- 16.2.9.1. Overview
- 16.2.9.2. Products
- 16.2.9.3. SWOT Analysis
- 16.2.9.4. Recent Developments
- 16.2.9.5. Financials (Based on Availability)
- 16.2.10 Lotte Corporation
- 16.2.10.1. Overview
- 16.2.10.2. Products
- 16.2.10.3. SWOT Analysis
- 16.2.10.4. Recent Developments
- 16.2.10.5. Financials (Based on Availability)
- 16.2.11 Barry callebaut AG
- 16.2.11.1. Overview
- 16.2.11.2. Products
- 16.2.11.3. SWOT Analysis
- 16.2.11.4. Recent Developments
- 16.2.11.5. Financials (Based on Availability)
- 16.2.12 Mondelēz International Inc
- 16.2.12.1. Overview
- 16.2.12.2. Products
- 16.2.12.3. SWOT Analysis
- 16.2.12.4. Recent Developments
- 16.2.12.5. Financials (Based on Availability)
- 16.2.13 Meiji Holdings Company Ltd
- 16.2.13.1. Overview
- 16.2.13.2. Products
- 16.2.13.3. SWOT Analysis
- 16.2.13.4. Recent Developments
- 16.2.13.5. Financials (Based on Availability)
- 16.2.14 ITC Limited
- 16.2.14.1. Overview
- 16.2.14.2. Products
- 16.2.14.3. SWOT Analysis
- 16.2.14.4. Recent Developments
- 16.2.14.5. Financials (Based on Availability)
- 16.2.15 The Hershey Company
- 16.2.15.1. Overview
- 16.2.15.2. Products
- 16.2.15.3. SWOT Analysis
- 16.2.15.4. Recent Developments
- 16.2.15.5. Financials (Based on Availability)
- 16.2.1 Cargill Incorporated
List of Figures
- Figure 1: Global Chocolate Market Revenue Breakdown (Million, %) by Region 2024 & 2032
- Figure 2: Global Chocolate Market Volume Breakdown (K Tons, %) by Region 2024 & 2032
- Figure 3: Middle East Chocolate Market Revenue (Million), by Country 2024 & 2032
- Figure 4: Middle East Chocolate Market Volume (K Tons), by Country 2024 & 2032
- Figure 5: Middle East Chocolate Market Revenue Share (%), by Country 2024 & 2032
- Figure 6: Middle East Chocolate Market Volume Share (%), by Country 2024 & 2032
- Figure 7: North America Chocolate Market Revenue (Million), by Country 2024 & 2032
- Figure 8: North America Chocolate Market Volume (K Tons), by Country 2024 & 2032
- Figure 9: North America Chocolate Market Revenue Share (%), by Country 2024 & 2032
- Figure 10: North America Chocolate Market Volume Share (%), by Country 2024 & 2032
- Figure 11: Asia Pacific Chocolate Market Revenue (Million), by Country 2024 & 2032
- Figure 12: Asia Pacific Chocolate Market Volume (K Tons), by Country 2024 & 2032
- Figure 13: Asia Pacific Chocolate Market Revenue Share (%), by Country 2024 & 2032
- Figure 14: Asia Pacific Chocolate Market Volume Share (%), by Country 2024 & 2032
- Figure 15: Europe Chocolate Market Revenue (Million), by Country 2024 & 2032
- Figure 16: Europe Chocolate Market Volume (K Tons), by Country 2024 & 2032
- Figure 17: Europe Chocolate Market Revenue Share (%), by Country 2024 & 2032
- Figure 18: Europe Chocolate Market Volume Share (%), by Country 2024 & 2032
- Figure 19: South America Chocolate Market Revenue (Million), by Country 2024 & 2032
- Figure 20: South America Chocolate Market Volume (K Tons), by Country 2024 & 2032
- Figure 21: South America Chocolate Market Revenue Share (%), by Country 2024 & 2032
- Figure 22: South America Chocolate Market Volume Share (%), by Country 2024 & 2032
- Figure 23: North America Chocolate Market Revenue (Million), by Confectionery Variant 2024 & 2032
- Figure 24: North America Chocolate Market Volume (K Tons), by Confectionery Variant 2024 & 2032
- Figure 25: North America Chocolate Market Revenue Share (%), by Confectionery Variant 2024 & 2032
- Figure 26: North America Chocolate Market Volume Share (%), by Confectionery Variant 2024 & 2032
- Figure 27: North America Chocolate Market Revenue (Million), by Distribution Channel 2024 & 2032
- Figure 28: North America Chocolate Market Volume (K Tons), by Distribution Channel 2024 & 2032
- Figure 29: North America Chocolate Market Revenue Share (%), by Distribution Channel 2024 & 2032
- Figure 30: North America Chocolate Market Volume Share (%), by Distribution Channel 2024 & 2032
- Figure 31: North America Chocolate Market Revenue (Million), by Country 2024 & 2032
- Figure 32: North America Chocolate Market Volume (K Tons), by Country 2024 & 2032
- Figure 33: North America Chocolate Market Revenue Share (%), by Country 2024 & 2032
- Figure 34: North America Chocolate Market Volume Share (%), by Country 2024 & 2032
- Figure 35: South America Chocolate Market Revenue (Million), by Confectionery Variant 2024 & 2032
- Figure 36: South America Chocolate Market Volume (K Tons), by Confectionery Variant 2024 & 2032
- Figure 37: South America Chocolate Market Revenue Share (%), by Confectionery Variant 2024 & 2032
- Figure 38: South America Chocolate Market Volume Share (%), by Confectionery Variant 2024 & 2032
- Figure 39: South America Chocolate Market Revenue (Million), by Distribution Channel 2024 & 2032
- Figure 40: South America Chocolate Market Volume (K Tons), by Distribution Channel 2024 & 2032
- Figure 41: South America Chocolate Market Revenue Share (%), by Distribution Channel 2024 & 2032
- Figure 42: South America Chocolate Market Volume Share (%), by Distribution Channel 2024 & 2032
- Figure 43: South America Chocolate Market Revenue (Million), by Country 2024 & 2032
- Figure 44: South America Chocolate Market Volume (K Tons), by Country 2024 & 2032
- Figure 45: South America Chocolate Market Revenue Share (%), by Country 2024 & 2032
- Figure 46: South America Chocolate Market Volume Share (%), by Country 2024 & 2032
- Figure 47: Europe Chocolate Market Revenue (Million), by Confectionery Variant 2024 & 2032
- Figure 48: Europe Chocolate Market Volume (K Tons), by Confectionery Variant 2024 & 2032
- Figure 49: Europe Chocolate Market Revenue Share (%), by Confectionery Variant 2024 & 2032
- Figure 50: Europe Chocolate Market Volume Share (%), by Confectionery Variant 2024 & 2032
- Figure 51: Europe Chocolate Market Revenue (Million), by Distribution Channel 2024 & 2032
- Figure 52: Europe Chocolate Market Volume (K Tons), by Distribution Channel 2024 & 2032
- Figure 53: Europe Chocolate Market Revenue Share (%), by Distribution Channel 2024 & 2032
- Figure 54: Europe Chocolate Market Volume Share (%), by Distribution Channel 2024 & 2032
- Figure 55: Europe Chocolate Market Revenue (Million), by Country 2024 & 2032
- Figure 56: Europe Chocolate Market Volume (K Tons), by Country 2024 & 2032
- Figure 57: Europe Chocolate Market Revenue Share (%), by Country 2024 & 2032
- Figure 58: Europe Chocolate Market Volume Share (%), by Country 2024 & 2032
- Figure 59: Middle East & Africa Chocolate Market Revenue (Million), by Confectionery Variant 2024 & 2032
- Figure 60: Middle East & Africa Chocolate Market Volume (K Tons), by Confectionery Variant 2024 & 2032
- Figure 61: Middle East & Africa Chocolate Market Revenue Share (%), by Confectionery Variant 2024 & 2032
- Figure 62: Middle East & Africa Chocolate Market Volume Share (%), by Confectionery Variant 2024 & 2032
- Figure 63: Middle East & Africa Chocolate Market Revenue (Million), by Distribution Channel 2024 & 2032
- Figure 64: Middle East & Africa Chocolate Market Volume (K Tons), by Distribution Channel 2024 & 2032
- Figure 65: Middle East & Africa Chocolate Market Revenue Share (%), by Distribution Channel 2024 & 2032
- Figure 66: Middle East & Africa Chocolate Market Volume Share (%), by Distribution Channel 2024 & 2032
- Figure 67: Middle East & Africa Chocolate Market Revenue (Million), by Country 2024 & 2032
- Figure 68: Middle East & Africa Chocolate Market Volume (K Tons), by Country 2024 & 2032
- Figure 69: Middle East & Africa Chocolate Market Revenue Share (%), by Country 2024 & 2032
- Figure 70: Middle East & Africa Chocolate Market Volume Share (%), by Country 2024 & 2032
- Figure 71: Asia Pacific Chocolate Market Revenue (Million), by Confectionery Variant 2024 & 2032
- Figure 72: Asia Pacific Chocolate Market Volume (K Tons), by Confectionery Variant 2024 & 2032
- Figure 73: Asia Pacific Chocolate Market Revenue Share (%), by Confectionery Variant 2024 & 2032
- Figure 74: Asia Pacific Chocolate Market Volume Share (%), by Confectionery Variant 2024 & 2032
- Figure 75: Asia Pacific Chocolate Market Revenue (Million), by Distribution Channel 2024 & 2032
- Figure 76: Asia Pacific Chocolate Market Volume (K Tons), by Distribution Channel 2024 & 2032
- Figure 77: Asia Pacific Chocolate Market Revenue Share (%), by Distribution Channel 2024 & 2032
- Figure 78: Asia Pacific Chocolate Market Volume Share (%), by Distribution Channel 2024 & 2032
- Figure 79: Asia Pacific Chocolate Market Revenue (Million), by Country 2024 & 2032
- Figure 80: Asia Pacific Chocolate Market Volume (K Tons), by Country 2024 & 2032
- Figure 81: Asia Pacific Chocolate Market Revenue Share (%), by Country 2024 & 2032
- Figure 82: Asia Pacific Chocolate Market Volume Share (%), by Country 2024 & 2032
List of Tables
- Table 1: Global Chocolate Market Revenue Million Forecast, by Region 2019 & 2032
- Table 2: Global Chocolate Market Volume K Tons Forecast, by Region 2019 & 2032
- Table 3: Global Chocolate Market Revenue Million Forecast, by Confectionery Variant 2019 & 2032
- Table 4: Global Chocolate Market Volume K Tons Forecast, by Confectionery Variant 2019 & 2032
- Table 5: Global Chocolate Market Revenue Million Forecast, by Distribution Channel 2019 & 2032
- Table 6: Global Chocolate Market Volume K Tons Forecast, by Distribution Channel 2019 & 2032
- Table 7: Global Chocolate Market Revenue Million Forecast, by Region 2019 & 2032
- Table 8: Global Chocolate Market Volume K Tons Forecast, by Region 2019 & 2032
- Table 9: Global Chocolate Market Revenue Million Forecast, by Country 2019 & 2032
- Table 10: Global Chocolate Market Volume K Tons Forecast, by Country 2019 & 2032
- Table 11: Middle East Chocolate Market Revenue (Million) Forecast, by Application 2019 & 2032
- Table 12: Middle East Chocolate Market Volume (K Tons) Forecast, by Application 2019 & 2032
- Table 13: Africa Chocolate Market Revenue (Million) Forecast, by Application 2019 & 2032
- Table 14: Africa Chocolate Market Volume (K Tons) Forecast, by Application 2019 & 2032
- Table 15: Global Chocolate Market Revenue Million Forecast, by Country 2019 & 2032
- Table 16: Global Chocolate Market Volume K Tons Forecast, by Country 2019 & 2032
- Table 17: United States Chocolate Market Revenue (Million) Forecast, by Application 2019 & 2032
- Table 18: United States Chocolate Market Volume (K Tons) Forecast, by Application 2019 & 2032
- Table 19: Canada Chocolate Market Revenue (Million) Forecast, by Application 2019 & 2032
- Table 20: Canada Chocolate Market Volume (K Tons) Forecast, by Application 2019 & 2032
- Table 21: Mexico Chocolate Market Revenue (Million) Forecast, by Application 2019 & 2032
- Table 22: Mexico Chocolate Market Volume (K Tons) Forecast, by Application 2019 & 2032
- Table 23: Rest of North America Chocolate Market Revenue (Million) Forecast, by Application 2019 & 2032
- Table 24: Rest of North America Chocolate Market Volume (K Tons) Forecast, by Application 2019 & 2032
- Table 25: Global Chocolate Market Revenue Million Forecast, by Country 2019 & 2032
- Table 26: Global Chocolate Market Volume K Tons Forecast, by Country 2019 & 2032
- Table 27: China Chocolate Market Revenue (Million) Forecast, by Application 2019 & 2032
- Table 28: China Chocolate Market Volume (K Tons) Forecast, by Application 2019 & 2032
- Table 29: Japan Chocolate Market Revenue (Million) Forecast, by Application 2019 & 2032
- Table 30: Japan Chocolate Market Volume (K Tons) Forecast, by Application 2019 & 2032
- Table 31: India Chocolate Market Revenue (Million) Forecast, by Application 2019 & 2032
- Table 32: India Chocolate Market Volume (K Tons) Forecast, by Application 2019 & 2032
- Table 33: South Korea Chocolate Market Revenue (Million) Forecast, by Application 2019 & 2032
- Table 34: South Korea Chocolate Market Volume (K Tons) Forecast, by Application 2019 & 2032
- Table 35: Taiwan Chocolate Market Revenue (Million) Forecast, by Application 2019 & 2032
- Table 36: Taiwan Chocolate Market Volume (K Tons) Forecast, by Application 2019 & 2032
- Table 37: Australia Chocolate Market Revenue (Million) Forecast, by Application 2019 & 2032
- Table 38: Australia Chocolate Market Volume (K Tons) Forecast, by Application 2019 & 2032
- Table 39: Rest of Asia-Pacific Chocolate Market Revenue (Million) Forecast, by Application 2019 & 2032
- Table 40: Rest of Asia-Pacific Chocolate Market Volume (K Tons) Forecast, by Application 2019 & 2032
- Table 41: Global Chocolate Market Revenue Million Forecast, by Country 2019 & 2032
- Table 42: Global Chocolate Market Volume K Tons Forecast, by Country 2019 & 2032
- Table 43: Germany Chocolate Market Revenue (Million) Forecast, by Application 2019 & 2032
- Table 44: Germany Chocolate Market Volume (K Tons) Forecast, by Application 2019 & 2032
- Table 45: Global Chocolate Market Revenue Million Forecast, by Country 2019 & 2032
- Table 46: Global Chocolate Market Volume K Tons Forecast, by Country 2019 & 2032
- Table 47: Brazil Chocolate Market Revenue (Million) Forecast, by Application 2019 & 2032
- Table 48: Brazil Chocolate Market Volume (K Tons) Forecast, by Application 2019 & 2032
- Table 49: Argentina Chocolate Market Revenue (Million) Forecast, by Application 2019 & 2032
- Table 50: Argentina Chocolate Market Volume (K Tons) Forecast, by Application 2019 & 2032
- Table 51: Rest of South America Chocolate Market Revenue (Million) Forecast, by Application 2019 & 2032
- Table 52: Rest of South America Chocolate Market Volume (K Tons) Forecast, by Application 2019 & 2032
- Table 53: Global Chocolate Market Revenue Million Forecast, by Confectionery Variant 2019 & 2032
- Table 54: Global Chocolate Market Volume K Tons Forecast, by Confectionery Variant 2019 & 2032
- Table 55: Global Chocolate Market Revenue Million Forecast, by Distribution Channel 2019 & 2032
- Table 56: Global Chocolate Market Volume K Tons Forecast, by Distribution Channel 2019 & 2032
- Table 57: Global Chocolate Market Revenue Million Forecast, by Country 2019 & 2032
- Table 58: Global Chocolate Market Volume K Tons Forecast, by Country 2019 & 2032
- Table 59: United States Chocolate Market Revenue (Million) Forecast, by Application 2019 & 2032
- Table 60: United States Chocolate Market Volume (K Tons) Forecast, by Application 2019 & 2032
- Table 61: Canada Chocolate Market Revenue (Million) Forecast, by Application 2019 & 2032
- Table 62: Canada Chocolate Market Volume (K Tons) Forecast, by Application 2019 & 2032
- Table 63: Mexico Chocolate Market Revenue (Million) Forecast, by Application 2019 & 2032
- Table 64: Mexico Chocolate Market Volume (K Tons) Forecast, by Application 2019 & 2032
- Table 65: Global Chocolate Market Revenue Million Forecast, by Confectionery Variant 2019 & 2032
- Table 66: Global Chocolate Market Volume K Tons Forecast, by Confectionery Variant 2019 & 2032
- Table 67: Global Chocolate Market Revenue Million Forecast, by Distribution Channel 2019 & 2032
- Table 68: Global Chocolate Market Volume K Tons Forecast, by Distribution Channel 2019 & 2032
- Table 69: Global Chocolate Market Revenue Million Forecast, by Country 2019 & 2032
- Table 70: Global Chocolate Market Volume K Tons Forecast, by Country 2019 & 2032
- Table 71: Brazil Chocolate Market Revenue (Million) Forecast, by Application 2019 & 2032
- Table 72: Brazil Chocolate Market Volume (K Tons) Forecast, by Application 2019 & 2032
- Table 73: Argentina Chocolate Market Revenue (Million) Forecast, by Application 2019 & 2032
- Table 74: Argentina Chocolate Market Volume (K Tons) Forecast, by Application 2019 & 2032
- Table 75: Rest of South America Chocolate Market Revenue (Million) Forecast, by Application 2019 & 2032
- Table 76: Rest of South America Chocolate Market Volume (K Tons) Forecast, by Application 2019 & 2032
- Table 77: Global Chocolate Market Revenue Million Forecast, by Confectionery Variant 2019 & 2032
- Table 78: Global Chocolate Market Volume K Tons Forecast, by Confectionery Variant 2019 & 2032
- Table 79: Global Chocolate Market Revenue Million Forecast, by Distribution Channel 2019 & 2032
- Table 80: Global Chocolate Market Volume K Tons Forecast, by Distribution Channel 2019 & 2032
- Table 81: Global Chocolate Market Revenue Million Forecast, by Country 2019 & 2032
- Table 82: Global Chocolate Market Volume K Tons Forecast, by Country 2019 & 2032
- Table 83: United Kingdom Chocolate Market Revenue (Million) Forecast, by Application 2019 & 2032
- Table 84: United Kingdom Chocolate Market Volume (K Tons) Forecast, by Application 2019 & 2032
- Table 85: Germany Chocolate Market Revenue (Million) Forecast, by Application 2019 & 2032
- Table 86: Germany Chocolate Market Volume (K Tons) Forecast, by Application 2019 & 2032
- Table 87: France Chocolate Market Revenue (Million) Forecast, by Application 2019 & 2032
- Table 88: France Chocolate Market Volume (K Tons) Forecast, by Application 2019 & 2032
- Table 89: Italy Chocolate Market Revenue (Million) Forecast, by Application 2019 & 2032
- Table 90: Italy Chocolate Market Volume (K Tons) Forecast, by Application 2019 & 2032
- Table 91: Spain Chocolate Market Revenue (Million) Forecast, by Application 2019 & 2032
- Table 92: Spain Chocolate Market Volume (K Tons) Forecast, by Application 2019 & 2032
- Table 93: Russia Chocolate Market Revenue (Million) Forecast, by Application 2019 & 2032
- Table 94: Russia Chocolate Market Volume (K Tons) Forecast, by Application 2019 & 2032
- Table 95: Benelux Chocolate Market Revenue (Million) Forecast, by Application 2019 & 2032
- Table 96: Benelux Chocolate Market Volume (K Tons) Forecast, by Application 2019 & 2032
- Table 97: Nordics Chocolate Market Revenue (Million) Forecast, by Application 2019 & 2032
- Table 98: Nordics Chocolate Market Volume (K Tons) Forecast, by Application 2019 & 2032
- Table 99: Rest of Europe Chocolate Market Revenue (Million) Forecast, by Application 2019 & 2032
- Table 100: Rest of Europe Chocolate Market Volume (K Tons) Forecast, by Application 2019 & 2032
- Table 101: Global Chocolate Market Revenue Million Forecast, by Confectionery Variant 2019 & 2032
- Table 102: Global Chocolate Market Volume K Tons Forecast, by Confectionery Variant 2019 & 2032
- Table 103: Global Chocolate Market Revenue Million Forecast, by Distribution Channel 2019 & 2032
- Table 104: Global Chocolate Market Volume K Tons Forecast, by Distribution Channel 2019 & 2032
- Table 105: Global Chocolate Market Revenue Million Forecast, by Country 2019 & 2032
- Table 106: Global Chocolate Market Volume K Tons Forecast, by Country 2019 & 2032
- Table 107: Turkey Chocolate Market Revenue (Million) Forecast, by Application 2019 & 2032
- Table 108: Turkey Chocolate Market Volume (K Tons) Forecast, by Application 2019 & 2032
- Table 109: Israel Chocolate Market Revenue (Million) Forecast, by Application 2019 & 2032
- Table 110: Israel Chocolate Market Volume (K Tons) Forecast, by Application 2019 & 2032
- Table 111: GCC Chocolate Market Revenue (Million) Forecast, by Application 2019 & 2032
- Table 112: GCC Chocolate Market Volume (K Tons) Forecast, by Application 2019 & 2032
- Table 113: North Africa Chocolate Market Revenue (Million) Forecast, by Application 2019 & 2032
- Table 114: North Africa Chocolate Market Volume (K Tons) Forecast, by Application 2019 & 2032
- Table 115: South Africa Chocolate Market Revenue (Million) Forecast, by Application 2019 & 2032
- Table 116: South Africa Chocolate Market Volume (K Tons) Forecast, by Application 2019 & 2032
- Table 117: Rest of Middle East & Africa Chocolate Market Revenue (Million) Forecast, by Application 2019 & 2032
- Table 118: Rest of Middle East & Africa Chocolate Market Volume (K Tons) Forecast, by Application 2019 & 2032
- Table 119: Global Chocolate Market Revenue Million Forecast, by Confectionery Variant 2019 & 2032
- Table 120: Global Chocolate Market Volume K Tons Forecast, by Confectionery Variant 2019 & 2032
- Table 121: Global Chocolate Market Revenue Million Forecast, by Distribution Channel 2019 & 2032
- Table 122: Global Chocolate Market Volume K Tons Forecast, by Distribution Channel 2019 & 2032
- Table 123: Global Chocolate Market Revenue Million Forecast, by Country 2019 & 2032
- Table 124: Global Chocolate Market Volume K Tons Forecast, by Country 2019 & 2032
- Table 125: China Chocolate Market Revenue (Million) Forecast, by Application 2019 & 2032
- Table 126: China Chocolate Market Volume (K Tons) Forecast, by Application 2019 & 2032
- Table 127: India Chocolate Market Revenue (Million) Forecast, by Application 2019 & 2032
- Table 128: India Chocolate Market Volume (K Tons) Forecast, by Application 2019 & 2032
- Table 129: Japan Chocolate Market Revenue (Million) Forecast, by Application 2019 & 2032
- Table 130: Japan Chocolate Market Volume (K Tons) Forecast, by Application 2019 & 2032
- Table 131: South Korea Chocolate Market Revenue (Million) Forecast, by Application 2019 & 2032
- Table 132: South Korea Chocolate Market Volume (K Tons) Forecast, by Application 2019 & 2032
- Table 133: ASEAN Chocolate Market Revenue (Million) Forecast, by Application 2019 & 2032
- Table 134: ASEAN Chocolate Market Volume (K Tons) Forecast, by Application 2019 & 2032
- Table 135: Oceania Chocolate Market Revenue (Million) Forecast, by Application 2019 & 2032
- Table 136: Oceania Chocolate Market Volume (K Tons) Forecast, by Application 2019 & 2032
- Table 137: Rest of Asia Pacific Chocolate Market Revenue (Million) Forecast, by Application 2019 & 2032
- Table 138: Rest of Asia Pacific Chocolate Market Volume (K Tons) Forecast, by Application 2019 & 2032
Frequently Asked Questions
1. What is the projected Compound Annual Growth Rate (CAGR) of the Chocolate Market?
The projected CAGR is approximately 5.45%.
2. Which companies are prominent players in the Chocolate Market?
Key companies in the market include Cargill Incorporated, Nestlé SA, Chocoladefabriken Lindt & Sprüngli AG, Morinaga & Co Ltd, August Storck KG, Ferrero International SA, Mars Incorporated, Yıldız Holding A, Arcor S A I C, Lotte Corporation, Barry callebaut AG, Mondelēz International Inc, Meiji Holdings Company Ltd, ITC Limited, The Hershey Company.
3. What are the main segments of the Chocolate Market?
The market segments include Confectionery Variant, Distribution Channel.
4. Can you provide details about the market size?
The market size is estimated to be USD 119230 Million as of 2022.
5. What are some drivers contributing to market growth?
Increasing demand for meat alternatives.
6. What are the notable trends driving market growth?
OTHER KEY INDUSTRY TRENDS COVERED IN THE REPORT.
7. Are there any restraints impacting market growth?
Presence of numerous alternatives in the plant proteins.
8. Can you provide examples of recent developments in the market?
August 2023: Lotte Corporation partnered with DLT Labs to promote sustainability and ethical practices in the cacao bean supply chain. Lotte is commencing its pilot project on the traceability of cacao beans from Ghana and child labor monitoring using blockchain technology.July 2023: Ferrero's sister company, Ferrara Candy Co., announced the acquisition of Brazilian snacks company Dori Alimentos, which sells a variety of chocolate and sugar confectionery brands, including Dori, Pettiz, and Jubes.February 2023: The Hershey Company launched limited-edition chocolate bars to honor the celebration of International Women’s Day.
9. What pricing options are available for accessing the report?
Pricing options include single-user, multi-user, and enterprise licenses priced at USD 3800, USD 4500, and USD 5800 respectively.
10. Is the market size provided in terms of value or volume?
The market size is provided in terms of value, measured in Million and volume, measured in K Tons.
11. Are there any specific market keywords associated with the report?
Yes, the market keyword associated with the report is "Chocolate Market," which aids in identifying and referencing the specific market segment covered.
12. How do I determine which pricing option suits my needs best?
The pricing options vary based on user requirements and access needs. Individual users may opt for single-user licenses, while businesses requiring broader access may choose multi-user or enterprise licenses for cost-effective access to the report.
13. Are there any additional resources or data provided in the Chocolate Market report?
While the report offers comprehensive insights, it's advisable to review the specific contents or supplementary materials provided to ascertain if additional resources or data are available.
14. How can I stay updated on further developments or reports in the Chocolate Market?
To stay informed about further developments, trends, and reports in the Chocolate Market, consider subscribing to industry newsletters, following relevant companies and organizations, or regularly checking reputable industry news sources and publications.
Methodology
Step 1 - Identification of Relevant Samples Size from Population Database


Step 2 - Approaches for Defining Global Market Size (Value, Volume* & Price*)

Note*: In applicable scenarios
Step 3 - Data Sources
Primary Research
- Web Analytics
- Survey Reports
- Research Institute
- Latest Research Reports
- Opinion Leaders
Secondary Research
- Annual Reports
- White Paper
- Latest Press Release
- Industry Association
- Paid Database
- Investor Presentations

Step 4 - Data Triangulation
Involves using different sources of information in order to increase the validity of a study
These sources are likely to be stakeholders in a program - participants, other researchers, program staff, other community members, and so on.
Then we put all data in single framework & apply various statistical tools to find out the dynamic on the market.
During the analysis stage, feedback from the stakeholder groups would be compared to determine areas of agreement as well as areas of divergence


