

Key Insights
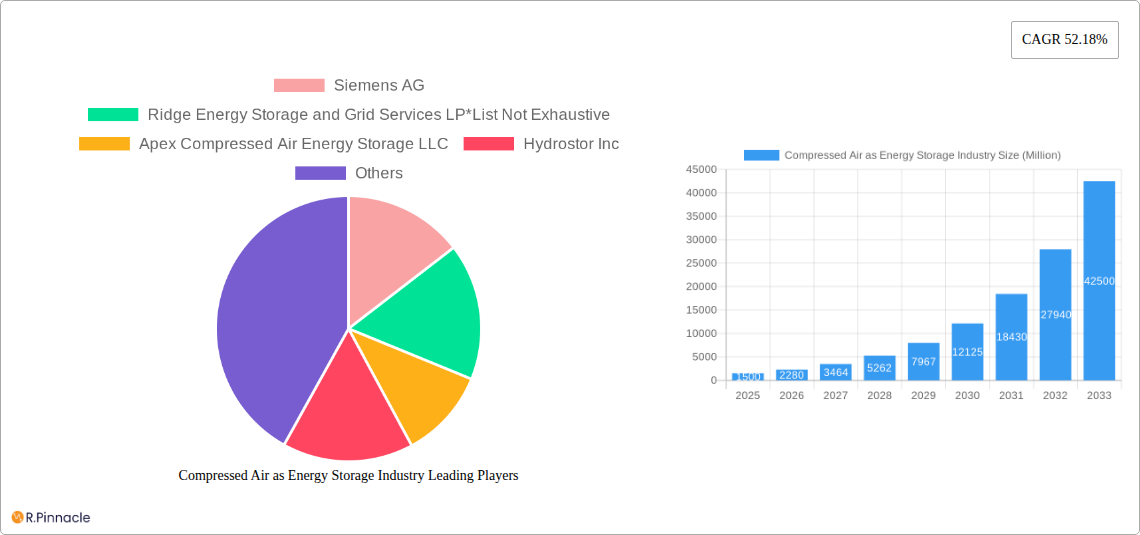
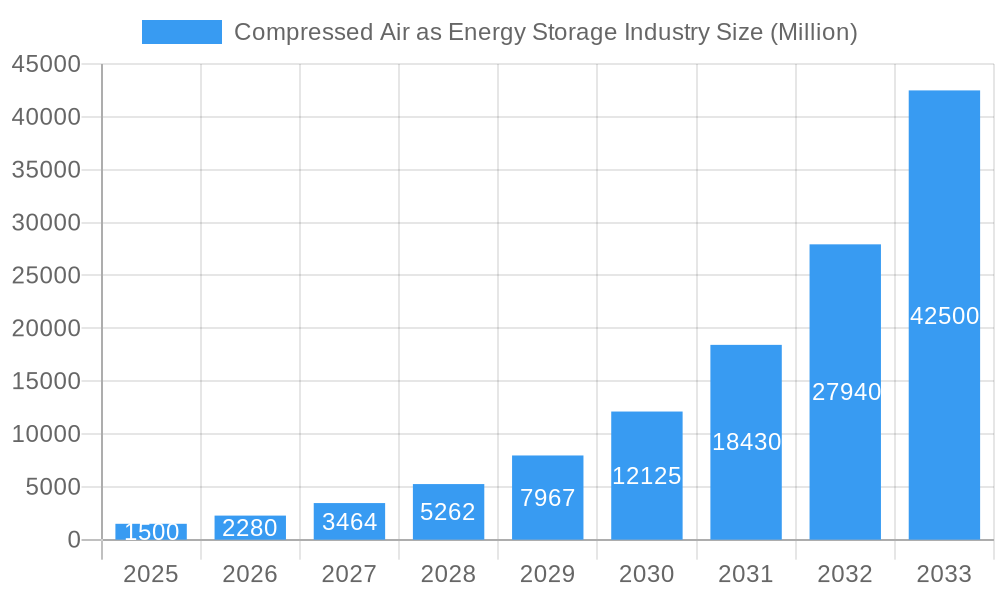
The compressed air energy storage (CAES) market is experiencing explosive growth, projected to reach a significant market size by 2033. A compound annual growth rate (CAGR) of 52.18% from 2025 to 2033 signifies substantial investor interest and technological advancements driving market expansion. Key drivers include the increasing need for grid stabilization and renewable energy integration, particularly in regions with intermittent solar and wind power sources. The rising demand for reliable and efficient energy storage solutions, coupled with the declining cost of CAES technologies, is further fueling market growth. While the technology is still relatively nascent compared to other energy storage solutions like batteries, advancements in compression and expansion technologies, along with improved system efficiency, are overcoming initial cost and efficiency barriers. Market segmentation reveals strong demand across adiabatic, diabatic, and isothermal CAES systems, catering to diverse energy storage needs and application scenarios. Leading companies like Siemens AG and others are actively investing in research and development, leading to innovative solutions and further driving market penetration. Geographic expansion is also a key factor, with North America, Europe, and Asia Pacific showing substantial growth potential due to favorable government policies, strong renewable energy adoption rates, and supportive investment landscapes. Growth in these regions will likely outpace the expansion observed in South America and the Middle East and Africa regions due to differences in market maturity and technological adoption.
Compressed Air as Energy Storage Industry Market Size (In Billion)
The restraints to CAES market growth are primarily centered around the high initial capital expenditure associated with plant construction and the relatively high operational costs compared to some alternative storage technologies. Land requirements and potential environmental concerns surrounding compressed air storage also pose challenges. However, ongoing research into improved efficiency, reduced environmental impact, and innovative financing models are mitigating these concerns. The future of CAES looks bright, with its potential to provide large-scale, long-duration energy storage solutions complementing intermittent renewable energy sources and bolstering grid stability globally. The market's continued expansion is highly likely, driven by technological innovation, supportive government policies, and the imperative to achieve a more sustainable and reliable energy future.
Compressed Air as Energy Storage Industry Company Market Share
Compressed Air Energy Storage Market Report: 2019-2033
This comprehensive report provides an in-depth analysis of the compressed air energy storage (CAES) market, offering invaluable insights for industry professionals, investors, and strategic decision-makers. The study period covers 2019-2033, with 2025 as the base and estimated year. The report forecasts market trends from 2025 to 2033, utilizing data from the historical period of 2019-2024. Expect detailed analysis across various segments, including Adiabatic, Diabatic, and Isothermal CAES systems, revealing market size projections in Millions.
Compressed Air as Energy Storage Industry Market Structure & Innovation Trends
This section analyzes the competitive landscape of the CAES market, examining market concentration, innovation drivers, regulatory influences, and the impact of substitute technologies. The report assesses the market share of key players, including but not limited to Siemens AG, Ridge Energy Storage and Grid Services LP, Apex Compressed Air Energy Storage LLC, and Hydrostor Inc. It further explores mergers and acquisitions (M&A) activity within the sector, quantifying deal values (in Millions) where available. The analysis includes a detailed examination of end-user demographics and their impact on market growth. For example, the increasing adoption of renewable energy sources is a key driver, creating a significant demand for efficient energy storage solutions like CAES. Furthermore, the report delves into the regulatory frameworks impacting CAES deployment, analyzing their influence on market growth and investment decisions. The competitive dynamics are explored, considering factors like technological innovation and the entry of new players. The overall market concentration is assessed, with insights into the dominance of specific players and the overall level of competition. The analysis also considers the role of substitute technologies, assessing their potential impact on the CAES market’s future growth. The report details the value of M&A deals in the sector, offering a clearer picture of the investment landscape. For example, xx Million in M&A activity was observed between 2020-2024, showcasing strong investment interest.
Compressed Air as Energy Storage Industry Market Dynamics & Trends
This section examines the key factors driving market growth, including technological advancements, evolving consumer preferences, and competitive dynamics. The report presents a detailed analysis of the Compound Annual Growth Rate (CAGR) and market penetration rate for the forecast period (2025-2033). Key growth drivers, such as government incentives for renewable energy integration, increasing demand for grid stability, and cost reductions in CAES technology, are explored. Technological disruptions, such as the development of novel CAES systems with improved efficiency and reduced operational costs, are also analyzed. The influence of consumer preferences, particularly the rising preference for sustainable energy solutions, is examined. Competitive dynamics are assessed, highlighting the strategies adopted by key players to gain market share. The report considers the impact of factors such as technological innovation, pricing strategies, and marketing efforts on the competitive landscape. The report projects a CAGR of xx% for the CAES market between 2025 and 2033, with market penetration expected to reach xx% by 2033.
Dominant Regions & Segments in Compressed Air as Energy Storage Industry
This section identifies the leading regions and segments (Adiabatic, Diabatic, Isothermal) within the CAES market. The analysis provides a detailed explanation of the factors contributing to the dominance of specific regions and segments.
Key Drivers of Regional Dominance:
- Favorable government policies and regulations supporting renewable energy integration.
- Availability of substantial funding and investments for CAES projects.
- Presence of a robust and well-developed energy infrastructure.
- High demand for energy storage solutions from various sectors.
Segment-Specific Analysis:
- Adiabatic: This segment's dominance is analyzed, considering factors such as efficiency, cost-effectiveness, and suitability for various applications.
- Diabatic: This segment's market share and growth drivers are investigated, detailing its unique advantages and limitations.
- Isothermal: The report explores the market position of this segment, highlighting its specific applications and competitive advantages.
The report concludes with a detailed analysis explaining the reasons behind the regional and segmental dominance, providing actionable insights for stakeholders. For example, North America is expected to dominate the market due to the increasing adoption of renewable energy and supportive government policies, while the Adiabatic segment is projected to hold the largest market share due to its high efficiency and cost-effectiveness.
Compressed Air as Energy Storage Industry Product Innovations
Recent product developments in the CAES industry focus on improving efficiency, reducing costs, and expanding applications. Innovations include advanced compression and expansion technologies, improved energy storage materials, and integrated control systems. These advancements enhance the competitiveness of CAES systems, offering improved performance and a better fit for various energy storage applications, addressing the growing need for reliable and cost-effective energy storage solutions.
Report Scope & Segmentation Analysis
This report segments the CAES market based on type: Adiabatic, Diabatic, and Isothermal. Each segment is analyzed in detail, offering insights into market size, growth projections, and competitive dynamics.
- Adiabatic CAES: This segment is characterized by high efficiency and is expected to experience significant growth driven by its suitability for large-scale energy storage applications.
- Diabatic CAES: This segment presents a lower cost solution but with potentially lower overall efficiency. The report analyses its market position and growth potential.
- Isothermal CAES: This segment offers unique advantages in specific applications, and the report details its market share and growth prospects.
Key Drivers of Compressed Air as Energy Storage Industry Growth
The growth of the CAES market is fueled by several factors. The increasing integration of renewable energy sources, coupled with the need for grid stabilization and enhanced energy reliability, drives the demand for efficient energy storage. Government policies and incentives promoting renewable energy adoption play a significant role. Furthermore, ongoing technological advancements are improving the efficiency and cost-effectiveness of CAES systems, making them a more attractive option.
Challenges in the Compressed Air as Energy Storage Industry Sector
The CAES industry faces challenges including high initial capital costs, limited scalability in some configurations, and the need for substantial land areas for deployment. Regulatory hurdles and potential supply chain disruptions can also impact market growth. Competition from other energy storage technologies also creates pressure on market share. For example, the high initial capital investment required for CAES projects represents a significant barrier to entry for smaller companies.
Emerging Opportunities in Compressed Air as Energy Storage Industry
Emerging opportunities include the integration of CAES with other renewable energy technologies, such as solar and wind power. Advancements in energy storage materials and control systems offer opportunities to improve efficiency and reduce costs. Growing demand for energy storage solutions in remote areas presents new market opportunities. The development of smaller-scale CAES systems could expand applications and overcome the limitation of large land requirements.
Leading Players in the Compressed Air as Energy Storage Industry Market
- Siemens AG
- Ridge Energy Storage and Grid Services LP
- Apex Compressed Air Energy Storage LLC
- Hydrostor Inc
Key Developments in Compressed Air as Energy Storage Industry Industry
- 2022 Q4: Siemens AG announced a new partnership for the development of a large-scale CAES project.
- 2023 Q1: Ridge Energy Storage and Grid Services LP successfully completed a pilot project demonstrating enhanced efficiency in CAES technology.
- 2024 Q2: Hydrostor Inc secured funding for a significant expansion of their CAES projects. (Further developments to be added)
Future Outlook for Compressed Air as Energy Storage Industry Market
The future of the CAES market looks promising, driven by ongoing technological advancements, supportive government policies, and the growing demand for reliable and sustainable energy storage solutions. Increased investment in research and development will further improve the efficiency and cost-effectiveness of CAES systems, expanding their market applications. The market is projected to witness significant growth in the coming years, driven by the increasing need for grid stability and the growing adoption of renewable energy sources.
Compressed Air as Energy Storage Industry Segmentation
-
1. Type
- 1.1. Adiabatic
- 1.2. Diabatic
- 1.3. Isothermal
Compressed Air as Energy Storage Industry Segmentation By Geography
- 1. North America
- 2. Europe
- 3. Asia Pacific
- 4. Rest of the World
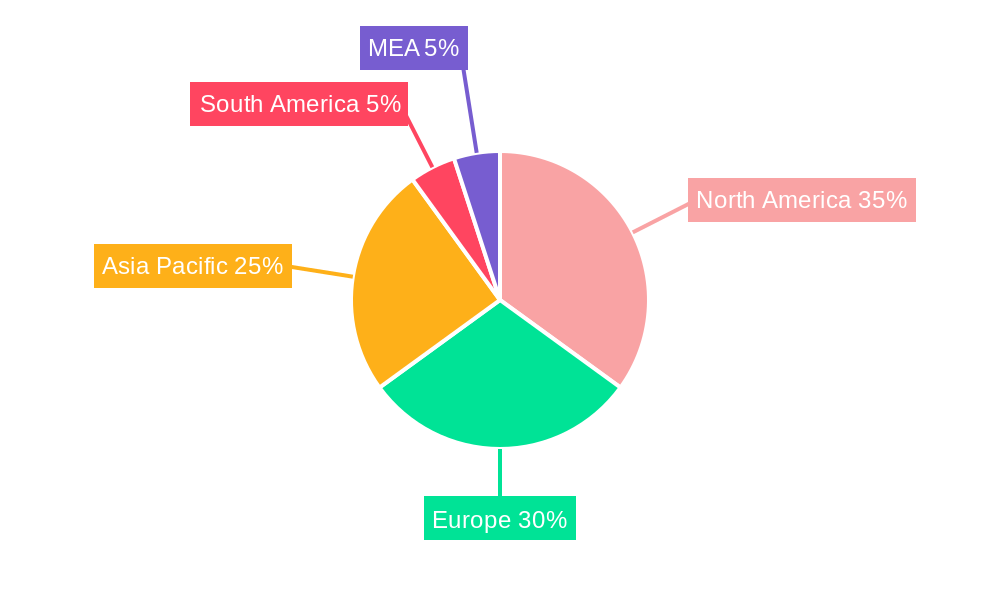
Compressed Air as Energy Storage Industry Regional Market Share
Geographic Coverage of Compressed Air as Energy Storage Industry
Compressed Air as Energy Storage Industry REPORT HIGHLIGHTS
| Aspects | Details |
|---|---|
| Study Period | 2020-2034 |
| Base Year | 2025 |
| Estimated Year | 2026 |
| Forecast Period | 2026-2034 |
| Historical Period | 2020-2025 |
| Growth Rate | CAGR of 31.4% from 2020-2034 |
| Segmentation |
|
Table of Contents
- 1. Introduction
- 1.1. Research Scope
- 1.2. Market Segmentation
- 1.3. Research Objective
- 1.4. Definitions and Assumptions
- 2. Executive Summary
- 2.1. Market Snapshot
- 3. Market Dynamics
- 3.1. Market Drivers
- 3.2. Market Restrains
- 3.3. Market Trends
- 3.4. Market Opportunities
- 4. Market Factor Analysis
- 4.1. Porters Five Forces
- 4.1.1. Bargaining Power of Suppliers
- 4.1.2. Bargaining Power of Buyers
- 4.1.3. Threat of New Entrants
- 4.1.4. Threat of Substitutes
- 4.1.5. Competitive Rivalry
- 4.2. PESTEL analysis
- 4.3. BCG Analysis
- 4.3.1. Stars (High Growth, High Market Share)
- 4.3.2. Cash Cows (Low Growth, High Market Share)
- 4.3.3. Question Mark (High Growth, Low Market Share)
- 4.3.4. Dogs (Low Growth, Low Market Share)
- 4.4. Ansoff Matrix Analysis
- 4.5. Supply Chain Analysis
- 4.6. Regulatory Landscape
- 4.7. Current Market Potential and Opportunity Assessment (TAM–SAM–SOM Framework)
- 4.8. PRI Analyst Note
- 4.1. Porters Five Forces
- 5. Market Analysis, Insights and Forecast 2021-2033
- 5.1. Market Analysis, Insights and Forecast - by Type
- 5.1.1. Adiabatic
- 5.1.2. Diabatic
- 5.1.3. Isothermal
- 5.2. Market Analysis, Insights and Forecast - by Region
- 5.2.1. North America
- 5.2.2. Europe
- 5.2.3. Asia Pacific
- 5.2.4. Rest of the World
- 5.1. Market Analysis, Insights and Forecast - by Type
- 6. Global Compressed Air as Energy Storage Industry Analysis, Insights and Forecast, 2021-2033
- 6.1. Market Analysis, Insights and Forecast - by Type
- 6.1.1. Adiabatic
- 6.1.2. Diabatic
- 6.1.3. Isothermal
- 6.1. Market Analysis, Insights and Forecast - by Type
- 7. North America Compressed Air as Energy Storage Industry Analysis, Insights and Forecast, 2020-2032
- 7.1. Market Analysis, Insights and Forecast - by Type
- 7.1.1. Adiabatic
- 7.1.2. Diabatic
- 7.1.3. Isothermal
- 7.1. Market Analysis, Insights and Forecast - by Type
- 8. Europe Compressed Air as Energy Storage Industry Analysis, Insights and Forecast, 2020-2032
- 8.1. Market Analysis, Insights and Forecast - by Type
- 8.1.1. Adiabatic
- 8.1.2. Diabatic
- 8.1.3. Isothermal
- 8.1. Market Analysis, Insights and Forecast - by Type
- 9. Asia Pacific Compressed Air as Energy Storage Industry Analysis, Insights and Forecast, 2020-2032
- 9.1. Market Analysis, Insights and Forecast - by Type
- 9.1.1. Adiabatic
- 9.1.2. Diabatic
- 9.1.3. Isothermal
- 9.1. Market Analysis, Insights and Forecast - by Type
- 10. Rest of the World Compressed Air as Energy Storage Industry Analysis, Insights and Forecast, 2020-2032
- 10.1. Market Analysis, Insights and Forecast - by Type
- 10.1.1. Adiabatic
- 10.1.2. Diabatic
- 10.1.3. Isothermal
- 10.1. Market Analysis, Insights and Forecast - by Type
- 11. Competitive Analysis
- 11.1. Company Profiles
- 11.1.1 Siemens AG
- 11.1.1.1. Company Overview
- 11.1.1.2. Products
- 11.1.1.3. Company Financials
- 11.1.1.4. SWOT Analysis
- 11.1.2 Ridge Energy Storage and Grid Services LP*List Not Exhaustive
- 11.1.2.1. Company Overview
- 11.1.2.2. Products
- 11.1.2.3. Company Financials
- 11.1.2.4. SWOT Analysis
- 11.1.3 Apex Compressed Air Energy Storage LLC
- 11.1.3.1. Company Overview
- 11.1.3.2. Products
- 11.1.3.3. Company Financials
- 11.1.3.4. SWOT Analysis
- 11.1.4 Hydrostor Inc
- 11.1.4.1. Company Overview
- 11.1.4.2. Products
- 11.1.4.3. Company Financials
- 11.1.4.4. SWOT Analysis
- 11.1.1 Siemens AG
- 11.2. Market Entropy
- 11.2.1 Company's Key Areas Served
- 11.2.2 Recent Developments
- 11.3. Company Market Share Analysis 2025
- 11.3.1 Top 5 Companies Market Share Analysis
- 11.3.2 Top 3 Companies Market Share Analysis
- 11.4. List of Potential Customers
- 12. Research Methodology
List of Figures
- Figure 1: Global Compressed Air as Energy Storage Industry Revenue Breakdown (billion, %) by Region 2025 & 2033
- Figure 2: North America Compressed Air as Energy Storage Industry Revenue (billion), by Type 2025 & 2033
- Figure 3: North America Compressed Air as Energy Storage Industry Revenue Share (%), by Type 2025 & 2033
- Figure 4: North America Compressed Air as Energy Storage Industry Revenue (billion), by Country 2025 & 2033
- Figure 5: North America Compressed Air as Energy Storage Industry Revenue Share (%), by Country 2025 & 2033
- Figure 6: Europe Compressed Air as Energy Storage Industry Revenue (billion), by Type 2025 & 2033
- Figure 7: Europe Compressed Air as Energy Storage Industry Revenue Share (%), by Type 2025 & 2033
- Figure 8: Europe Compressed Air as Energy Storage Industry Revenue (billion), by Country 2025 & 2033
- Figure 9: Europe Compressed Air as Energy Storage Industry Revenue Share (%), by Country 2025 & 2033
- Figure 10: Asia Pacific Compressed Air as Energy Storage Industry Revenue (billion), by Type 2025 & 2033
- Figure 11: Asia Pacific Compressed Air as Energy Storage Industry Revenue Share (%), by Type 2025 & 2033
- Figure 12: Asia Pacific Compressed Air as Energy Storage Industry Revenue (billion), by Country 2025 & 2033
- Figure 13: Asia Pacific Compressed Air as Energy Storage Industry Revenue Share (%), by Country 2025 & 2033
- Figure 14: Rest of the World Compressed Air as Energy Storage Industry Revenue (billion), by Type 2025 & 2033
- Figure 15: Rest of the World Compressed Air as Energy Storage Industry Revenue Share (%), by Type 2025 & 2033
- Figure 16: Rest of the World Compressed Air as Energy Storage Industry Revenue (billion), by Country 2025 & 2033
- Figure 17: Rest of the World Compressed Air as Energy Storage Industry Revenue Share (%), by Country 2025 & 2033
List of Tables
- Table 1: Global Compressed Air as Energy Storage Industry Revenue billion Forecast, by Type 2020 & 2033
- Table 2: Global Compressed Air as Energy Storage Industry Revenue billion Forecast, by Region 2020 & 2033
- Table 3: Global Compressed Air as Energy Storage Industry Revenue billion Forecast, by Type 2020 & 2033
- Table 4: Global Compressed Air as Energy Storage Industry Revenue billion Forecast, by Country 2020 & 2033
- Table 5: Global Compressed Air as Energy Storage Industry Revenue billion Forecast, by Type 2020 & 2033
- Table 6: Global Compressed Air as Energy Storage Industry Revenue billion Forecast, by Country 2020 & 2033
- Table 7: Global Compressed Air as Energy Storage Industry Revenue billion Forecast, by Type 2020 & 2033
- Table 8: Global Compressed Air as Energy Storage Industry Revenue billion Forecast, by Country 2020 & 2033
- Table 9: Global Compressed Air as Energy Storage Industry Revenue billion Forecast, by Type 2020 & 2033
- Table 10: Global Compressed Air as Energy Storage Industry Revenue billion Forecast, by Country 2020 & 2033
Frequently Asked Questions
1. What is the projected Compound Annual Growth Rate (CAGR) of the Compressed Air as Energy Storage Industry?
The projected CAGR is approximately 31.4%.
2. Which companies are prominent players in the Compressed Air as Energy Storage Industry?
Key companies in the market include Siemens AG, Ridge Energy Storage and Grid Services LP*List Not Exhaustive, Apex Compressed Air Energy Storage LLC, Hydrostor Inc.
3. What are the main segments of the Compressed Air as Energy Storage Industry?
The market segments include Type.
4. Can you provide details about the market size?
The market size is estimated to be USD 0.48 billion as of 2022.
5. What are some drivers contributing to market growth?
4.; Growing Oil and Gas Industry4.; Rapid Growth in the Industrial Sector.
6. What are the notable trends driving market growth?
Diabatic CAES Technology to Dominate the Market.
7. Are there any restraints impacting market growth?
4.; Fluctuation in Oil and Gas Prices.
8. Can you provide examples of recent developments in the market?
N/A
9. What pricing options are available for accessing the report?
Pricing options include single-user, multi-user, and enterprise licenses priced at USD 4750, USD 5250, and USD 8750 respectively.
10. Is the market size provided in terms of value or volume?
The market size is provided in terms of value, measured in billion.
11. Are there any specific market keywords associated with the report?
Yes, the market keyword associated with the report is "Compressed Air as Energy Storage Industry," which aids in identifying and referencing the specific market segment covered.
12. How do I determine which pricing option suits my needs best?
The pricing options vary based on user requirements and access needs. Individual users may opt for single-user licenses, while businesses requiring broader access may choose multi-user or enterprise licenses for cost-effective access to the report.
13. Are there any additional resources or data provided in the Compressed Air as Energy Storage Industry report?
While the report offers comprehensive insights, it's advisable to review the specific contents or supplementary materials provided to ascertain if additional resources or data are available.
14. How can I stay updated on further developments or reports in the Compressed Air as Energy Storage Industry?
To stay informed about further developments, trends, and reports in the Compressed Air as Energy Storage Industry, consider subscribing to industry newsletters, following relevant companies and organizations, or regularly checking reputable industry news sources and publications.
Methodology
Step 1 - Identification of Relevant Samples Size from Population Database


Step 2 - Approaches for Defining Global Market Size (Value, Volume* & Price*)

Note*: In applicable scenarios
Step 3 - Data Sources
Primary Research
- Web Analytics
- Survey Reports
- Research Institute
- Latest Research Reports
- Opinion Leaders
Secondary Research
- Annual Reports
- White Paper
- Latest Press Release
- Industry Association
- Paid Database
- Investor Presentations

Step 4 - Data Triangulation
Involves using different sources of information in order to increase the validity of a study
These sources are likely to be stakeholders in a program - participants, other researchers, program staff, other community members, and so on.
Then we put all data in single framework & apply various statistical tools to find out the dynamic on the market.
During the analysis stage, feedback from the stakeholder groups would be compared to determine areas of agreement as well as areas of divergence