
Key Insights
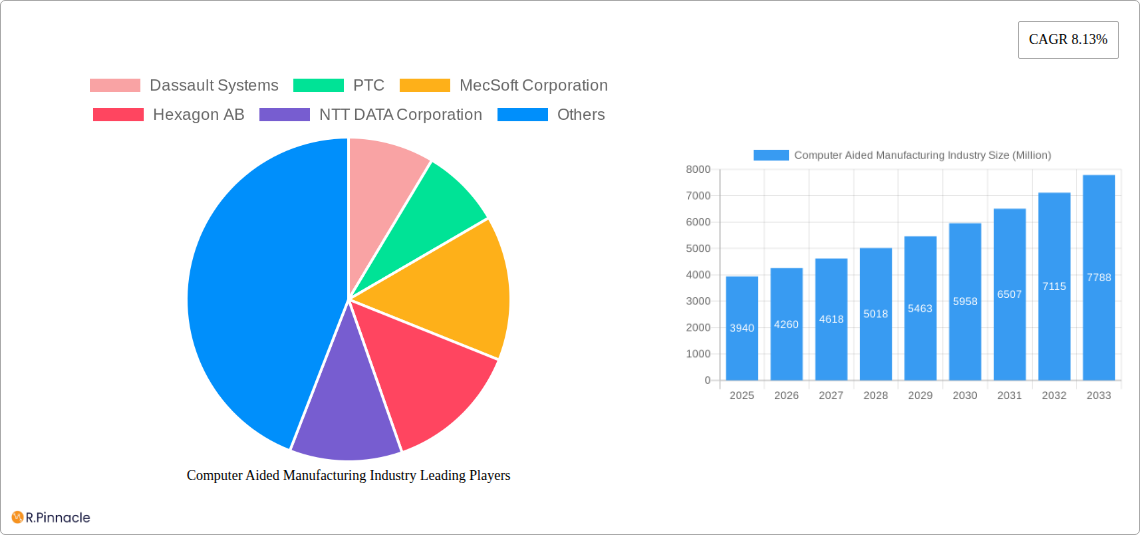
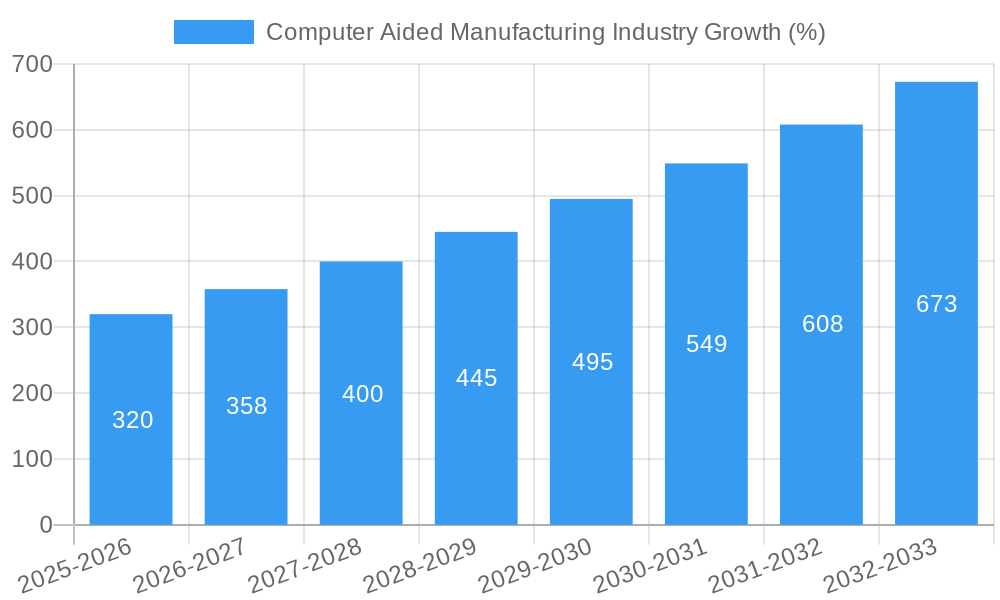
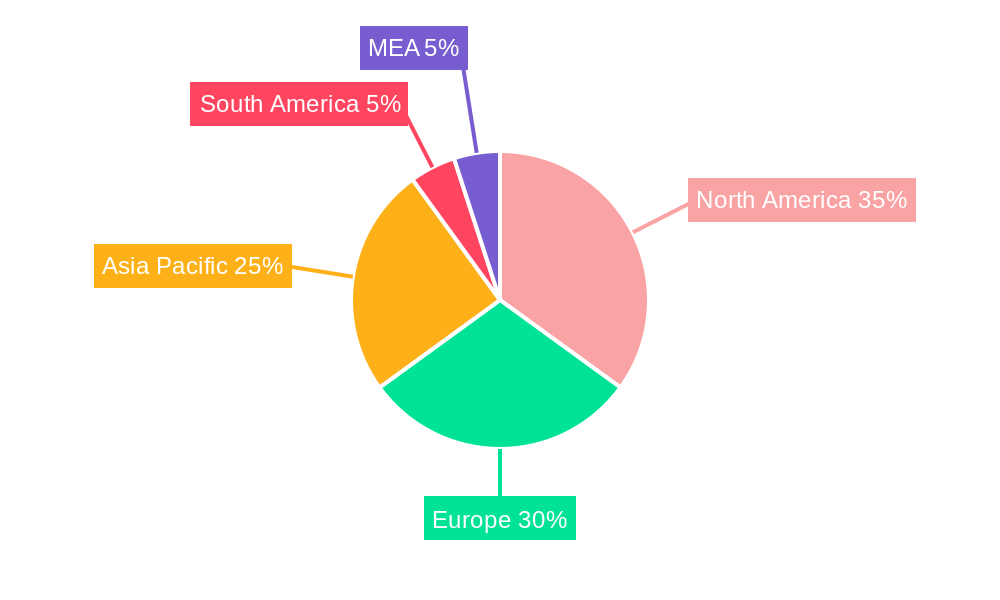
The Computer-Aided Manufacturing (CAM) industry is experiencing robust growth, projected to reach a market size of $3.94 billion in 2025, expanding at a Compound Annual Growth Rate (CAGR) of 8.13%. This expansion is fueled by several key drivers. The increasing adoption of Industry 4.0 technologies, including automation, IoT, and cloud computing, is significantly enhancing manufacturing efficiency and productivity, thereby driving demand for CAM software and services. Furthermore, the rising need for complex product designs and shorter product lifecycles necessitates advanced CAM solutions for optimized production processes. Growth in key end-user industries such as aerospace & defense, automotive, and medical devices, where precision and efficiency are paramount, further contributes to market expansion. While the market faces challenges like high initial investment costs for advanced CAM systems and the need for skilled labor to operate these systems, the long-term benefits of improved efficiency and reduced production costs outweigh these constraints. The competitive landscape is marked by established players like Dassault Systèmes, Autodesk, and Siemens AG, alongside specialized niche players focusing on specific industry segments or CAM functionalities. Geographical expansion is also a key trend, with North America and Europe currently leading the market, while Asia-Pacific is poised for significant growth driven by increasing industrialization and manufacturing activities in countries like China and India.
Looking ahead to 2033, the CAM market is expected to continue its upward trajectory. The increasing integration of artificial intelligence (AI) and machine learning (ML) in CAM software is anticipated to further revolutionize manufacturing processes by automating tasks, optimizing toolpaths, and improving overall quality control. This will lead to increased adoption across a wider range of industries and drive further market expansion. The continued focus on sustainability in manufacturing will also influence the market, with more emphasis on CAM solutions that optimize resource utilization and minimize waste. Regional growth will vary, with emerging economies experiencing faster growth rates than established markets. However, continued investment in research and development by both established and emerging players will ensure the market remains dynamic and innovative, leading to further value creation in the years to come.
Computer Aided Manufacturing (CAM) Industry Report: 2019-2033
This comprehensive report provides a detailed analysis of the Computer Aided Manufacturing (CAM) industry, offering invaluable insights for industry professionals, investors, and strategists. The study covers the period 2019-2033, with a focus on the 2025-2033 forecast period. We delve into market dynamics, technological advancements, key players, and emerging opportunities, providing a 360-degree view of this rapidly evolving sector. The report leverages USD Million for all revenue figures.
Computer Aided Manufacturing Industry Market Structure & Innovation Trends
The Computer Aided Manufacturing (CAM) market exhibits a moderately concentrated structure, with key players like Dassault Systèmes, PTC, and Autodesk Inc. holding significant market share. However, numerous specialized CAM software providers and system integrators contribute to a dynamic competitive landscape. Innovation is driven by the need for increased automation, improved efficiency, and enhanced design capabilities. Regulatory frameworks, particularly those related to data security and intellectual property, significantly impact industry operations. The market experiences continuous M&A activity, with deal values in the hundreds of millions of USD annually. Product substitutes, such as manual processes and legacy systems, are gradually being replaced by sophisticated CAM solutions, further shaping the market landscape. The end-user demographics encompass diverse industries, each exhibiting unique technological adoption rates and preferences. Key metrics analyzed include market concentration ratios (e.g., CR4, CR8), M&A deal values (xx Million USD annually), and average software license costs.
- Market Concentration: Moderately concentrated with key players holding significant share.
- Innovation Drivers: Automation, efficiency, and enhanced design capabilities.
- Regulatory Frameworks: Data security and intellectual property regulations.
- M&A Activity: Significant, with deal values reaching xx Million USD annually.
- End-User Demographics: Diverse industries with varying adoption rates.
Computer Aided Manufacturing Industry Market Dynamics & Trends
The CAM market is experiencing robust growth, driven by factors such as increasing adoption of Industry 4.0 technologies (e.g., IoT, AI, and cloud computing), rising demand for customized products, and the growing need for enhanced manufacturing efficiency. Technological disruptions, like the introduction of advanced simulation tools and generative design software, are reshaping the industry. Consumer preferences are shifting towards integrated, user-friendly solutions that streamline workflows and improve collaboration. Competitive dynamics are characterized by product differentiation, strategic alliances, and ongoing innovation. The Compound Annual Growth Rate (CAGR) is projected to be xx% during the forecast period, with significant market penetration anticipated in emerging economies. Specific examples of technological disruptions include the adoption of cloud-based CAM platforms and the integration of AI-powered optimization tools.
Dominant Regions & Segments in Computer Aided Manufacturing Industry
North America currently dominates the CAM market, followed by Europe and Asia-Pacific. This dominance is attributed to factors like strong technological infrastructure, a high concentration of manufacturing industries (especially aerospace and automotive), and robust government support for advanced manufacturing initiatives. Within end-user industries:
- Aerospace & Defense: This segment holds a significant market share due to the complex designs and stringent quality requirements. Revenue is estimated at xx Million USD in 2025, representing xx% of the total market. Key drivers include government spending and technological advancements.
- Automotive: The automotive segment is another major contributor, driven by the need for efficient production and customized vehicle designs. Revenue is estimated at xx Million USD in 2025, representing xx% of the total market. Key drivers include automation and lightweighting trends.
- Medical: This segment is experiencing rapid growth due to the increasing demand for precision-engineered medical devices. Revenue is estimated at xx Million USD in 2025, representing xx% of the total market. Key drivers include advanced materials and regulatory compliance.
- Energy & Utilities: This segment is driven by the need to optimize energy generation and distribution systems. Revenue is estimated at xx Million USD in 2025, representing xx% of the total market. Key drivers include renewable energy technologies.
- Other End-User Industries: This segment comprises various industries, including electronics, consumer goods, and industrial machinery. Revenue is estimated at xx Million USD in 2025, representing xx% of the total market.
Computer Aided Manufacturing Industry Product Innovations
Recent product innovations focus on integrating AI/ML capabilities for process optimization, cloud-based solutions for improved collaboration and accessibility, and enhanced simulation tools for virtual prototyping. These innovations are improving design efficiency, reducing production costs, and streamlining manufacturing workflows. The market is witnessing a growing demand for software solutions that seamlessly integrate with other enterprise systems, improving overall productivity and efficiency.
Report Scope & Segmentation Analysis
This report segments the CAM market by end-user industry: Aerospace & Defense, Automotive, Medical, Energy & Utilities, and Other End-User Industries. Each segment's market size (in USD Million), growth projections, and competitive dynamics are analyzed in detail. For example, the Aerospace & Defense segment is expected to experience significant growth due to increasing demand for high-precision components and complex designs. The Automotive segment will also see considerable growth driven by the increasing adoption of automation and the development of electric vehicles.
Key Drivers of Computer Aided Manufacturing Industry Growth
Technological advancements, such as the integration of AI and machine learning, and Industry 4.0 technologies, are significantly driving market growth. Economic factors, including increasing manufacturing output and investment in automation, play a crucial role. Favorable government policies and regulations also support industry expansion. For example, government initiatives promoting advanced manufacturing and Industry 4.0 adoption are boosting the adoption of CAM solutions.
Challenges in the Computer Aided Manufacturing Industry Sector
The industry faces challenges such as high initial investment costs for CAM software and hardware, the need for skilled labor, and the complexities of integrating various systems within a manufacturing environment. Supply chain disruptions can also negatively impact production and delivery timelines. Integration complexities are estimated to slow down market penetration by xx% in specific regions.
Emerging Opportunities in Computer Aided Manufacturing Industry
Emerging opportunities include the expansion into new markets, particularly in developing economies, and the growing adoption of additive manufacturing and Industry 4.0 technologies. The increasing focus on sustainability and circular economy principles presents opportunities for CAM software to optimize resource utilization and minimize waste. The development of specialized CAM solutions for niche industries (e.g., micro-manufacturing) also represents a significant growth potential.
Leading Players in the Computer Aided Manufacturing Industry Market
- Dassault Systèmes
- PTC
- MecSoft Corporation
- Hexagon AB
- NTT DATA Corporation
- Siemens AG
- SolidCAM Ltd
- OPEN MIND Technologies AG
- Autodesk Inc
- 3D Systems Inc
- BobCAD-CAM
- SmartCAMcnc
- ZWSOFTCO LTD (Guangzhou)
- HCL Technologies Limited
- CNC Software LLC (Mastercam)
Key Developments in Computer Aided Manufacturing Industry
- November 2023: Microlight3D launched Luminis software, a CAM software for micro-manufacturing, enabling 3D printing of objects 100x smaller than a hair strand. This significantly impacts the micro-robotics, microfluidics, and biotechnology sectors.
- May 2023: NVIDIA introduced NVIDIA Omniverse, a platform connecting CAD apps and AI frameworks for virtual factory creation and digital workflow optimization. This development accelerates digital transformation in manufacturing, improving efficiency and reducing errors.
Future Outlook for Computer Aided Manufacturing Industry Market
The future of the CAM market is promising, with continuous growth driven by technological advancements, increasing automation, and the expanding adoption of Industry 4.0 principles. Strategic opportunities lie in developing integrated solutions that leverage AI, machine learning, and cloud computing to improve efficiency, reduce costs, and enhance collaboration across the entire manufacturing value chain. The market is poised for significant growth, particularly in emerging economies and specialized niche applications.
Computer Aided Manufacturing Industry Segmentation
-
1. Deployment Model
- 1.1. On-Premises
- 1.2. Cloud-Based
-
2. End-User Industry
- 2.1. Aerospace & Defense
- 2.2. Automotive
- 2.3. Medical
- 2.4. Energy & Utilities
- 2.5. Other End-User Industries
Computer Aided Manufacturing Industry Segmentation By Geography
-
1. North America
- 1.1. United States
- 1.2. Canada
-
2. Europe
- 2.1. Germany
- 2.2. Switzerland
- 2.3. Spain
- 2.4. Austria
- 2.5. Belgium
- 2.6. Netherlands
- 2.7. United Kingdom
- 2.8. France
- 2.9. Italy
- 2.10. Sweden
- 2.11. Poland
-
3. Asia
- 3.1. China
- 3.2. Japan
- 3.3. South Korea
- 3.4. India
- 4. Australia and New Zealand
-
5. Latin America
- 5.1. Brazil
- 5.2. Mexico
-
6. Middle East and Africa
- 6.1. United Arab Emirates
- 6.2. Saudi Arabia
- 6.3. South Africa
Computer Aided Manufacturing Industry REPORT HIGHLIGHTS
| Aspects | Details |
|---|---|
| Study Period | 2019-2033 |
| Base Year | 2024 |
| Estimated Year | 2025 |
| Forecast Period | 2025-2033 |
| Historical Period | 2019-2024 |
| Growth Rate | CAGR of 8.13% from 2019-2033 |
| Segmentation |
|
Table of Contents
- 1. Introduction
- 1.1. Research Scope
- 1.2. Market Segmentation
- 1.3. Research Methodology
- 1.4. Definitions and Assumptions
- 2. Executive Summary
- 2.1. Introduction
- 3. Market Dynamics
- 3.1. Introduction
- 3.2. Market Drivers
- 3.2.1. Increasing Adoption of Industry 4.; Growing Utilization of CAM Software in the Packaging Machinery Sector
- 3.3. Market Restrains
- 3.3.1. Wide Availability of Open Source CAM Software
- 3.4. Market Trends
- 3.4.1. Automotive is Expected to Hold a Major Market Share
- 4. Market Factor Analysis
- 4.1. Porters Five Forces
- 4.2. Supply/Value Chain
- 4.3. PESTEL analysis
- 4.4. Market Entropy
- 4.5. Patent/Trademark Analysis
- 5. Global Computer Aided Manufacturing Industry Analysis, Insights and Forecast, 2019-2031
- 5.1. Market Analysis, Insights and Forecast - by Deployment Model
- 5.1.1. On-Premises
- 5.1.2. Cloud-Based
- 5.2. Market Analysis, Insights and Forecast - by End-User Industry
- 5.2.1. Aerospace & Defense
- 5.2.2. Automotive
- 5.2.3. Medical
- 5.2.4. Energy & Utilities
- 5.2.5. Other End-User Industries
- 5.3. Market Analysis, Insights and Forecast - by Region
- 5.3.1. North America
- 5.3.2. Europe
- 5.3.3. Asia
- 5.3.4. Australia and New Zealand
- 5.3.5. Latin America
- 5.3.6. Middle East and Africa
- 5.1. Market Analysis, Insights and Forecast - by Deployment Model
- 6. North America Computer Aided Manufacturing Industry Analysis, Insights and Forecast, 2019-2031
- 6.1. Market Analysis, Insights and Forecast - by Deployment Model
- 6.1.1. On-Premises
- 6.1.2. Cloud-Based
- 6.2. Market Analysis, Insights and Forecast - by End-User Industry
- 6.2.1. Aerospace & Defense
- 6.2.2. Automotive
- 6.2.3. Medical
- 6.2.4. Energy & Utilities
- 6.2.5. Other End-User Industries
- 6.1. Market Analysis, Insights and Forecast - by Deployment Model
- 7. Europe Computer Aided Manufacturing Industry Analysis, Insights and Forecast, 2019-2031
- 7.1. Market Analysis, Insights and Forecast - by Deployment Model
- 7.1.1. On-Premises
- 7.1.2. Cloud-Based
- 7.2. Market Analysis, Insights and Forecast - by End-User Industry
- 7.2.1. Aerospace & Defense
- 7.2.2. Automotive
- 7.2.3. Medical
- 7.2.4. Energy & Utilities
- 7.2.5. Other End-User Industries
- 7.1. Market Analysis, Insights and Forecast - by Deployment Model
- 8. Asia Computer Aided Manufacturing Industry Analysis, Insights and Forecast, 2019-2031
- 8.1. Market Analysis, Insights and Forecast - by Deployment Model
- 8.1.1. On-Premises
- 8.1.2. Cloud-Based
- 8.2. Market Analysis, Insights and Forecast - by End-User Industry
- 8.2.1. Aerospace & Defense
- 8.2.2. Automotive
- 8.2.3. Medical
- 8.2.4. Energy & Utilities
- 8.2.5. Other End-User Industries
- 8.1. Market Analysis, Insights and Forecast - by Deployment Model
- 9. Australia and New Zealand Computer Aided Manufacturing Industry Analysis, Insights and Forecast, 2019-2031
- 9.1. Market Analysis, Insights and Forecast - by Deployment Model
- 9.1.1. On-Premises
- 9.1.2. Cloud-Based
- 9.2. Market Analysis, Insights and Forecast - by End-User Industry
- 9.2.1. Aerospace & Defense
- 9.2.2. Automotive
- 9.2.3. Medical
- 9.2.4. Energy & Utilities
- 9.2.5. Other End-User Industries
- 9.1. Market Analysis, Insights and Forecast - by Deployment Model
- 10. Latin America Computer Aided Manufacturing Industry Analysis, Insights and Forecast, 2019-2031
- 10.1. Market Analysis, Insights and Forecast - by Deployment Model
- 10.1.1. On-Premises
- 10.1.2. Cloud-Based
- 10.2. Market Analysis, Insights and Forecast - by End-User Industry
- 10.2.1. Aerospace & Defense
- 10.2.2. Automotive
- 10.2.3. Medical
- 10.2.4. Energy & Utilities
- 10.2.5. Other End-User Industries
- 10.1. Market Analysis, Insights and Forecast - by Deployment Model
- 11. Middle East and Africa Computer Aided Manufacturing Industry Analysis, Insights and Forecast, 2019-2031
- 11.1. Market Analysis, Insights and Forecast - by Deployment Model
- 11.1.1. On-Premises
- 11.1.2. Cloud-Based
- 11.2. Market Analysis, Insights and Forecast - by End-User Industry
- 11.2.1. Aerospace & Defense
- 11.2.2. Automotive
- 11.2.3. Medical
- 11.2.4. Energy & Utilities
- 11.2.5. Other End-User Industries
- 11.1. Market Analysis, Insights and Forecast - by Deployment Model
- 12. North America Computer Aided Manufacturing Industry Analysis, Insights and Forecast, 2019-2031
- 12.1. Market Analysis, Insights and Forecast - By Country/Sub-region
- 12.1.1 United States
- 12.1.2 Canada
- 12.1.3 Mexico
- 13. Europe Computer Aided Manufacturing Industry Analysis, Insights and Forecast, 2019-2031
- 13.1. Market Analysis, Insights and Forecast - By Country/Sub-region
- 13.1.1 Germany
- 13.1.2 United Kingdom
- 13.1.3 France
- 13.1.4 Spain
- 13.1.5 Italy
- 13.1.6 Spain
- 13.1.7 Belgium
- 13.1.8 Netherland
- 13.1.9 Nordics
- 13.1.10 Rest of Europe
- 14. Asia Pacific Computer Aided Manufacturing Industry Analysis, Insights and Forecast, 2019-2031
- 14.1. Market Analysis, Insights and Forecast - By Country/Sub-region
- 14.1.1 China
- 14.1.2 Japan
- 14.1.3 India
- 14.1.4 South Korea
- 14.1.5 Southeast Asia
- 14.1.6 Australia
- 14.1.7 Indonesia
- 14.1.8 Phillipes
- 14.1.9 Singapore
- 14.1.10 Thailandc
- 14.1.11 Rest of Asia Pacific
- 15. South America Computer Aided Manufacturing Industry Analysis, Insights and Forecast, 2019-2031
- 15.1. Market Analysis, Insights and Forecast - By Country/Sub-region
- 15.1.1 Brazil
- 15.1.2 Argentina
- 15.1.3 Peru
- 15.1.4 Chile
- 15.1.5 Colombia
- 15.1.6 Ecuador
- 15.1.7 Venezuela
- 15.1.8 Rest of South America
- 16. North America Computer Aided Manufacturing Industry Analysis, Insights and Forecast, 2019-2031
- 16.1. Market Analysis, Insights and Forecast - By Country/Sub-region
- 16.1.1 United States
- 16.1.2 Canada
- 16.1.3 Mexico
- 17. MEA Computer Aided Manufacturing Industry Analysis, Insights and Forecast, 2019-2031
- 17.1. Market Analysis, Insights and Forecast - By Country/Sub-region
- 17.1.1 United Arab Emirates
- 17.1.2 Saudi Arabia
- 17.1.3 South Africa
- 17.1.4 Rest of Middle East and Africa
- 18. Competitive Analysis
- 18.1. Global Market Share Analysis 2024
- 18.2. Company Profiles
- 18.2.1 Dassault Systems
- 18.2.1.1. Overview
- 18.2.1.2. Products
- 18.2.1.3. SWOT Analysis
- 18.2.1.4. Recent Developments
- 18.2.1.5. Financials (Based on Availability)
- 18.2.2 PTC
- 18.2.2.1. Overview
- 18.2.2.2. Products
- 18.2.2.3. SWOT Analysis
- 18.2.2.4. Recent Developments
- 18.2.2.5. Financials (Based on Availability)
- 18.2.3 MecSoft Corporation
- 18.2.3.1. Overview
- 18.2.3.2. Products
- 18.2.3.3. SWOT Analysis
- 18.2.3.4. Recent Developments
- 18.2.3.5. Financials (Based on Availability)
- 18.2.4 Hexagon AB
- 18.2.4.1. Overview
- 18.2.4.2. Products
- 18.2.4.3. SWOT Analysis
- 18.2.4.4. Recent Developments
- 18.2.4.5. Financials (Based on Availability)
- 18.2.5 NTT DATA Corporation
- 18.2.5.1. Overview
- 18.2.5.2. Products
- 18.2.5.3. SWOT Analysis
- 18.2.5.4. Recent Developments
- 18.2.5.5. Financials (Based on Availability)
- 18.2.6 Siemens AG
- 18.2.6.1. Overview
- 18.2.6.2. Products
- 18.2.6.3. SWOT Analysis
- 18.2.6.4. Recent Developments
- 18.2.6.5. Financials (Based on Availability)
- 18.2.7 SolidCAM Ltd
- 18.2.7.1. Overview
- 18.2.7.2. Products
- 18.2.7.3. SWOT Analysis
- 18.2.7.4. Recent Developments
- 18.2.7.5. Financials (Based on Availability)
- 18.2.8 OPEN MIND Technologies AG
- 18.2.8.1. Overview
- 18.2.8.2. Products
- 18.2.8.3. SWOT Analysis
- 18.2.8.4. Recent Developments
- 18.2.8.5. Financials (Based on Availability)
- 18.2.9 Autodesk Inc
- 18.2.9.1. Overview
- 18.2.9.2. Products
- 18.2.9.3. SWOT Analysis
- 18.2.9.4. Recent Developments
- 18.2.9.5. Financials (Based on Availability)
- 18.2.10 3D Systems Inc
- 18.2.10.1. Overview
- 18.2.10.2. Products
- 18.2.10.3. SWOT Analysis
- 18.2.10.4. Recent Developments
- 18.2.10.5. Financials (Based on Availability)
- 18.2.11 BobCAD-CAM
- 18.2.11.1. Overview
- 18.2.11.2. Products
- 18.2.11.3. SWOT Analysis
- 18.2.11.4. Recent Developments
- 18.2.11.5. Financials (Based on Availability)
- 18.2.12 SmartCAMcnc
- 18.2.12.1. Overview
- 18.2.12.2. Products
- 18.2.12.3. SWOT Analysis
- 18.2.12.4. Recent Developments
- 18.2.12.5. Financials (Based on Availability)
- 18.2.13 ZWSOFTCO LTD (Guangzhou)
- 18.2.13.1. Overview
- 18.2.13.2. Products
- 18.2.13.3. SWOT Analysis
- 18.2.13.4. Recent Developments
- 18.2.13.5. Financials (Based on Availability)
- 18.2.14 HCL Technologies Limited
- 18.2.14.1. Overview
- 18.2.14.2. Products
- 18.2.14.3. SWOT Analysis
- 18.2.14.4. Recent Developments
- 18.2.14.5. Financials (Based on Availability)
- 18.2.15 CNC Software LLC (Mastercam)
- 18.2.15.1. Overview
- 18.2.15.2. Products
- 18.2.15.3. SWOT Analysis
- 18.2.15.4. Recent Developments
- 18.2.15.5. Financials (Based on Availability)
- 18.2.1 Dassault Systems
List of Figures
- Figure 1: Global Computer Aided Manufacturing Industry Revenue Breakdown (Million, %) by Region 2024 & 2032
- Figure 2: North America Computer Aided Manufacturing Industry Revenue (Million), by Country 2024 & 2032
- Figure 3: North America Computer Aided Manufacturing Industry Revenue Share (%), by Country 2024 & 2032
- Figure 4: Europe Computer Aided Manufacturing Industry Revenue (Million), by Country 2024 & 2032
- Figure 5: Europe Computer Aided Manufacturing Industry Revenue Share (%), by Country 2024 & 2032
- Figure 6: Asia Pacific Computer Aided Manufacturing Industry Revenue (Million), by Country 2024 & 2032
- Figure 7: Asia Pacific Computer Aided Manufacturing Industry Revenue Share (%), by Country 2024 & 2032
- Figure 8: South America Computer Aided Manufacturing Industry Revenue (Million), by Country 2024 & 2032
- Figure 9: South America Computer Aided Manufacturing Industry Revenue Share (%), by Country 2024 & 2032
- Figure 10: North America Computer Aided Manufacturing Industry Revenue (Million), by Country 2024 & 2032
- Figure 11: North America Computer Aided Manufacturing Industry Revenue Share (%), by Country 2024 & 2032
- Figure 12: MEA Computer Aided Manufacturing Industry Revenue (Million), by Country 2024 & 2032
- Figure 13: MEA Computer Aided Manufacturing Industry Revenue Share (%), by Country 2024 & 2032
- Figure 14: North America Computer Aided Manufacturing Industry Revenue (Million), by Deployment Model 2024 & 2032
- Figure 15: North America Computer Aided Manufacturing Industry Revenue Share (%), by Deployment Model 2024 & 2032
- Figure 16: North America Computer Aided Manufacturing Industry Revenue (Million), by End-User Industry 2024 & 2032
- Figure 17: North America Computer Aided Manufacturing Industry Revenue Share (%), by End-User Industry 2024 & 2032
- Figure 18: North America Computer Aided Manufacturing Industry Revenue (Million), by Country 2024 & 2032
- Figure 19: North America Computer Aided Manufacturing Industry Revenue Share (%), by Country 2024 & 2032
- Figure 20: Europe Computer Aided Manufacturing Industry Revenue (Million), by Deployment Model 2024 & 2032
- Figure 21: Europe Computer Aided Manufacturing Industry Revenue Share (%), by Deployment Model 2024 & 2032
- Figure 22: Europe Computer Aided Manufacturing Industry Revenue (Million), by End-User Industry 2024 & 2032
- Figure 23: Europe Computer Aided Manufacturing Industry Revenue Share (%), by End-User Industry 2024 & 2032
- Figure 24: Europe Computer Aided Manufacturing Industry Revenue (Million), by Country 2024 & 2032
- Figure 25: Europe Computer Aided Manufacturing Industry Revenue Share (%), by Country 2024 & 2032
- Figure 26: Asia Computer Aided Manufacturing Industry Revenue (Million), by Deployment Model 2024 & 2032
- Figure 27: Asia Computer Aided Manufacturing Industry Revenue Share (%), by Deployment Model 2024 & 2032
- Figure 28: Asia Computer Aided Manufacturing Industry Revenue (Million), by End-User Industry 2024 & 2032
- Figure 29: Asia Computer Aided Manufacturing Industry Revenue Share (%), by End-User Industry 2024 & 2032
- Figure 30: Asia Computer Aided Manufacturing Industry Revenue (Million), by Country 2024 & 2032
- Figure 31: Asia Computer Aided Manufacturing Industry Revenue Share (%), by Country 2024 & 2032
- Figure 32: Australia and New Zealand Computer Aided Manufacturing Industry Revenue (Million), by Deployment Model 2024 & 2032
- Figure 33: Australia and New Zealand Computer Aided Manufacturing Industry Revenue Share (%), by Deployment Model 2024 & 2032
- Figure 34: Australia and New Zealand Computer Aided Manufacturing Industry Revenue (Million), by End-User Industry 2024 & 2032
- Figure 35: Australia and New Zealand Computer Aided Manufacturing Industry Revenue Share (%), by End-User Industry 2024 & 2032
- Figure 36: Australia and New Zealand Computer Aided Manufacturing Industry Revenue (Million), by Country 2024 & 2032
- Figure 37: Australia and New Zealand Computer Aided Manufacturing Industry Revenue Share (%), by Country 2024 & 2032
- Figure 38: Latin America Computer Aided Manufacturing Industry Revenue (Million), by Deployment Model 2024 & 2032
- Figure 39: Latin America Computer Aided Manufacturing Industry Revenue Share (%), by Deployment Model 2024 & 2032
- Figure 40: Latin America Computer Aided Manufacturing Industry Revenue (Million), by End-User Industry 2024 & 2032
- Figure 41: Latin America Computer Aided Manufacturing Industry Revenue Share (%), by End-User Industry 2024 & 2032
- Figure 42: Latin America Computer Aided Manufacturing Industry Revenue (Million), by Country 2024 & 2032
- Figure 43: Latin America Computer Aided Manufacturing Industry Revenue Share (%), by Country 2024 & 2032
- Figure 44: Middle East and Africa Computer Aided Manufacturing Industry Revenue (Million), by Deployment Model 2024 & 2032
- Figure 45: Middle East and Africa Computer Aided Manufacturing Industry Revenue Share (%), by Deployment Model 2024 & 2032
- Figure 46: Middle East and Africa Computer Aided Manufacturing Industry Revenue (Million), by End-User Industry 2024 & 2032
- Figure 47: Middle East and Africa Computer Aided Manufacturing Industry Revenue Share (%), by End-User Industry 2024 & 2032
- Figure 48: Middle East and Africa Computer Aided Manufacturing Industry Revenue (Million), by Country 2024 & 2032
- Figure 49: Middle East and Africa Computer Aided Manufacturing Industry Revenue Share (%), by Country 2024 & 2032
List of Tables
- Table 1: Global Computer Aided Manufacturing Industry Revenue Million Forecast, by Region 2019 & 2032
- Table 2: Global Computer Aided Manufacturing Industry Revenue Million Forecast, by Deployment Model 2019 & 2032
- Table 3: Global Computer Aided Manufacturing Industry Revenue Million Forecast, by End-User Industry 2019 & 2032
- Table 4: Global Computer Aided Manufacturing Industry Revenue Million Forecast, by Region 2019 & 2032
- Table 5: Global Computer Aided Manufacturing Industry Revenue Million Forecast, by Country 2019 & 2032
- Table 6: United States Computer Aided Manufacturing Industry Revenue (Million) Forecast, by Application 2019 & 2032
- Table 7: Canada Computer Aided Manufacturing Industry Revenue (Million) Forecast, by Application 2019 & 2032
- Table 8: Mexico Computer Aided Manufacturing Industry Revenue (Million) Forecast, by Application 2019 & 2032
- Table 9: Global Computer Aided Manufacturing Industry Revenue Million Forecast, by Country 2019 & 2032
- Table 10: Germany Computer Aided Manufacturing Industry Revenue (Million) Forecast, by Application 2019 & 2032
- Table 11: United Kingdom Computer Aided Manufacturing Industry Revenue (Million) Forecast, by Application 2019 & 2032
- Table 12: France Computer Aided Manufacturing Industry Revenue (Million) Forecast, by Application 2019 & 2032
- Table 13: Spain Computer Aided Manufacturing Industry Revenue (Million) Forecast, by Application 2019 & 2032
- Table 14: Italy Computer Aided Manufacturing Industry Revenue (Million) Forecast, by Application 2019 & 2032
- Table 15: Spain Computer Aided Manufacturing Industry Revenue (Million) Forecast, by Application 2019 & 2032
- Table 16: Belgium Computer Aided Manufacturing Industry Revenue (Million) Forecast, by Application 2019 & 2032
- Table 17: Netherland Computer Aided Manufacturing Industry Revenue (Million) Forecast, by Application 2019 & 2032
- Table 18: Nordics Computer Aided Manufacturing Industry Revenue (Million) Forecast, by Application 2019 & 2032
- Table 19: Rest of Europe Computer Aided Manufacturing Industry Revenue (Million) Forecast, by Application 2019 & 2032
- Table 20: Global Computer Aided Manufacturing Industry Revenue Million Forecast, by Country 2019 & 2032
- Table 21: China Computer Aided Manufacturing Industry Revenue (Million) Forecast, by Application 2019 & 2032
- Table 22: Japan Computer Aided Manufacturing Industry Revenue (Million) Forecast, by Application 2019 & 2032
- Table 23: India Computer Aided Manufacturing Industry Revenue (Million) Forecast, by Application 2019 & 2032
- Table 24: South Korea Computer Aided Manufacturing Industry Revenue (Million) Forecast, by Application 2019 & 2032
- Table 25: Southeast Asia Computer Aided Manufacturing Industry Revenue (Million) Forecast, by Application 2019 & 2032
- Table 26: Australia Computer Aided Manufacturing Industry Revenue (Million) Forecast, by Application 2019 & 2032
- Table 27: Indonesia Computer Aided Manufacturing Industry Revenue (Million) Forecast, by Application 2019 & 2032
- Table 28: Phillipes Computer Aided Manufacturing Industry Revenue (Million) Forecast, by Application 2019 & 2032
- Table 29: Singapore Computer Aided Manufacturing Industry Revenue (Million) Forecast, by Application 2019 & 2032
- Table 30: Thailandc Computer Aided Manufacturing Industry Revenue (Million) Forecast, by Application 2019 & 2032
- Table 31: Rest of Asia Pacific Computer Aided Manufacturing Industry Revenue (Million) Forecast, by Application 2019 & 2032
- Table 32: Global Computer Aided Manufacturing Industry Revenue Million Forecast, by Country 2019 & 2032
- Table 33: Brazil Computer Aided Manufacturing Industry Revenue (Million) Forecast, by Application 2019 & 2032
- Table 34: Argentina Computer Aided Manufacturing Industry Revenue (Million) Forecast, by Application 2019 & 2032
- Table 35: Peru Computer Aided Manufacturing Industry Revenue (Million) Forecast, by Application 2019 & 2032
- Table 36: Chile Computer Aided Manufacturing Industry Revenue (Million) Forecast, by Application 2019 & 2032
- Table 37: Colombia Computer Aided Manufacturing Industry Revenue (Million) Forecast, by Application 2019 & 2032
- Table 38: Ecuador Computer Aided Manufacturing Industry Revenue (Million) Forecast, by Application 2019 & 2032
- Table 39: Venezuela Computer Aided Manufacturing Industry Revenue (Million) Forecast, by Application 2019 & 2032
- Table 40: Rest of South America Computer Aided Manufacturing Industry Revenue (Million) Forecast, by Application 2019 & 2032
- Table 41: Global Computer Aided Manufacturing Industry Revenue Million Forecast, by Country 2019 & 2032
- Table 42: United States Computer Aided Manufacturing Industry Revenue (Million) Forecast, by Application 2019 & 2032
- Table 43: Canada Computer Aided Manufacturing Industry Revenue (Million) Forecast, by Application 2019 & 2032
- Table 44: Mexico Computer Aided Manufacturing Industry Revenue (Million) Forecast, by Application 2019 & 2032
- Table 45: Global Computer Aided Manufacturing Industry Revenue Million Forecast, by Country 2019 & 2032
- Table 46: United Arab Emirates Computer Aided Manufacturing Industry Revenue (Million) Forecast, by Application 2019 & 2032
- Table 47: Saudi Arabia Computer Aided Manufacturing Industry Revenue (Million) Forecast, by Application 2019 & 2032
- Table 48: South Africa Computer Aided Manufacturing Industry Revenue (Million) Forecast, by Application 2019 & 2032
- Table 49: Rest of Middle East and Africa Computer Aided Manufacturing Industry Revenue (Million) Forecast, by Application 2019 & 2032
- Table 50: Global Computer Aided Manufacturing Industry Revenue Million Forecast, by Deployment Model 2019 & 2032
- Table 51: Global Computer Aided Manufacturing Industry Revenue Million Forecast, by End-User Industry 2019 & 2032
- Table 52: Global Computer Aided Manufacturing Industry Revenue Million Forecast, by Country 2019 & 2032
- Table 53: United States Computer Aided Manufacturing Industry Revenue (Million) Forecast, by Application 2019 & 2032
- Table 54: Canada Computer Aided Manufacturing Industry Revenue (Million) Forecast, by Application 2019 & 2032
- Table 55: Global Computer Aided Manufacturing Industry Revenue Million Forecast, by Deployment Model 2019 & 2032
- Table 56: Global Computer Aided Manufacturing Industry Revenue Million Forecast, by End-User Industry 2019 & 2032
- Table 57: Global Computer Aided Manufacturing Industry Revenue Million Forecast, by Country 2019 & 2032
- Table 58: Germany Computer Aided Manufacturing Industry Revenue (Million) Forecast, by Application 2019 & 2032
- Table 59: Switzerland Computer Aided Manufacturing Industry Revenue (Million) Forecast, by Application 2019 & 2032
- Table 60: Spain Computer Aided Manufacturing Industry Revenue (Million) Forecast, by Application 2019 & 2032
- Table 61: Austria Computer Aided Manufacturing Industry Revenue (Million) Forecast, by Application 2019 & 2032
- Table 62: Belgium Computer Aided Manufacturing Industry Revenue (Million) Forecast, by Application 2019 & 2032
- Table 63: Netherlands Computer Aided Manufacturing Industry Revenue (Million) Forecast, by Application 2019 & 2032
- Table 64: United Kingdom Computer Aided Manufacturing Industry Revenue (Million) Forecast, by Application 2019 & 2032
- Table 65: France Computer Aided Manufacturing Industry Revenue (Million) Forecast, by Application 2019 & 2032
- Table 66: Italy Computer Aided Manufacturing Industry Revenue (Million) Forecast, by Application 2019 & 2032
- Table 67: Sweden Computer Aided Manufacturing Industry Revenue (Million) Forecast, by Application 2019 & 2032
- Table 68: Poland Computer Aided Manufacturing Industry Revenue (Million) Forecast, by Application 2019 & 2032
- Table 69: Global Computer Aided Manufacturing Industry Revenue Million Forecast, by Deployment Model 2019 & 2032
- Table 70: Global Computer Aided Manufacturing Industry Revenue Million Forecast, by End-User Industry 2019 & 2032
- Table 71: Global Computer Aided Manufacturing Industry Revenue Million Forecast, by Country 2019 & 2032
- Table 72: China Computer Aided Manufacturing Industry Revenue (Million) Forecast, by Application 2019 & 2032
- Table 73: Japan Computer Aided Manufacturing Industry Revenue (Million) Forecast, by Application 2019 & 2032
- Table 74: South Korea Computer Aided Manufacturing Industry Revenue (Million) Forecast, by Application 2019 & 2032
- Table 75: India Computer Aided Manufacturing Industry Revenue (Million) Forecast, by Application 2019 & 2032
- Table 76: Global Computer Aided Manufacturing Industry Revenue Million Forecast, by Deployment Model 2019 & 2032
- Table 77: Global Computer Aided Manufacturing Industry Revenue Million Forecast, by End-User Industry 2019 & 2032
- Table 78: Global Computer Aided Manufacturing Industry Revenue Million Forecast, by Country 2019 & 2032
- Table 79: Global Computer Aided Manufacturing Industry Revenue Million Forecast, by Deployment Model 2019 & 2032
- Table 80: Global Computer Aided Manufacturing Industry Revenue Million Forecast, by End-User Industry 2019 & 2032
- Table 81: Global Computer Aided Manufacturing Industry Revenue Million Forecast, by Country 2019 & 2032
- Table 82: Brazil Computer Aided Manufacturing Industry Revenue (Million) Forecast, by Application 2019 & 2032
- Table 83: Mexico Computer Aided Manufacturing Industry Revenue (Million) Forecast, by Application 2019 & 2032
- Table 84: Global Computer Aided Manufacturing Industry Revenue Million Forecast, by Deployment Model 2019 & 2032
- Table 85: Global Computer Aided Manufacturing Industry Revenue Million Forecast, by End-User Industry 2019 & 2032
- Table 86: Global Computer Aided Manufacturing Industry Revenue Million Forecast, by Country 2019 & 2032
- Table 87: United Arab Emirates Computer Aided Manufacturing Industry Revenue (Million) Forecast, by Application 2019 & 2032
- Table 88: Saudi Arabia Computer Aided Manufacturing Industry Revenue (Million) Forecast, by Application 2019 & 2032
- Table 89: South Africa Computer Aided Manufacturing Industry Revenue (Million) Forecast, by Application 2019 & 2032
Frequently Asked Questions
1. What is the projected Compound Annual Growth Rate (CAGR) of the Computer Aided Manufacturing Industry?
The projected CAGR is approximately 8.13%.
2. Which companies are prominent players in the Computer Aided Manufacturing Industry?
Key companies in the market include Dassault Systems, PTC, MecSoft Corporation, Hexagon AB, NTT DATA Corporation, Siemens AG, SolidCAM Ltd, OPEN MIND Technologies AG, Autodesk Inc, 3D Systems Inc, BobCAD-CAM, SmartCAMcnc , ZWSOFTCO LTD (Guangzhou), HCL Technologies Limited, CNC Software LLC (Mastercam).
3. What are the main segments of the Computer Aided Manufacturing Industry?
The market segments include Deployment Model, End-User Industry.
4. Can you provide details about the market size?
The market size is estimated to be USD 3.94 Million as of 2022.
5. What are some drivers contributing to market growth?
Increasing Adoption of Industry 4.; Growing Utilization of CAM Software in the Packaging Machinery Sector.
6. What are the notable trends driving market growth?
Automotive is Expected to Hold a Major Market Share.
7. Are there any restraints impacting market growth?
Wide Availability of Open Source CAM Software.
8. Can you provide examples of recent developments in the market?
November 2023 - Microlight3D launched Luminis software, a computer-aided manufacturing (CAM) software built explicitly for the microFAB-3D. Luminis combines the ability to prepare objects for printing and control the printer, aiding to 3D print objects to 100× smaller than a strand of hair. Luminis features 3D visualization for the capturing of 40 fps - 60 fps data under the same load. The software enables printing prototypes of technologies used in micro-robotics, microfluidics, micro-optics, and cell culture and tissue engineering.
9. What pricing options are available for accessing the report?
Pricing options include single-user, multi-user, and enterprise licenses priced at USD 4750, USD 5250, and USD 8750 respectively.
10. Is the market size provided in terms of value or volume?
The market size is provided in terms of value, measured in Million.
11. Are there any specific market keywords associated with the report?
Yes, the market keyword associated with the report is "Computer Aided Manufacturing Industry," which aids in identifying and referencing the specific market segment covered.
12. How do I determine which pricing option suits my needs best?
The pricing options vary based on user requirements and access needs. Individual users may opt for single-user licenses, while businesses requiring broader access may choose multi-user or enterprise licenses for cost-effective access to the report.
13. Are there any additional resources or data provided in the Computer Aided Manufacturing Industry report?
While the report offers comprehensive insights, it's advisable to review the specific contents or supplementary materials provided to ascertain if additional resources or data are available.
14. How can I stay updated on further developments or reports in the Computer Aided Manufacturing Industry?
To stay informed about further developments, trends, and reports in the Computer Aided Manufacturing Industry, consider subscribing to industry newsletters, following relevant companies and organizations, or regularly checking reputable industry news sources and publications.
Methodology
Step 1 - Identification of Relevant Samples Size from Population Database


Step 2 - Approaches for Defining Global Market Size (Value, Volume* & Price*)

Note*: In applicable scenarios
Step 3 - Data Sources
Primary Research
- Web Analytics
- Survey Reports
- Research Institute
- Latest Research Reports
- Opinion Leaders
Secondary Research
- Annual Reports
- White Paper
- Latest Press Release
- Industry Association
- Paid Database
- Investor Presentations

Step 4 - Data Triangulation
Involves using different sources of information in order to increase the validity of a study
These sources are likely to be stakeholders in a program - participants, other researchers, program staff, other community members, and so on.
Then we put all data in single framework & apply various statistical tools to find out the dynamic on the market.
During the analysis stage, feedback from the stakeholder groups would be compared to determine areas of agreement as well as areas of divergence


