
Key Insights
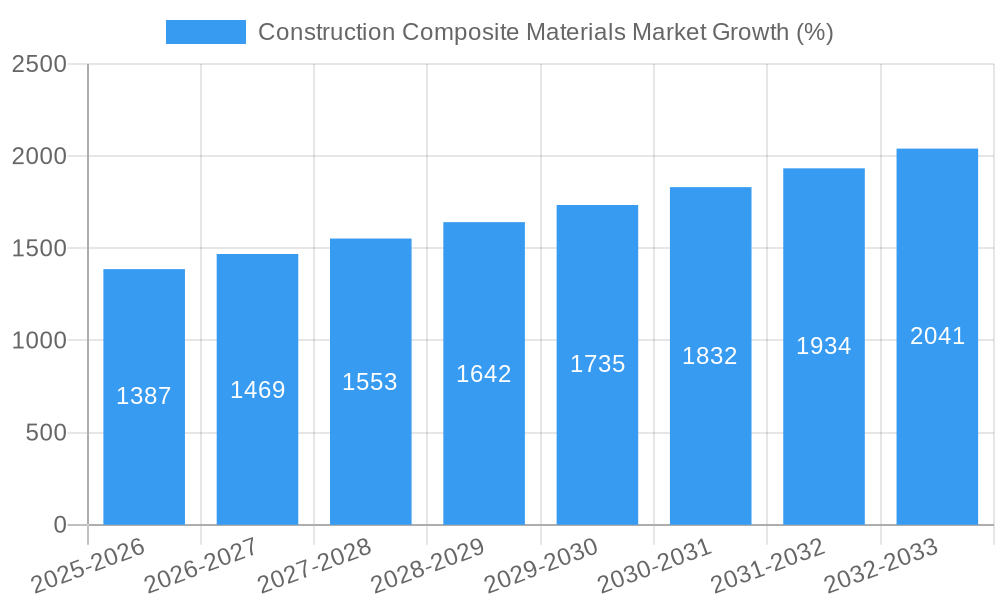
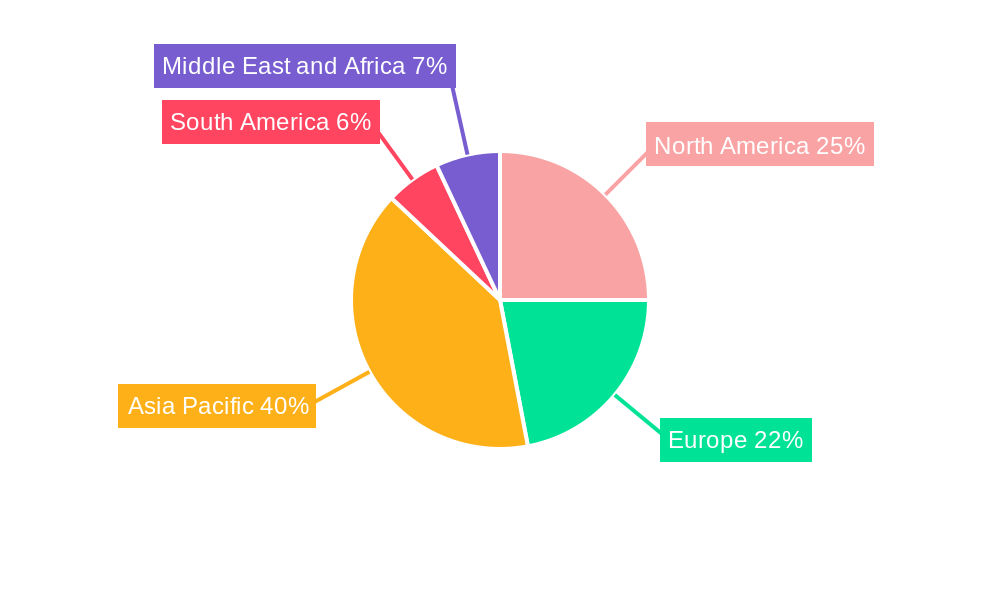
The Construction Composite Materials market is experiencing robust growth, projected to reach a substantial size, driven by several key factors. The market's Compound Annual Growth Rate (CAGR) of 5.91% from 2019 to 2024 indicates a significant upward trajectory, expected to continue into the forecast period (2025-2033). This expansion is fueled by increasing demand for lightweight, high-strength materials in construction, particularly in infrastructure projects and building applications. The rising adoption of sustainable construction practices further boosts market growth, as composite materials offer advantages in terms of reduced energy consumption and minimized environmental impact compared to traditional materials like steel and concrete. Specific drivers include the need for faster construction timelines, improved durability and resistance to corrosion, and the enhanced design flexibility offered by composites. Market segmentation reveals polyester and glass fiber as dominant materials, with the industrial and commercial sectors as key end-users. Geographically, the Asia-Pacific region, particularly China and India, are significant growth drivers due to rapid urbanization and infrastructure development. North America and Europe also contribute substantially, reflecting a mature yet continuously evolving market with a focus on innovation and advanced composite technologies. However, high initial investment costs and potential challenges in recycling and disposal of certain composite materials may act as constraints on market growth. Ongoing research and development efforts focused on enhancing material properties, reducing costs, and improving recyclability are expected to mitigate these challenges in the long term.
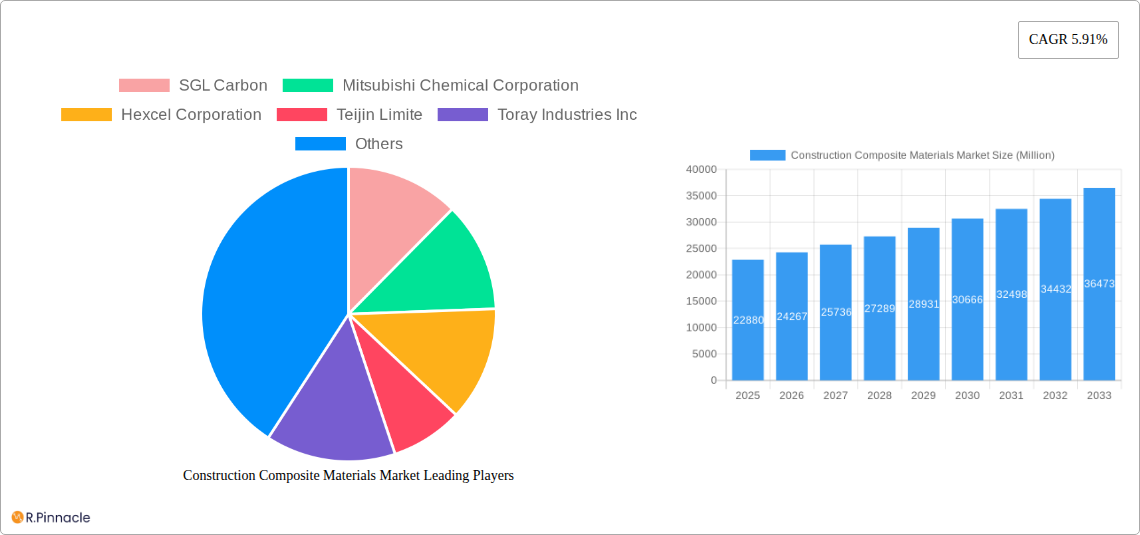
The competitive landscape features a mix of established global players and regional manufacturers. Companies like SGL Carbon, Mitsubishi Chemical Corporation, and Hexcel Corporation are at the forefront of innovation and technological advancements. These companies are actively involved in developing new composite materials, expanding production capacities, and forging strategic partnerships to maintain their market share. The focus is on providing tailored composite solutions to meet the specific needs of various construction applications, thus contributing to the overall growth and diversification of the Construction Composite Materials market. Future growth will likely be shaped by advancements in material science, evolving construction techniques, and increasing government support for sustainable infrastructure development.
Construction Composite Materials Market Report: 2019-2033
This comprehensive report provides an in-depth analysis of the Construction Composite Materials Market, offering valuable insights for industry professionals, investors, and strategic decision-makers. Covering the period 2019-2033, with a focus on 2025, this report unveils market dynamics, growth drivers, challenges, and emerging opportunities. The report segments the market by Resin Type (Polyester Resin, Vinyl Ester, Polyethylene, Polypropylene, Epoxy Resin, Other Resin Types), Fiber Type (Carbon Fibers, Glass Fibers, Natural Fibers, Other Fiber Types), and End-use Sector (Industrial, Commercial, Housing, Civil). Key players such as SGL Carbon, Mitsubishi Chemical Corporation, and Owens Corning are analyzed, highlighting their strategic moves and market influence. The report projects a xx Million market value by 2033, showcasing significant growth potential.
Construction Composite Materials Market Market Structure & Innovation Trends
The Construction Composite Materials market exhibits a moderately consolidated structure, with key players holding significant market share. SGL Carbon, Mitsubishi Chemical Corporation, and Hexcel Corporation are among the leading players, collectively accounting for an estimated xx% of the market in 2025. Innovation is driven by the need for lighter, stronger, and more durable construction materials, leading to advancements in resin and fiber technologies. Stringent environmental regulations are promoting the adoption of sustainable composite materials, like those incorporating natural fibers. Product substitutes, such as traditional concrete and steel, continue to pose competition, but the unique advantages of composites, such as higher strength-to-weight ratios and improved durability, are driving market growth. M&A activities are shaping the market landscape, with recent deals like Owens Corning's acquisition of WearDeck (June 2022) signifying consolidation and expansion strategies. These deals, valued collectively at approximately xx Million in the last five years, are indicative of increasing industry interest and investment. The market's overall concentration is expected to increase slightly over the forecast period due to ongoing consolidation. End-user demographics reveal a growing preference for sustainable and high-performance building materials, which fuels the demand for innovative composite solutions.
Construction Composite Materials Market Market Dynamics & Trends
The Construction Composite Materials market is experiencing robust growth, driven by several key factors. The rising global construction industry, particularly in developing economies, fuels the demand for lightweight, high-strength materials. Technological advancements in resin and fiber technologies are resulting in improved material properties, enhanced performance, and cost reductions, driving wider adoption. Consumer preferences for sustainable and energy-efficient buildings are further accelerating market growth, with manufacturers responding by developing eco-friendly composite solutions. Competitive dynamics are intensifying, with companies focusing on innovation, strategic partnerships, and M&A activities to enhance their market positions. The market is expected to witness a CAGR of xx% during the forecast period (2025-2033), with market penetration steadily increasing across various end-use sectors. The increasing adoption of prefabricated construction methods further boosts the demand for these materials. However, price volatility of raw materials and potential supply chain disruptions pose challenges to consistent growth.
Dominant Regions & Segments in Construction Composite Materials Market
The North American region currently holds a dominant position in the Construction Composite Materials market, driven by robust construction activity and significant investments in infrastructure development. Within this region, the United States leads due to its mature construction sector and favorable regulatory environment.
- Key Drivers in North America:
- Significant government investment in infrastructure projects.
- Strong demand from the housing and commercial construction sectors.
- Early adoption of innovative composite technologies.
The Polyester Resin segment dominates the Resin Type category due to its cost-effectiveness and versatility. Glass Fibers remain the most widely used fiber type, driven by their high strength-to-weight ratio and relatively low cost. The Industrial end-use sector shows the highest demand owing to its extensive applications in various industrial constructions. European markets are also showing considerable growth, fueled by similar factors, though at a slightly slower pace than North America. Asia-Pacific is projected to witness the fastest growth during the forecast period, driven by rapid urbanization and infrastructure development.
Construction Composite Materials Market Product Innovations
Recent innovations in construction composite materials focus on enhancing material properties, sustainability, and ease of processing. New resin systems are being developed to improve durability, fire resistance, and chemical resistance. Advances in fiber technology are leading to the use of stronger and lighter materials, resulting in cost savings and improved structural performance. Bio-based and recycled materials are increasingly incorporated into composites to enhance sustainability. These innovations improve the overall market fit by addressing specific needs in various applications, leading to enhanced structural integrity, lower lifecycle costs, and reduced environmental impact.
Report Scope & Segmentation Analysis
This report comprehensively analyzes the Construction Composite Materials market, segmented by Resin Type (Polyester Resin, Vinyl Ester, Polyethylene, Polypropylene, Epoxy Resin, Other Resin Types), Fiber Type (Carbon Fibers, Glass Fibers, Natural Fibers, Other Fiber Types), and End-use Sector (Industrial, Commercial, Housing, Civil). Each segment's growth projections, market sizes, and competitive dynamics are examined. The Polyester Resin segment is expected to maintain its dominant position due to its cost-effectiveness, while the demand for carbon fiber composites is anticipated to grow rapidly due to their superior mechanical properties. Glass fibers will remain prevalent due to their cost-effectiveness. Within end-use sectors, industrial applications are projected to show robust growth, followed by commercial and housing sectors.
Key Drivers of Construction Composite Materials Market Growth
The Construction Composite Materials market's growth is fueled by several key factors. Rising infrastructure spending globally stimulates demand for high-performance construction materials. Increasing awareness of sustainability is driving the adoption of eco-friendly composite solutions. Technological advancements lead to improved material properties, resulting in increased efficiency and reduced costs. Government regulations promoting the use of sustainable building materials further support market expansion. The increasing demand for lightweight, durable, and corrosion-resistant materials across various applications is expected to drive significant growth over the next decade.
Challenges in the Construction Composite Materials Market Sector
The Construction Composite Materials market faces several challenges. Fluctuations in raw material prices, especially for resins and fibers, impact profitability. Supply chain disruptions can hinder production and delivery. Intense competition among manufacturers necessitates continuous innovation and cost optimization. The relatively high initial cost of composite materials compared to traditional alternatives can limit their widespread adoption. Addressing these challenges requires strategic management of supply chains, technological advancements leading to cost reduction, and focused marketing efforts to highlight the long-term cost-effectiveness of composites.
Emerging Opportunities in Construction Composite Materials Market
Emerging opportunities lie in the development of advanced composite materials with enhanced properties, such as improved fire resistance, self-healing capabilities, and better recyclability. The growth of sustainable construction practices will further drive demand for eco-friendly composites. Expansion into new markets, particularly in developing economies with substantial infrastructure projects, presents significant growth potential. Innovations in manufacturing processes could lead to cost reductions and increased production efficiency, broadening market accessibility.
Leading Players in the Construction Composite Materials Market Market
- SGL Carbon
- Mitsubishi Chemical Corporation
- Hexcel Corporation
- Teijin Limited
- Toray Industries Inc
- Gurit
- Exel Composites
- Nippon Electric Glass Co Ltd
- Kordsa Teknik Tekstil AS
- Owens Corning
- Aegion Corporation
Key Developments in Construction Composite Materials Market Industry
- June 2022: Owens Corning acquired WearDeck, strengthening its position in composite decking and structural lumber.
- June 2022: Owens Corning partnered with Pultron Composites, enhancing its presence in the fiberglass rebar market.
Future Outlook for Construction Composite Materials Market Market
The Construction Composite Materials market is poised for continued growth, driven by ongoing infrastructure development, increasing demand for sustainable building materials, and technological advancements leading to improved material properties and cost reductions. Strategic partnerships, acquisitions, and innovation will shape the competitive landscape. Focus on sustainability and the development of high-performance materials will be crucial for future success in this dynamic market. The market is expected to witness a significant expansion over the next decade, presenting substantial opportunities for companies operating in this sector.
Construction Composite Materials Market Segmentation
-
1. Resin Type
- 1.1. Polyester Resin
- 1.2. Vinyl Ester
- 1.3. Polyethylene
- 1.4. Polypropylene
- 1.5. Epoxy Resin
- 1.6. Other Resin Types
-
2. Fiber Type
- 2.1. Carbon Fibers
- 2.2. Glass Fibers
- 2.3. Natural Fibers
- 2.4. Other Fiber Types
-
3. End-use Sector
- 3.1. Industrial
- 3.2. Commercial
- 3.3. Housing
- 3.4. Civil
Construction Composite Materials Market Segmentation By Geography
-
1. Asia Pacific
- 1.1. China
- 1.2. India
- 1.3. Japan
- 1.4. South Korea
- 1.5. ASEAN Countries
- 1.6. Rest of Asia Pacific
-
2. North America
- 2.1. United States
- 2.2. Canada
- 2.3. Mexico
-
3. Europe
- 3.1. Germany
- 3.2. United Kingdom
- 3.3. Italy
- 3.4. France
- 3.5. Spain
- 3.6. Rest of Europe
-
4. South America
- 4.1. Brazil
- 4.2. Argentina
- 4.3. Rest of South America
-
5. Middle East and Africa
- 5.1. Saudi Arabia
- 5.2. South Africa
- 5.3. Rest of Middle East and Africa
Construction Composite Materials Market REPORT HIGHLIGHTS
| Aspects | Details |
|---|---|
| Study Period | 2019-2033 |
| Base Year | 2024 |
| Estimated Year | 2025 |
| Forecast Period | 2025-2033 |
| Historical Period | 2019-2024 |
| Growth Rate | CAGR of 5.91% from 2019-2033 |
| Segmentation |
|
Table of Contents
- 1. Introduction
- 1.1. Research Scope
- 1.2. Market Segmentation
- 1.3. Research Methodology
- 1.4. Definitions and Assumptions
- 2. Executive Summary
- 2.1. Introduction
- 3. Market Dynamics
- 3.1. Introduction
- 3.2. Market Drivers
- 3.2.1. Increasing Use of Composites in Construction Applications; Rehabilitation of Old Concrete Structures
- 3.3. Market Restrains
- 3.3.1. High Initial Production and Installation Costs of Composites
- 3.4. Market Trends
- 3.4.1. Civil Construction Sector to Dominate the Market
- 4. Market Factor Analysis
- 4.1. Porters Five Forces
- 4.2. Supply/Value Chain
- 4.3. PESTEL analysis
- 4.4. Market Entropy
- 4.5. Patent/Trademark Analysis
- 5. Global Construction Composite Materials Market Analysis, Insights and Forecast, 2019-2031
- 5.1. Market Analysis, Insights and Forecast - by Resin Type
- 5.1.1. Polyester Resin
- 5.1.2. Vinyl Ester
- 5.1.3. Polyethylene
- 5.1.4. Polypropylene
- 5.1.5. Epoxy Resin
- 5.1.6. Other Resin Types
- 5.2. Market Analysis, Insights and Forecast - by Fiber Type
- 5.2.1. Carbon Fibers
- 5.2.2. Glass Fibers
- 5.2.3. Natural Fibers
- 5.2.4. Other Fiber Types
- 5.3. Market Analysis, Insights and Forecast - by End-use Sector
- 5.3.1. Industrial
- 5.3.2. Commercial
- 5.3.3. Housing
- 5.3.4. Civil
- 5.4. Market Analysis, Insights and Forecast - by Region
- 5.4.1. Asia Pacific
- 5.4.2. North America
- 5.4.3. Europe
- 5.4.4. South America
- 5.4.5. Middle East and Africa
- 5.1. Market Analysis, Insights and Forecast - by Resin Type
- 6. Asia Pacific Construction Composite Materials Market Analysis, Insights and Forecast, 2019-2031
- 6.1. Market Analysis, Insights and Forecast - by Resin Type
- 6.1.1. Polyester Resin
- 6.1.2. Vinyl Ester
- 6.1.3. Polyethylene
- 6.1.4. Polypropylene
- 6.1.5. Epoxy Resin
- 6.1.6. Other Resin Types
- 6.2. Market Analysis, Insights and Forecast - by Fiber Type
- 6.2.1. Carbon Fibers
- 6.2.2. Glass Fibers
- 6.2.3. Natural Fibers
- 6.2.4. Other Fiber Types
- 6.3. Market Analysis, Insights and Forecast - by End-use Sector
- 6.3.1. Industrial
- 6.3.2. Commercial
- 6.3.3. Housing
- 6.3.4. Civil
- 6.1. Market Analysis, Insights and Forecast - by Resin Type
- 7. North America Construction Composite Materials Market Analysis, Insights and Forecast, 2019-2031
- 7.1. Market Analysis, Insights and Forecast - by Resin Type
- 7.1.1. Polyester Resin
- 7.1.2. Vinyl Ester
- 7.1.3. Polyethylene
- 7.1.4. Polypropylene
- 7.1.5. Epoxy Resin
- 7.1.6. Other Resin Types
- 7.2. Market Analysis, Insights and Forecast - by Fiber Type
- 7.2.1. Carbon Fibers
- 7.2.2. Glass Fibers
- 7.2.3. Natural Fibers
- 7.2.4. Other Fiber Types
- 7.3. Market Analysis, Insights and Forecast - by End-use Sector
- 7.3.1. Industrial
- 7.3.2. Commercial
- 7.3.3. Housing
- 7.3.4. Civil
- 7.1. Market Analysis, Insights and Forecast - by Resin Type
- 8. Europe Construction Composite Materials Market Analysis, Insights and Forecast, 2019-2031
- 8.1. Market Analysis, Insights and Forecast - by Resin Type
- 8.1.1. Polyester Resin
- 8.1.2. Vinyl Ester
- 8.1.3. Polyethylene
- 8.1.4. Polypropylene
- 8.1.5. Epoxy Resin
- 8.1.6. Other Resin Types
- 8.2. Market Analysis, Insights and Forecast - by Fiber Type
- 8.2.1. Carbon Fibers
- 8.2.2. Glass Fibers
- 8.2.3. Natural Fibers
- 8.2.4. Other Fiber Types
- 8.3. Market Analysis, Insights and Forecast - by End-use Sector
- 8.3.1. Industrial
- 8.3.2. Commercial
- 8.3.3. Housing
- 8.3.4. Civil
- 8.1. Market Analysis, Insights and Forecast - by Resin Type
- 9. South America Construction Composite Materials Market Analysis, Insights and Forecast, 2019-2031
- 9.1. Market Analysis, Insights and Forecast - by Resin Type
- 9.1.1. Polyester Resin
- 9.1.2. Vinyl Ester
- 9.1.3. Polyethylene
- 9.1.4. Polypropylene
- 9.1.5. Epoxy Resin
- 9.1.6. Other Resin Types
- 9.2. Market Analysis, Insights and Forecast - by Fiber Type
- 9.2.1. Carbon Fibers
- 9.2.2. Glass Fibers
- 9.2.3. Natural Fibers
- 9.2.4. Other Fiber Types
- 9.3. Market Analysis, Insights and Forecast - by End-use Sector
- 9.3.1. Industrial
- 9.3.2. Commercial
- 9.3.3. Housing
- 9.3.4. Civil
- 9.1. Market Analysis, Insights and Forecast - by Resin Type
- 10. Middle East and Africa Construction Composite Materials Market Analysis, Insights and Forecast, 2019-2031
- 10.1. Market Analysis, Insights and Forecast - by Resin Type
- 10.1.1. Polyester Resin
- 10.1.2. Vinyl Ester
- 10.1.3. Polyethylene
- 10.1.4. Polypropylene
- 10.1.5. Epoxy Resin
- 10.1.6. Other Resin Types
- 10.2. Market Analysis, Insights and Forecast - by Fiber Type
- 10.2.1. Carbon Fibers
- 10.2.2. Glass Fibers
- 10.2.3. Natural Fibers
- 10.2.4. Other Fiber Types
- 10.3. Market Analysis, Insights and Forecast - by End-use Sector
- 10.3.1. Industrial
- 10.3.2. Commercial
- 10.3.3. Housing
- 10.3.4. Civil
- 10.1. Market Analysis, Insights and Forecast - by Resin Type
- 11. Asia Pacific Construction Composite Materials Market Analysis, Insights and Forecast, 2019-2031
- 11.1. Market Analysis, Insights and Forecast - By Country/Sub-region
- 11.1.1 China
- 11.1.2 India
- 11.1.3 Japan
- 11.1.4 South Korea
- 11.1.5 ASEAN Countries
- 11.1.6 Rest of Asia Pacific
- 12. North America Construction Composite Materials Market Analysis, Insights and Forecast, 2019-2031
- 12.1. Market Analysis, Insights and Forecast - By Country/Sub-region
- 12.1.1 United States
- 12.1.2 Canada
- 12.1.3 Mexico
- 13. Europe Construction Composite Materials Market Analysis, Insights and Forecast, 2019-2031
- 13.1. Market Analysis, Insights and Forecast - By Country/Sub-region
- 13.1.1 Germany
- 13.1.2 United Kingdom
- 13.1.3 Italy
- 13.1.4 France
- 13.1.5 Spain
- 13.1.6 Rest of Europe
- 14. South America Construction Composite Materials Market Analysis, Insights and Forecast, 2019-2031
- 14.1. Market Analysis, Insights and Forecast - By Country/Sub-region
- 14.1.1 Brazil
- 14.1.2 Argentina
- 14.1.3 Rest of South America
- 15. Middle East and Africa Construction Composite Materials Market Analysis, Insights and Forecast, 2019-2031
- 15.1. Market Analysis, Insights and Forecast - By Country/Sub-region
- 15.1.1 Saudi Arabia
- 15.1.2 South Africa
- 15.1.3 Rest of Middle East and Africa
- 16. Competitive Analysis
- 16.1. Global Market Share Analysis 2024
- 16.2. Company Profiles
- 16.2.1 SGL Carbon
- 16.2.1.1. Overview
- 16.2.1.2. Products
- 16.2.1.3. SWOT Analysis
- 16.2.1.4. Recent Developments
- 16.2.1.5. Financials (Based on Availability)
- 16.2.2 Mitsubishi Chemical Corporation
- 16.2.2.1. Overview
- 16.2.2.2. Products
- 16.2.2.3. SWOT Analysis
- 16.2.2.4. Recent Developments
- 16.2.2.5. Financials (Based on Availability)
- 16.2.3 Hexcel Corporation
- 16.2.3.1. Overview
- 16.2.3.2. Products
- 16.2.3.3. SWOT Analysis
- 16.2.3.4. Recent Developments
- 16.2.3.5. Financials (Based on Availability)
- 16.2.4 Teijin Limite
- 16.2.4.1. Overview
- 16.2.4.2. Products
- 16.2.4.3. SWOT Analysis
- 16.2.4.4. Recent Developments
- 16.2.4.5. Financials (Based on Availability)
- 16.2.5 Toray Industries Inc
- 16.2.5.1. Overview
- 16.2.5.2. Products
- 16.2.5.3. SWOT Analysis
- 16.2.5.4. Recent Developments
- 16.2.5.5. Financials (Based on Availability)
- 16.2.6 Gurit
- 16.2.6.1. Overview
- 16.2.6.2. Products
- 16.2.6.3. SWOT Analysis
- 16.2.6.4. Recent Developments
- 16.2.6.5. Financials (Based on Availability)
- 16.2.7 Exel Composites
- 16.2.7.1. Overview
- 16.2.7.2. Products
- 16.2.7.3. SWOT Analysis
- 16.2.7.4. Recent Developments
- 16.2.7.5. Financials (Based on Availability)
- 16.2.8 Nippon Electric Glass Co Ltd
- 16.2.8.1. Overview
- 16.2.8.2. Products
- 16.2.8.3. SWOT Analysis
- 16.2.8.4. Recent Developments
- 16.2.8.5. Financials (Based on Availability)
- 16.2.9 Kordsa Teknik Tekstil AS
- 16.2.9.1. Overview
- 16.2.9.2. Products
- 16.2.9.3. SWOT Analysis
- 16.2.9.4. Recent Developments
- 16.2.9.5. Financials (Based on Availability)
- 16.2.10 Owens Corning
- 16.2.10.1. Overview
- 16.2.10.2. Products
- 16.2.10.3. SWOT Analysis
- 16.2.10.4. Recent Developments
- 16.2.10.5. Financials (Based on Availability)
- 16.2.11 Aegion Corporation
- 16.2.11.1. Overview
- 16.2.11.2. Products
- 16.2.11.3. SWOT Analysis
- 16.2.11.4. Recent Developments
- 16.2.11.5. Financials (Based on Availability)
- 16.2.1 SGL Carbon
List of Figures
- Figure 1: Global Construction Composite Materials Market Revenue Breakdown (Million, %) by Region 2024 & 2032
- Figure 2: Global Construction Composite Materials Market Volume Breakdown (Kiloton, %) by Region 2024 & 2032
- Figure 3: Asia Pacific Construction Composite Materials Market Revenue (Million), by Country 2024 & 2032
- Figure 4: Asia Pacific Construction Composite Materials Market Volume (Kiloton), by Country 2024 & 2032
- Figure 5: Asia Pacific Construction Composite Materials Market Revenue Share (%), by Country 2024 & 2032
- Figure 6: Asia Pacific Construction Composite Materials Market Volume Share (%), by Country 2024 & 2032
- Figure 7: North America Construction Composite Materials Market Revenue (Million), by Country 2024 & 2032
- Figure 8: North America Construction Composite Materials Market Volume (Kiloton), by Country 2024 & 2032
- Figure 9: North America Construction Composite Materials Market Revenue Share (%), by Country 2024 & 2032
- Figure 10: North America Construction Composite Materials Market Volume Share (%), by Country 2024 & 2032
- Figure 11: Europe Construction Composite Materials Market Revenue (Million), by Country 2024 & 2032
- Figure 12: Europe Construction Composite Materials Market Volume (Kiloton), by Country 2024 & 2032
- Figure 13: Europe Construction Composite Materials Market Revenue Share (%), by Country 2024 & 2032
- Figure 14: Europe Construction Composite Materials Market Volume Share (%), by Country 2024 & 2032
- Figure 15: South America Construction Composite Materials Market Revenue (Million), by Country 2024 & 2032
- Figure 16: South America Construction Composite Materials Market Volume (Kiloton), by Country 2024 & 2032
- Figure 17: South America Construction Composite Materials Market Revenue Share (%), by Country 2024 & 2032
- Figure 18: South America Construction Composite Materials Market Volume Share (%), by Country 2024 & 2032
- Figure 19: Middle East and Africa Construction Composite Materials Market Revenue (Million), by Country 2024 & 2032
- Figure 20: Middle East and Africa Construction Composite Materials Market Volume (Kiloton), by Country 2024 & 2032
- Figure 21: Middle East and Africa Construction Composite Materials Market Revenue Share (%), by Country 2024 & 2032
- Figure 22: Middle East and Africa Construction Composite Materials Market Volume Share (%), by Country 2024 & 2032
- Figure 23: Asia Pacific Construction Composite Materials Market Revenue (Million), by Resin Type 2024 & 2032
- Figure 24: Asia Pacific Construction Composite Materials Market Volume (Kiloton), by Resin Type 2024 & 2032
- Figure 25: Asia Pacific Construction Composite Materials Market Revenue Share (%), by Resin Type 2024 & 2032
- Figure 26: Asia Pacific Construction Composite Materials Market Volume Share (%), by Resin Type 2024 & 2032
- Figure 27: Asia Pacific Construction Composite Materials Market Revenue (Million), by Fiber Type 2024 & 2032
- Figure 28: Asia Pacific Construction Composite Materials Market Volume (Kiloton), by Fiber Type 2024 & 2032
- Figure 29: Asia Pacific Construction Composite Materials Market Revenue Share (%), by Fiber Type 2024 & 2032
- Figure 30: Asia Pacific Construction Composite Materials Market Volume Share (%), by Fiber Type 2024 & 2032
- Figure 31: Asia Pacific Construction Composite Materials Market Revenue (Million), by End-use Sector 2024 & 2032
- Figure 32: Asia Pacific Construction Composite Materials Market Volume (Kiloton), by End-use Sector 2024 & 2032
- Figure 33: Asia Pacific Construction Composite Materials Market Revenue Share (%), by End-use Sector 2024 & 2032
- Figure 34: Asia Pacific Construction Composite Materials Market Volume Share (%), by End-use Sector 2024 & 2032
- Figure 35: Asia Pacific Construction Composite Materials Market Revenue (Million), by Country 2024 & 2032
- Figure 36: Asia Pacific Construction Composite Materials Market Volume (Kiloton), by Country 2024 & 2032
- Figure 37: Asia Pacific Construction Composite Materials Market Revenue Share (%), by Country 2024 & 2032
- Figure 38: Asia Pacific Construction Composite Materials Market Volume Share (%), by Country 2024 & 2032
- Figure 39: North America Construction Composite Materials Market Revenue (Million), by Resin Type 2024 & 2032
- Figure 40: North America Construction Composite Materials Market Volume (Kiloton), by Resin Type 2024 & 2032
- Figure 41: North America Construction Composite Materials Market Revenue Share (%), by Resin Type 2024 & 2032
- Figure 42: North America Construction Composite Materials Market Volume Share (%), by Resin Type 2024 & 2032
- Figure 43: North America Construction Composite Materials Market Revenue (Million), by Fiber Type 2024 & 2032
- Figure 44: North America Construction Composite Materials Market Volume (Kiloton), by Fiber Type 2024 & 2032
- Figure 45: North America Construction Composite Materials Market Revenue Share (%), by Fiber Type 2024 & 2032
- Figure 46: North America Construction Composite Materials Market Volume Share (%), by Fiber Type 2024 & 2032
- Figure 47: North America Construction Composite Materials Market Revenue (Million), by End-use Sector 2024 & 2032
- Figure 48: North America Construction Composite Materials Market Volume (Kiloton), by End-use Sector 2024 & 2032
- Figure 49: North America Construction Composite Materials Market Revenue Share (%), by End-use Sector 2024 & 2032
- Figure 50: North America Construction Composite Materials Market Volume Share (%), by End-use Sector 2024 & 2032
- Figure 51: North America Construction Composite Materials Market Revenue (Million), by Country 2024 & 2032
- Figure 52: North America Construction Composite Materials Market Volume (Kiloton), by Country 2024 & 2032
- Figure 53: North America Construction Composite Materials Market Revenue Share (%), by Country 2024 & 2032
- Figure 54: North America Construction Composite Materials Market Volume Share (%), by Country 2024 & 2032
- Figure 55: Europe Construction Composite Materials Market Revenue (Million), by Resin Type 2024 & 2032
- Figure 56: Europe Construction Composite Materials Market Volume (Kiloton), by Resin Type 2024 & 2032
- Figure 57: Europe Construction Composite Materials Market Revenue Share (%), by Resin Type 2024 & 2032
- Figure 58: Europe Construction Composite Materials Market Volume Share (%), by Resin Type 2024 & 2032
- Figure 59: Europe Construction Composite Materials Market Revenue (Million), by Fiber Type 2024 & 2032
- Figure 60: Europe Construction Composite Materials Market Volume (Kiloton), by Fiber Type 2024 & 2032
- Figure 61: Europe Construction Composite Materials Market Revenue Share (%), by Fiber Type 2024 & 2032
- Figure 62: Europe Construction Composite Materials Market Volume Share (%), by Fiber Type 2024 & 2032
- Figure 63: Europe Construction Composite Materials Market Revenue (Million), by End-use Sector 2024 & 2032
- Figure 64: Europe Construction Composite Materials Market Volume (Kiloton), by End-use Sector 2024 & 2032
- Figure 65: Europe Construction Composite Materials Market Revenue Share (%), by End-use Sector 2024 & 2032
- Figure 66: Europe Construction Composite Materials Market Volume Share (%), by End-use Sector 2024 & 2032
- Figure 67: Europe Construction Composite Materials Market Revenue (Million), by Country 2024 & 2032
- Figure 68: Europe Construction Composite Materials Market Volume (Kiloton), by Country 2024 & 2032
- Figure 69: Europe Construction Composite Materials Market Revenue Share (%), by Country 2024 & 2032
- Figure 70: Europe Construction Composite Materials Market Volume Share (%), by Country 2024 & 2032
- Figure 71: South America Construction Composite Materials Market Revenue (Million), by Resin Type 2024 & 2032
- Figure 72: South America Construction Composite Materials Market Volume (Kiloton), by Resin Type 2024 & 2032
- Figure 73: South America Construction Composite Materials Market Revenue Share (%), by Resin Type 2024 & 2032
- Figure 74: South America Construction Composite Materials Market Volume Share (%), by Resin Type 2024 & 2032
- Figure 75: South America Construction Composite Materials Market Revenue (Million), by Fiber Type 2024 & 2032
- Figure 76: South America Construction Composite Materials Market Volume (Kiloton), by Fiber Type 2024 & 2032
- Figure 77: South America Construction Composite Materials Market Revenue Share (%), by Fiber Type 2024 & 2032
- Figure 78: South America Construction Composite Materials Market Volume Share (%), by Fiber Type 2024 & 2032
- Figure 79: South America Construction Composite Materials Market Revenue (Million), by End-use Sector 2024 & 2032
- Figure 80: South America Construction Composite Materials Market Volume (Kiloton), by End-use Sector 2024 & 2032
- Figure 81: South America Construction Composite Materials Market Revenue Share (%), by End-use Sector 2024 & 2032
- Figure 82: South America Construction Composite Materials Market Volume Share (%), by End-use Sector 2024 & 2032
- Figure 83: South America Construction Composite Materials Market Revenue (Million), by Country 2024 & 2032
- Figure 84: South America Construction Composite Materials Market Volume (Kiloton), by Country 2024 & 2032
- Figure 85: South America Construction Composite Materials Market Revenue Share (%), by Country 2024 & 2032
- Figure 86: South America Construction Composite Materials Market Volume Share (%), by Country 2024 & 2032
- Figure 87: Middle East and Africa Construction Composite Materials Market Revenue (Million), by Resin Type 2024 & 2032
- Figure 88: Middle East and Africa Construction Composite Materials Market Volume (Kiloton), by Resin Type 2024 & 2032
- Figure 89: Middle East and Africa Construction Composite Materials Market Revenue Share (%), by Resin Type 2024 & 2032
- Figure 90: Middle East and Africa Construction Composite Materials Market Volume Share (%), by Resin Type 2024 & 2032
- Figure 91: Middle East and Africa Construction Composite Materials Market Revenue (Million), by Fiber Type 2024 & 2032
- Figure 92: Middle East and Africa Construction Composite Materials Market Volume (Kiloton), by Fiber Type 2024 & 2032
- Figure 93: Middle East and Africa Construction Composite Materials Market Revenue Share (%), by Fiber Type 2024 & 2032
- Figure 94: Middle East and Africa Construction Composite Materials Market Volume Share (%), by Fiber Type 2024 & 2032
- Figure 95: Middle East and Africa Construction Composite Materials Market Revenue (Million), by End-use Sector 2024 & 2032
- Figure 96: Middle East and Africa Construction Composite Materials Market Volume (Kiloton), by End-use Sector 2024 & 2032
- Figure 97: Middle East and Africa Construction Composite Materials Market Revenue Share (%), by End-use Sector 2024 & 2032
- Figure 98: Middle East and Africa Construction Composite Materials Market Volume Share (%), by End-use Sector 2024 & 2032
- Figure 99: Middle East and Africa Construction Composite Materials Market Revenue (Million), by Country 2024 & 2032
- Figure 100: Middle East and Africa Construction Composite Materials Market Volume (Kiloton), by Country 2024 & 2032
- Figure 101: Middle East and Africa Construction Composite Materials Market Revenue Share (%), by Country 2024 & 2032
- Figure 102: Middle East and Africa Construction Composite Materials Market Volume Share (%), by Country 2024 & 2032
List of Tables
- Table 1: Global Construction Composite Materials Market Revenue Million Forecast, by Region 2019 & 2032
- Table 2: Global Construction Composite Materials Market Volume Kiloton Forecast, by Region 2019 & 2032
- Table 3: Global Construction Composite Materials Market Revenue Million Forecast, by Resin Type 2019 & 2032
- Table 4: Global Construction Composite Materials Market Volume Kiloton Forecast, by Resin Type 2019 & 2032
- Table 5: Global Construction Composite Materials Market Revenue Million Forecast, by Fiber Type 2019 & 2032
- Table 6: Global Construction Composite Materials Market Volume Kiloton Forecast, by Fiber Type 2019 & 2032
- Table 7: Global Construction Composite Materials Market Revenue Million Forecast, by End-use Sector 2019 & 2032
- Table 8: Global Construction Composite Materials Market Volume Kiloton Forecast, by End-use Sector 2019 & 2032
- Table 9: Global Construction Composite Materials Market Revenue Million Forecast, by Region 2019 & 2032
- Table 10: Global Construction Composite Materials Market Volume Kiloton Forecast, by Region 2019 & 2032
- Table 11: Global Construction Composite Materials Market Revenue Million Forecast, by Country 2019 & 2032
- Table 12: Global Construction Composite Materials Market Volume Kiloton Forecast, by Country 2019 & 2032
- Table 13: China Construction Composite Materials Market Revenue (Million) Forecast, by Application 2019 & 2032
- Table 14: China Construction Composite Materials Market Volume (Kiloton) Forecast, by Application 2019 & 2032
- Table 15: India Construction Composite Materials Market Revenue (Million) Forecast, by Application 2019 & 2032
- Table 16: India Construction Composite Materials Market Volume (Kiloton) Forecast, by Application 2019 & 2032
- Table 17: Japan Construction Composite Materials Market Revenue (Million) Forecast, by Application 2019 & 2032
- Table 18: Japan Construction Composite Materials Market Volume (Kiloton) Forecast, by Application 2019 & 2032
- Table 19: South Korea Construction Composite Materials Market Revenue (Million) Forecast, by Application 2019 & 2032
- Table 20: South Korea Construction Composite Materials Market Volume (Kiloton) Forecast, by Application 2019 & 2032
- Table 21: ASEAN Countries Construction Composite Materials Market Revenue (Million) Forecast, by Application 2019 & 2032
- Table 22: ASEAN Countries Construction Composite Materials Market Volume (Kiloton) Forecast, by Application 2019 & 2032
- Table 23: Rest of Asia Pacific Construction Composite Materials Market Revenue (Million) Forecast, by Application 2019 & 2032
- Table 24: Rest of Asia Pacific Construction Composite Materials Market Volume (Kiloton) Forecast, by Application 2019 & 2032
- Table 25: Global Construction Composite Materials Market Revenue Million Forecast, by Country 2019 & 2032
- Table 26: Global Construction Composite Materials Market Volume Kiloton Forecast, by Country 2019 & 2032
- Table 27: United States Construction Composite Materials Market Revenue (Million) Forecast, by Application 2019 & 2032
- Table 28: United States Construction Composite Materials Market Volume (Kiloton) Forecast, by Application 2019 & 2032
- Table 29: Canada Construction Composite Materials Market Revenue (Million) Forecast, by Application 2019 & 2032
- Table 30: Canada Construction Composite Materials Market Volume (Kiloton) Forecast, by Application 2019 & 2032
- Table 31: Mexico Construction Composite Materials Market Revenue (Million) Forecast, by Application 2019 & 2032
- Table 32: Mexico Construction Composite Materials Market Volume (Kiloton) Forecast, by Application 2019 & 2032
- Table 33: Global Construction Composite Materials Market Revenue Million Forecast, by Country 2019 & 2032
- Table 34: Global Construction Composite Materials Market Volume Kiloton Forecast, by Country 2019 & 2032
- Table 35: Germany Construction Composite Materials Market Revenue (Million) Forecast, by Application 2019 & 2032
- Table 36: Germany Construction Composite Materials Market Volume (Kiloton) Forecast, by Application 2019 & 2032
- Table 37: United Kingdom Construction Composite Materials Market Revenue (Million) Forecast, by Application 2019 & 2032
- Table 38: United Kingdom Construction Composite Materials Market Volume (Kiloton) Forecast, by Application 2019 & 2032
- Table 39: Italy Construction Composite Materials Market Revenue (Million) Forecast, by Application 2019 & 2032
- Table 40: Italy Construction Composite Materials Market Volume (Kiloton) Forecast, by Application 2019 & 2032
- Table 41: France Construction Composite Materials Market Revenue (Million) Forecast, by Application 2019 & 2032
- Table 42: France Construction Composite Materials Market Volume (Kiloton) Forecast, by Application 2019 & 2032
- Table 43: Spain Construction Composite Materials Market Revenue (Million) Forecast, by Application 2019 & 2032
- Table 44: Spain Construction Composite Materials Market Volume (Kiloton) Forecast, by Application 2019 & 2032
- Table 45: Rest of Europe Construction Composite Materials Market Revenue (Million) Forecast, by Application 2019 & 2032
- Table 46: Rest of Europe Construction Composite Materials Market Volume (Kiloton) Forecast, by Application 2019 & 2032
- Table 47: Global Construction Composite Materials Market Revenue Million Forecast, by Country 2019 & 2032
- Table 48: Global Construction Composite Materials Market Volume Kiloton Forecast, by Country 2019 & 2032
- Table 49: Brazil Construction Composite Materials Market Revenue (Million) Forecast, by Application 2019 & 2032
- Table 50: Brazil Construction Composite Materials Market Volume (Kiloton) Forecast, by Application 2019 & 2032
- Table 51: Argentina Construction Composite Materials Market Revenue (Million) Forecast, by Application 2019 & 2032
- Table 52: Argentina Construction Composite Materials Market Volume (Kiloton) Forecast, by Application 2019 & 2032
- Table 53: Rest of South America Construction Composite Materials Market Revenue (Million) Forecast, by Application 2019 & 2032
- Table 54: Rest of South America Construction Composite Materials Market Volume (Kiloton) Forecast, by Application 2019 & 2032
- Table 55: Global Construction Composite Materials Market Revenue Million Forecast, by Country 2019 & 2032
- Table 56: Global Construction Composite Materials Market Volume Kiloton Forecast, by Country 2019 & 2032
- Table 57: Saudi Arabia Construction Composite Materials Market Revenue (Million) Forecast, by Application 2019 & 2032
- Table 58: Saudi Arabia Construction Composite Materials Market Volume (Kiloton) Forecast, by Application 2019 & 2032
- Table 59: South Africa Construction Composite Materials Market Revenue (Million) Forecast, by Application 2019 & 2032
- Table 60: South Africa Construction Composite Materials Market Volume (Kiloton) Forecast, by Application 2019 & 2032
- Table 61: Rest of Middle East and Africa Construction Composite Materials Market Revenue (Million) Forecast, by Application 2019 & 2032
- Table 62: Rest of Middle East and Africa Construction Composite Materials Market Volume (Kiloton) Forecast, by Application 2019 & 2032
- Table 63: Global Construction Composite Materials Market Revenue Million Forecast, by Resin Type 2019 & 2032
- Table 64: Global Construction Composite Materials Market Volume Kiloton Forecast, by Resin Type 2019 & 2032
- Table 65: Global Construction Composite Materials Market Revenue Million Forecast, by Fiber Type 2019 & 2032
- Table 66: Global Construction Composite Materials Market Volume Kiloton Forecast, by Fiber Type 2019 & 2032
- Table 67: Global Construction Composite Materials Market Revenue Million Forecast, by End-use Sector 2019 & 2032
- Table 68: Global Construction Composite Materials Market Volume Kiloton Forecast, by End-use Sector 2019 & 2032
- Table 69: Global Construction Composite Materials Market Revenue Million Forecast, by Country 2019 & 2032
- Table 70: Global Construction Composite Materials Market Volume Kiloton Forecast, by Country 2019 & 2032
- Table 71: China Construction Composite Materials Market Revenue (Million) Forecast, by Application 2019 & 2032
- Table 72: China Construction Composite Materials Market Volume (Kiloton) Forecast, by Application 2019 & 2032
- Table 73: India Construction Composite Materials Market Revenue (Million) Forecast, by Application 2019 & 2032
- Table 74: India Construction Composite Materials Market Volume (Kiloton) Forecast, by Application 2019 & 2032
- Table 75: Japan Construction Composite Materials Market Revenue (Million) Forecast, by Application 2019 & 2032
- Table 76: Japan Construction Composite Materials Market Volume (Kiloton) Forecast, by Application 2019 & 2032
- Table 77: South Korea Construction Composite Materials Market Revenue (Million) Forecast, by Application 2019 & 2032
- Table 78: South Korea Construction Composite Materials Market Volume (Kiloton) Forecast, by Application 2019 & 2032
- Table 79: ASEAN Countries Construction Composite Materials Market Revenue (Million) Forecast, by Application 2019 & 2032
- Table 80: ASEAN Countries Construction Composite Materials Market Volume (Kiloton) Forecast, by Application 2019 & 2032
- Table 81: Rest of Asia Pacific Construction Composite Materials Market Revenue (Million) Forecast, by Application 2019 & 2032
- Table 82: Rest of Asia Pacific Construction Composite Materials Market Volume (Kiloton) Forecast, by Application 2019 & 2032
- Table 83: Global Construction Composite Materials Market Revenue Million Forecast, by Resin Type 2019 & 2032
- Table 84: Global Construction Composite Materials Market Volume Kiloton Forecast, by Resin Type 2019 & 2032
- Table 85: Global Construction Composite Materials Market Revenue Million Forecast, by Fiber Type 2019 & 2032
- Table 86: Global Construction Composite Materials Market Volume Kiloton Forecast, by Fiber Type 2019 & 2032
- Table 87: Global Construction Composite Materials Market Revenue Million Forecast, by End-use Sector 2019 & 2032
- Table 88: Global Construction Composite Materials Market Volume Kiloton Forecast, by End-use Sector 2019 & 2032
- Table 89: Global Construction Composite Materials Market Revenue Million Forecast, by Country 2019 & 2032
- Table 90: Global Construction Composite Materials Market Volume Kiloton Forecast, by Country 2019 & 2032
- Table 91: United States Construction Composite Materials Market Revenue (Million) Forecast, by Application 2019 & 2032
- Table 92: United States Construction Composite Materials Market Volume (Kiloton) Forecast, by Application 2019 & 2032
- Table 93: Canada Construction Composite Materials Market Revenue (Million) Forecast, by Application 2019 & 2032
- Table 94: Canada Construction Composite Materials Market Volume (Kiloton) Forecast, by Application 2019 & 2032
- Table 95: Mexico Construction Composite Materials Market Revenue (Million) Forecast, by Application 2019 & 2032
- Table 96: Mexico Construction Composite Materials Market Volume (Kiloton) Forecast, by Application 2019 & 2032
- Table 97: Global Construction Composite Materials Market Revenue Million Forecast, by Resin Type 2019 & 2032
- Table 98: Global Construction Composite Materials Market Volume Kiloton Forecast, by Resin Type 2019 & 2032
- Table 99: Global Construction Composite Materials Market Revenue Million Forecast, by Fiber Type 2019 & 2032
- Table 100: Global Construction Composite Materials Market Volume Kiloton Forecast, by Fiber Type 2019 & 2032
- Table 101: Global Construction Composite Materials Market Revenue Million Forecast, by End-use Sector 2019 & 2032
- Table 102: Global Construction Composite Materials Market Volume Kiloton Forecast, by End-use Sector 2019 & 2032
- Table 103: Global Construction Composite Materials Market Revenue Million Forecast, by Country 2019 & 2032
- Table 104: Global Construction Composite Materials Market Volume Kiloton Forecast, by Country 2019 & 2032
- Table 105: Germany Construction Composite Materials Market Revenue (Million) Forecast, by Application 2019 & 2032
- Table 106: Germany Construction Composite Materials Market Volume (Kiloton) Forecast, by Application 2019 & 2032
- Table 107: United Kingdom Construction Composite Materials Market Revenue (Million) Forecast, by Application 2019 & 2032
- Table 108: United Kingdom Construction Composite Materials Market Volume (Kiloton) Forecast, by Application 2019 & 2032
- Table 109: Italy Construction Composite Materials Market Revenue (Million) Forecast, by Application 2019 & 2032
- Table 110: Italy Construction Composite Materials Market Volume (Kiloton) Forecast, by Application 2019 & 2032
- Table 111: France Construction Composite Materials Market Revenue (Million) Forecast, by Application 2019 & 2032
- Table 112: France Construction Composite Materials Market Volume (Kiloton) Forecast, by Application 2019 & 2032
- Table 113: Spain Construction Composite Materials Market Revenue (Million) Forecast, by Application 2019 & 2032
- Table 114: Spain Construction Composite Materials Market Volume (Kiloton) Forecast, by Application 2019 & 2032
- Table 115: Rest of Europe Construction Composite Materials Market Revenue (Million) Forecast, by Application 2019 & 2032
- Table 116: Rest of Europe Construction Composite Materials Market Volume (Kiloton) Forecast, by Application 2019 & 2032
- Table 117: Global Construction Composite Materials Market Revenue Million Forecast, by Resin Type 2019 & 2032
- Table 118: Global Construction Composite Materials Market Volume Kiloton Forecast, by Resin Type 2019 & 2032
- Table 119: Global Construction Composite Materials Market Revenue Million Forecast, by Fiber Type 2019 & 2032
- Table 120: Global Construction Composite Materials Market Volume Kiloton Forecast, by Fiber Type 2019 & 2032
- Table 121: Global Construction Composite Materials Market Revenue Million Forecast, by End-use Sector 2019 & 2032
- Table 122: Global Construction Composite Materials Market Volume Kiloton Forecast, by End-use Sector 2019 & 2032
- Table 123: Global Construction Composite Materials Market Revenue Million Forecast, by Country 2019 & 2032
- Table 124: Global Construction Composite Materials Market Volume Kiloton Forecast, by Country 2019 & 2032
- Table 125: Brazil Construction Composite Materials Market Revenue (Million) Forecast, by Application 2019 & 2032
- Table 126: Brazil Construction Composite Materials Market Volume (Kiloton) Forecast, by Application 2019 & 2032
- Table 127: Argentina Construction Composite Materials Market Revenue (Million) Forecast, by Application 2019 & 2032
- Table 128: Argentina Construction Composite Materials Market Volume (Kiloton) Forecast, by Application 2019 & 2032
- Table 129: Rest of South America Construction Composite Materials Market Revenue (Million) Forecast, by Application 2019 & 2032
- Table 130: Rest of South America Construction Composite Materials Market Volume (Kiloton) Forecast, by Application 2019 & 2032
- Table 131: Global Construction Composite Materials Market Revenue Million Forecast, by Resin Type 2019 & 2032
- Table 132: Global Construction Composite Materials Market Volume Kiloton Forecast, by Resin Type 2019 & 2032
- Table 133: Global Construction Composite Materials Market Revenue Million Forecast, by Fiber Type 2019 & 2032
- Table 134: Global Construction Composite Materials Market Volume Kiloton Forecast, by Fiber Type 2019 & 2032
- Table 135: Global Construction Composite Materials Market Revenue Million Forecast, by End-use Sector 2019 & 2032
- Table 136: Global Construction Composite Materials Market Volume Kiloton Forecast, by End-use Sector 2019 & 2032
- Table 137: Global Construction Composite Materials Market Revenue Million Forecast, by Country 2019 & 2032
- Table 138: Global Construction Composite Materials Market Volume Kiloton Forecast, by Country 2019 & 2032
- Table 139: Saudi Arabia Construction Composite Materials Market Revenue (Million) Forecast, by Application 2019 & 2032
- Table 140: Saudi Arabia Construction Composite Materials Market Volume (Kiloton) Forecast, by Application 2019 & 2032
- Table 141: South Africa Construction Composite Materials Market Revenue (Million) Forecast, by Application 2019 & 2032
- Table 142: South Africa Construction Composite Materials Market Volume (Kiloton) Forecast, by Application 2019 & 2032
- Table 143: Rest of Middle East and Africa Construction Composite Materials Market Revenue (Million) Forecast, by Application 2019 & 2032
- Table 144: Rest of Middle East and Africa Construction Composite Materials Market Volume (Kiloton) Forecast, by Application 2019 & 2032
Frequently Asked Questions
1. What is the projected Compound Annual Growth Rate (CAGR) of the Construction Composite Materials Market?
The projected CAGR is approximately 5.91%.
2. Which companies are prominent players in the Construction Composite Materials Market?
Key companies in the market include SGL Carbon, Mitsubishi Chemical Corporation, Hexcel Corporation, Teijin Limite, Toray Industries Inc, Gurit, Exel Composites, Nippon Electric Glass Co Ltd, Kordsa Teknik Tekstil AS, Owens Corning, Aegion Corporation.
3. What are the main segments of the Construction Composite Materials Market?
The market segments include Resin Type, Fiber Type, End-use Sector.
4. Can you provide details about the market size?
The market size is estimated to be USD 22.88 Million as of 2022.
5. What are some drivers contributing to market growth?
Increasing Use of Composites in Construction Applications; Rehabilitation of Old Concrete Structures.
6. What are the notable trends driving market growth?
Civil Construction Sector to Dominate the Market.
7. Are there any restraints impacting market growth?
High Initial Production and Installation Costs of Composites.
8. Can you provide examples of recent developments in the market?
In June 2022, Owens Corning acquired WearDeck, a composite decking and structural lumber manufacturer, in Florida, USA. This move strengthened the company's position in the construction composite materials market.
9. What pricing options are available for accessing the report?
Pricing options include single-user, multi-user, and enterprise licenses priced at USD 4750, USD 5250, and USD 8750 respectively.
10. Is the market size provided in terms of value or volume?
The market size is provided in terms of value, measured in Million and volume, measured in Kiloton.
11. Are there any specific market keywords associated with the report?
Yes, the market keyword associated with the report is "Construction Composite Materials Market," which aids in identifying and referencing the specific market segment covered.
12. How do I determine which pricing option suits my needs best?
The pricing options vary based on user requirements and access needs. Individual users may opt for single-user licenses, while businesses requiring broader access may choose multi-user or enterprise licenses for cost-effective access to the report.
13. Are there any additional resources or data provided in the Construction Composite Materials Market report?
While the report offers comprehensive insights, it's advisable to review the specific contents or supplementary materials provided to ascertain if additional resources or data are available.
14. How can I stay updated on further developments or reports in the Construction Composite Materials Market?
To stay informed about further developments, trends, and reports in the Construction Composite Materials Market, consider subscribing to industry newsletters, following relevant companies and organizations, or regularly checking reputable industry news sources and publications.
Methodology
Step 1 - Identification of Relevant Samples Size from Population Database


Step 2 - Approaches for Defining Global Market Size (Value, Volume* & Price*)

Note*: In applicable scenarios
Step 3 - Data Sources
Primary Research
- Web Analytics
- Survey Reports
- Research Institute
- Latest Research Reports
- Opinion Leaders
Secondary Research
- Annual Reports
- White Paper
- Latest Press Release
- Industry Association
- Paid Database
- Investor Presentations

Step 4 - Data Triangulation
Involves using different sources of information in order to increase the validity of a study
These sources are likely to be stakeholders in a program - participants, other researchers, program staff, other community members, and so on.
Then we put all data in single framework & apply various statistical tools to find out the dynamic on the market.
During the analysis stage, feedback from the stakeholder groups would be compared to determine areas of agreement as well as areas of divergence


