Key Insights
The global craft beer market is poised for sustained expansion, with a projected Compound Annual Growth Rate (CAGR) of 1.8%. This growth is propelled by escalating consumer demand for premium and distinctive beer experiences, favoring the diverse flavor profiles and artisanal production inherent in craft brewing. Increased disposable incomes, particularly in emerging economies, and a growing appreciation for sustainable and locally sourced ingredients further bolster market momentum. The market is segmented by beer type, including Ales, Pilsners, Pale Lagers, Specialty Beers, and Others, and by distribution channel, encompassing On-trade (bars, restaurants) and Off-trade (retail, online sales). While the on-trade sector remains vital, the off-trade segment is rapidly advancing, fueled by e-commerce proliferation and evolving consumer purchasing habits. The competitive environment is robust, featuring established entities such as Anheuser-Busch InBev and Heineken, alongside a dynamic array of independent craft breweries, fostering innovation and product diversification. Geographically, North America and Europe currently lead market share, with significant growth potential identified in the Asia-Pacific region and other developing markets. Key challenges include fluctuating raw material costs, regulatory landscapes, and intense competition, yet the overall market outlook remains exceptionally favorable.
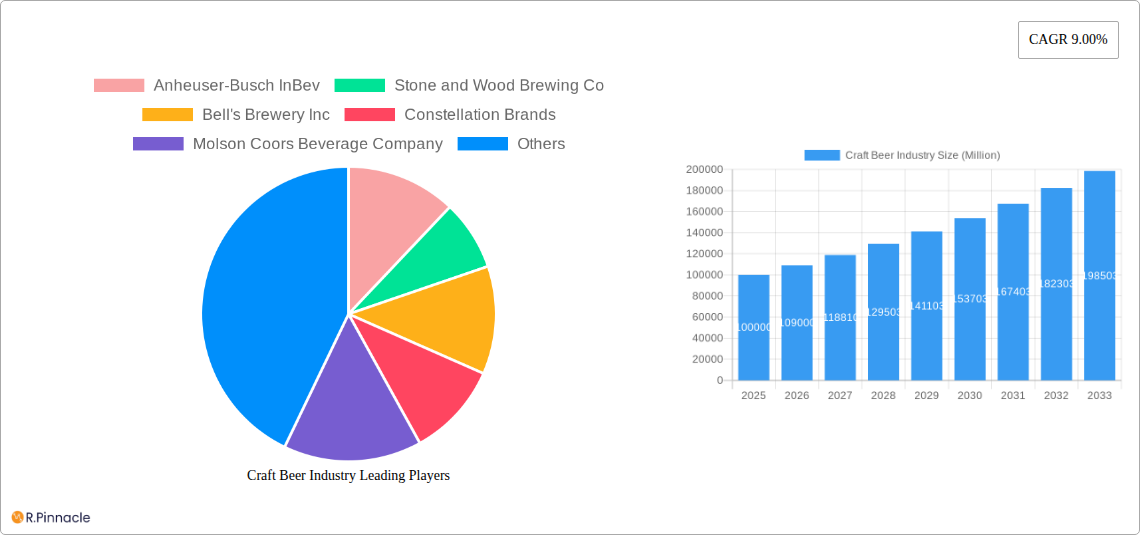
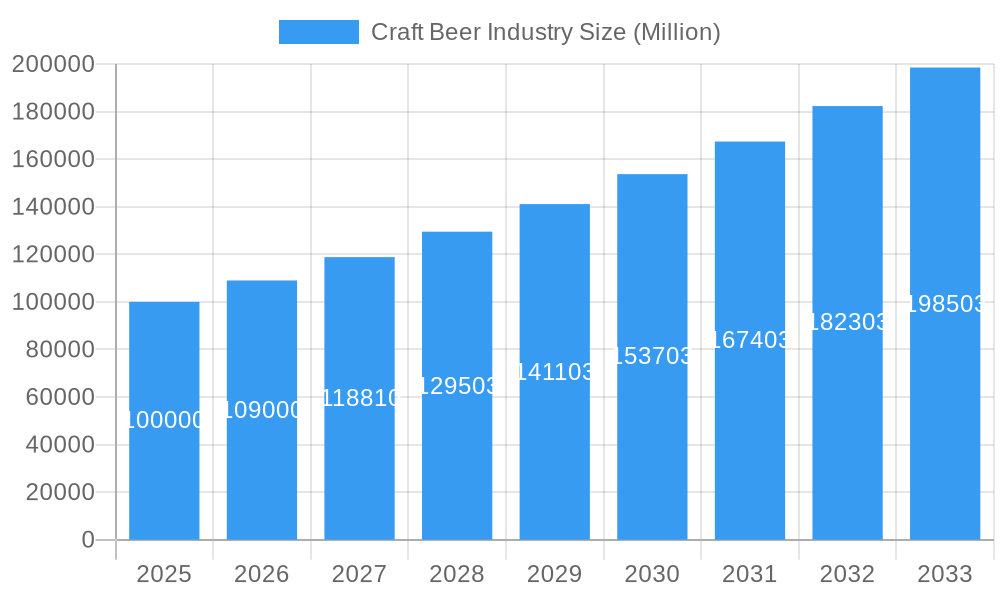
Craft Beer Industry Market Size (In Billion)
The forecast period, from the base year of 2025 to 2033, anticipates ongoing market growth. Continuous introduction of novel craft breweries and innovative beer styles will continue to shape the industry. Strategic imperatives for future success will center on precision marketing to specific consumer demographics, cultivating strong brand loyalty, and adapting to dynamic distribution channels. Emphasis on sustainability and ethical sourcing will resonate with an increasingly environmentally conscious consumer base, a demographic wielding significant influence on purchasing decisions within the craft beer sector. Market leaders will distinguish themselves through effective product innovation, streamlined distribution, and compelling brand storytelling. The market size is estimated at 7.4 billion units in the base year 2025.
Craft Beer Industry Company Market Share
Craft Beer Industry Market Report: 2019-2033
This comprehensive report provides a detailed analysis of the global craft beer industry, offering invaluable insights for industry professionals, investors, and stakeholders. With a study period spanning 2019-2033, including a base year of 2025 and a forecast period of 2025-2033, this report leverages historical data (2019-2024) to project future market trends and opportunities. The global craft beer market is estimated to be worth $XX Million in 2025, demonstrating significant growth potential.
Craft Beer Industry Market Structure & Innovation Trends
This section analyzes the competitive landscape of the craft beer market, including market concentration, innovation drivers, regulatory frameworks, product substitutes, end-user demographics, and mergers & acquisitions (M&A) activity. We examine the market share of key players such as Anheuser-Busch InBev, Constellation Brands, and Heineken NV, among others, and assess the impact of M&A deals, which totalled an estimated $XX Million in value during the historical period.
- Market Concentration: The craft beer market exhibits a mix of large multinational corporations and smaller, independent breweries, leading to a dynamic competitive landscape. Large players often hold significant market share, but smaller breweries contribute to innovation and niche market segments.
- Innovation Drivers: Consumer demand for unique flavors, styles, and experiences drives innovation. This is coupled with technological advancements in brewing processes and packaging.
- Regulatory Frameworks: Varying regulations across different regions significantly impact production, distribution, and marketing. Understanding these regulations is crucial for successful market entry and operation.
- Product Substitutes: The craft beer industry faces competition from other alcoholic beverages, including wine, spirits, and ready-to-drink cocktails.
- End-User Demographics: The target demographic is evolving, with increasing interest from diverse age groups and consumer preferences.
- M&A Activity: Consolidation through M&A activity has reshaped the industry, with larger companies acquiring smaller breweries to expand their portfolios and market reach.
Craft Beer Industry Market Dynamics & Trends
This section delves into the key drivers shaping the craft beer market's growth trajectory. We analyze market growth rates (CAGR), market penetration rates, and consumer behavior shifts influencing the industry's evolution. Technological disruptions, such as automation in breweries and advancements in packaging, are also examined. The analysis considers changing consumer preferences, the rise of online ordering, and intense competition among brewers. The craft beer market is experiencing a CAGR of XX% during the forecast period, driven by rising disposable incomes and changing lifestyles.
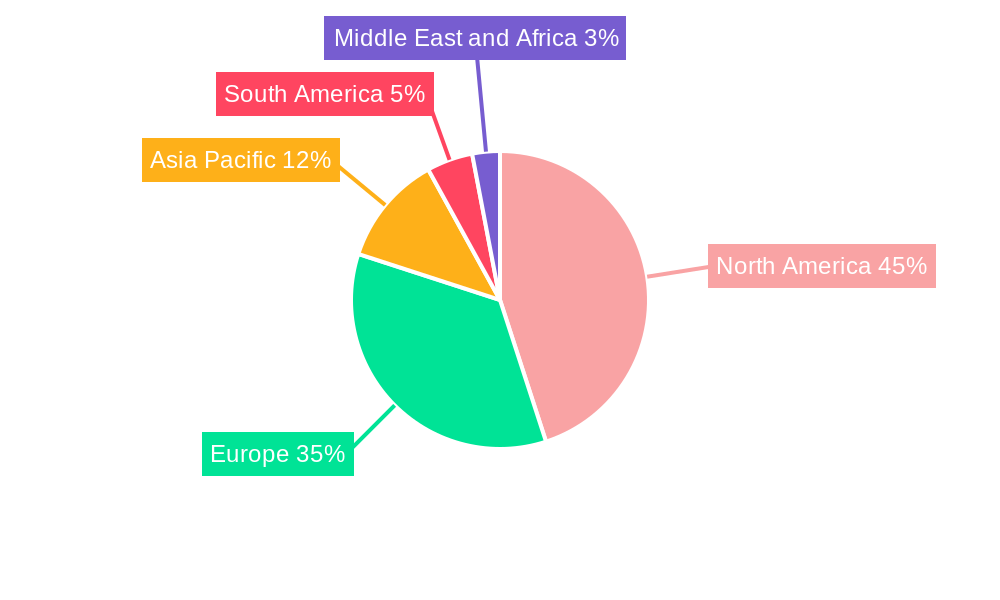
Dominant Regions & Segments in Craft Beer Industry
This section identifies the leading regions, countries, and segments within the craft beer market. We analyze market dominance across different types (Ales, Pilsners and Pale Lagers, Specialty Beers, Other Types) and distribution channels (On-trade, Off-trade).
Key Drivers (Regional Dominance):
- North America: Strong craft beer culture, established distribution networks, and high disposable incomes.
- Europe: Rich brewing history, diverse consumer preferences, and supportive regulatory environments in some regions.
- Asia-Pacific: Rapidly growing economies, increasing disposable incomes, and expanding consumer base.
Segment Dominance: The analysis will detail which beer types (e.g., IPAs, stouts) and distribution channels (e.g., supermarkets, bars) are currently leading the market and the factors influencing their success.
Craft Beer Industry Product Innovations
This section highlights recent product developments, focusing on the technological advancements driving innovation and their impact on market competition. New brewing techniques, innovative flavor profiles, and sustainable packaging solutions are key areas explored. The industry witnesses continuous innovation in beer styles, resulting in new offerings and enhanced consumer experiences. Technological advancements in brewing and packaging enhance efficiency and product quality, leading to a competitive advantage.
Report Scope & Segmentation Analysis
The report segments the craft beer market by Type (Ales, Pilsners and Pale Lagers, Specialty Beers, Other Types) and Distribution Channel (On-trade, Off-trade). Each segment's growth projections, market size, and competitive dynamics are analyzed separately. This provides a granular understanding of various market segments and helps identify promising investment opportunities. For instance, the Specialty Beers segment is projected to witness substantial growth due to increasing consumer preference for unique and experimental flavors. The Off-trade channel is expected to experience significant growth due to the expansion of e-commerce platforms and supermarkets.
Key Drivers of Craft Beer Industry Growth
Several factors contribute to the craft beer market's growth. Technological advancements, such as improved brewing techniques and sophisticated packaging solutions, lead to higher-quality products. Economic factors, including rising disposable incomes in emerging economies, fuel consumption growth. Favorable regulatory environments in some regions also contribute to market expansion.
Challenges in the Craft Beer Industry Sector
The craft beer industry faces challenges such as intense competition, rising raw material costs, and stringent regulatory hurdles in certain markets. Supply chain disruptions can affect production and distribution, impacting profitability. The high cost of entry and maintaining brand visibility also pose significant hurdles for smaller players.
Emerging Opportunities in Craft Beer Industry
Emerging opportunities include the untapped potential of new markets, particularly in developing economies. The adoption of innovative brewing technologies and sustainable practices offers a competitive edge. Catering to evolving consumer preferences, such as healthier options and functional beverages, presents exciting avenues for growth.
Leading Players in the Craft Beer Industry Market
- Anheuser-Busch InBev
- Stone and Wood Brewing Co
- Bell's Brewery Inc
- Constellation Brands
- Molson Coors Beverage Company
- Sierra Nevada Brewing Co
- D G Yuengling & Son Inc
- New Belgium Brewing Company Inc
- The Boston Beer Company Inc
- Heineken NV
Key Developments in Craft Beer Industry
- October 2022: Anheuser-Busch InBev opened a new Budweiser craft brewery in Putian, China, its largest in the Asia-Pacific region. This reflects the company’s strategic focus on expanding in the Chinese market.
- April 2022: Bell's Brewery Inc. launched "Sparkle and SMaSH," a Belgian Tripel, highlighting a commitment to innovation and inclusivity within the craft beer community.
- March 2022: Modelo Company launched new products, including expanded Chelada offerings and Modelo Oro, aiming to capitalize on evolving consumer tastes.
Future Outlook for Craft Beer Industry Market
The craft beer market is poised for continued growth, driven by sustained consumer demand and ongoing product innovation. Strategic partnerships, expansion into new markets, and the adoption of sustainable practices will be crucial for success. The market's future growth will depend on the ability of players to adapt to changing consumer preferences, manage operational challenges, and embrace technological advancements.
Craft Beer Industry Segmentation
-
1. Type
- 1.1. Ales
- 1.2. Pilsners and Pale Lagers
- 1.3. Specialty Beers
- 1.4. Other Types
-
2. Distribution Channel
- 2.1. On-trade
- 2.2. Off-trade
Craft Beer Industry Segmentation By Geography
-
1. North America
- 1.1. United States
- 1.2. Canada
- 1.3. Mexico
- 1.4. Rest of North America
-
2. Europe
- 2.1. Germany
- 2.2. France
- 2.3. United Kingdom
- 2.4. Italy
- 2.5. Spain
- 2.6. Russia
- 2.7. Rest of Europe
-
3. Asia Pacific
- 3.1. India
- 3.2. China
- 3.3. Japan
- 3.4. Australia
- 3.5. Rest of Asia Pacific
-
4. South America
- 4.1. Brazil
- 4.2. Argentina
- 4.3. Rest of South America
-
5. Middle East and Africa
- 5.1. United Arab Emirates
- 5.2. South Africa
- 5.3. Rest of Middle East and Africa
Craft Beer Industry Regional Market Share
Geographic Coverage of Craft Beer Industry
Craft Beer Industry REPORT HIGHLIGHTS
| Aspects | Details |
|---|---|
| Study Period | 2020-2034 |
| Base Year | 2025 |
| Estimated Year | 2026 |
| Forecast Period | 2026-2034 |
| Historical Period | 2020-2025 |
| Growth Rate | CAGR of 1.8% from 2020-2034 |
| Segmentation |
|
Table of Contents
- 1. Introduction
- 1.1. Research Scope
- 1.2. Market Segmentation
- 1.3. Research Methodology
- 1.4. Definitions and Assumptions
- 2. Executive Summary
- 2.1. Introduction
- 3. Market Dynamics
- 3.1. Introduction
- 3.2. Market Drivers
- 3.2.1. Growing Demand for Nutricosmetics Among Millennials; Growing Beauty and Wellness Trend
- 3.3. Market Restrains
- 3.3.1. Stringent Government Regulations and Product Guidelines
- 3.4. Market Trends
- 3.4.1. Rising Number of Microbreweries
- 4. Market Factor Analysis
- 4.1. Porters Five Forces
- 4.2. Supply/Value Chain
- 4.3. PESTEL analysis
- 4.4. Market Entropy
- 4.5. Patent/Trademark Analysis
- 5. Global Craft Beer Industry Analysis, Insights and Forecast, 2020-2032
- 5.1. Market Analysis, Insights and Forecast - by Type
- 5.1.1. Ales
- 5.1.2. Pilsners and Pale Lagers
- 5.1.3. Specialty Beers
- 5.1.4. Other Types
- 5.2. Market Analysis, Insights and Forecast - by Distribution Channel
- 5.2.1. On-trade
- 5.2.2. Off-trade
- 5.3. Market Analysis, Insights and Forecast - by Region
- 5.3.1. North America
- 5.3.2. Europe
- 5.3.3. Asia Pacific
- 5.3.4. South America
- 5.3.5. Middle East and Africa
- 5.1. Market Analysis, Insights and Forecast - by Type
- 6. North America Craft Beer Industry Analysis, Insights and Forecast, 2020-2032
- 6.1. Market Analysis, Insights and Forecast - by Type
- 6.1.1. Ales
- 6.1.2. Pilsners and Pale Lagers
- 6.1.3. Specialty Beers
- 6.1.4. Other Types
- 6.2. Market Analysis, Insights and Forecast - by Distribution Channel
- 6.2.1. On-trade
- 6.2.2. Off-trade
- 6.1. Market Analysis, Insights and Forecast - by Type
- 7. Europe Craft Beer Industry Analysis, Insights and Forecast, 2020-2032
- 7.1. Market Analysis, Insights and Forecast - by Type
- 7.1.1. Ales
- 7.1.2. Pilsners and Pale Lagers
- 7.1.3. Specialty Beers
- 7.1.4. Other Types
- 7.2. Market Analysis, Insights and Forecast - by Distribution Channel
- 7.2.1. On-trade
- 7.2.2. Off-trade
- 7.1. Market Analysis, Insights and Forecast - by Type
- 8. Asia Pacific Craft Beer Industry Analysis, Insights and Forecast, 2020-2032
- 8.1. Market Analysis, Insights and Forecast - by Type
- 8.1.1. Ales
- 8.1.2. Pilsners and Pale Lagers
- 8.1.3. Specialty Beers
- 8.1.4. Other Types
- 8.2. Market Analysis, Insights and Forecast - by Distribution Channel
- 8.2.1. On-trade
- 8.2.2. Off-trade
- 8.1. Market Analysis, Insights and Forecast - by Type
- 9. South America Craft Beer Industry Analysis, Insights and Forecast, 2020-2032
- 9.1. Market Analysis, Insights and Forecast - by Type
- 9.1.1. Ales
- 9.1.2. Pilsners and Pale Lagers
- 9.1.3. Specialty Beers
- 9.1.4. Other Types
- 9.2. Market Analysis, Insights and Forecast - by Distribution Channel
- 9.2.1. On-trade
- 9.2.2. Off-trade
- 9.1. Market Analysis, Insights and Forecast - by Type
- 10. Middle East and Africa Craft Beer Industry Analysis, Insights and Forecast, 2020-2032
- 10.1. Market Analysis, Insights and Forecast - by Type
- 10.1.1. Ales
- 10.1.2. Pilsners and Pale Lagers
- 10.1.3. Specialty Beers
- 10.1.4. Other Types
- 10.2. Market Analysis, Insights and Forecast - by Distribution Channel
- 10.2.1. On-trade
- 10.2.2. Off-trade
- 10.1. Market Analysis, Insights and Forecast - by Type
- 11. Competitive Analysis
- 11.1. Global Market Share Analysis 2025
- 11.2. Company Profiles
- 11.2.1 Anheuser-Busch InBev
- 11.2.1.1. Overview
- 11.2.1.2. Products
- 11.2.1.3. SWOT Analysis
- 11.2.1.4. Recent Developments
- 11.2.1.5. Financials (Based on Availability)
- 11.2.2 Stone and Wood Brewing Co
- 11.2.2.1. Overview
- 11.2.2.2. Products
- 11.2.2.3. SWOT Analysis
- 11.2.2.4. Recent Developments
- 11.2.2.5. Financials (Based on Availability)
- 11.2.3 Bell's Brewery Inc
- 11.2.3.1. Overview
- 11.2.3.2. Products
- 11.2.3.3. SWOT Analysis
- 11.2.3.4. Recent Developments
- 11.2.3.5. Financials (Based on Availability)
- 11.2.4 Constellation Brands
- 11.2.4.1. Overview
- 11.2.4.2. Products
- 11.2.4.3. SWOT Analysis
- 11.2.4.4. Recent Developments
- 11.2.4.5. Financials (Based on Availability)
- 11.2.5 Molson Coors Beverage Company
- 11.2.5.1. Overview
- 11.2.5.2. Products
- 11.2.5.3. SWOT Analysis
- 11.2.5.4. Recent Developments
- 11.2.5.5. Financials (Based on Availability)
- 11.2.6 Sierra Nevada Brewing Co *List Not Exhaustive
- 11.2.6.1. Overview
- 11.2.6.2. Products
- 11.2.6.3. SWOT Analysis
- 11.2.6.4. Recent Developments
- 11.2.6.5. Financials (Based on Availability)
- 11.2.7 D G Yuengling & Son Inc
- 11.2.7.1. Overview
- 11.2.7.2. Products
- 11.2.7.3. SWOT Analysis
- 11.2.7.4. Recent Developments
- 11.2.7.5. Financials (Based on Availability)
- 11.2.8 New Belgium Brewing Company Inc
- 11.2.8.1. Overview
- 11.2.8.2. Products
- 11.2.8.3. SWOT Analysis
- 11.2.8.4. Recent Developments
- 11.2.8.5. Financials (Based on Availability)
- 11.2.9 The Boston Beer Company Inc
- 11.2.9.1. Overview
- 11.2.9.2. Products
- 11.2.9.3. SWOT Analysis
- 11.2.9.4. Recent Developments
- 11.2.9.5. Financials (Based on Availability)
- 11.2.10 Heineken NV
- 11.2.10.1. Overview
- 11.2.10.2. Products
- 11.2.10.3. SWOT Analysis
- 11.2.10.4. Recent Developments
- 11.2.10.5. Financials (Based on Availability)
- 11.2.1 Anheuser-Busch InBev
List of Figures
- Figure 1: Global Craft Beer Industry Revenue Breakdown (billion, %) by Region 2025 & 2033
- Figure 2: Global Craft Beer Industry Volume Breakdown (liter, %) by Region 2025 & 2033
- Figure 3: North America Craft Beer Industry Revenue (billion), by Type 2025 & 2033
- Figure 4: North America Craft Beer Industry Volume (liter), by Type 2025 & 2033
- Figure 5: North America Craft Beer Industry Revenue Share (%), by Type 2025 & 2033
- Figure 6: North America Craft Beer Industry Volume Share (%), by Type 2025 & 2033
- Figure 7: North America Craft Beer Industry Revenue (billion), by Distribution Channel 2025 & 2033
- Figure 8: North America Craft Beer Industry Volume (liter), by Distribution Channel 2025 & 2033
- Figure 9: North America Craft Beer Industry Revenue Share (%), by Distribution Channel 2025 & 2033
- Figure 10: North America Craft Beer Industry Volume Share (%), by Distribution Channel 2025 & 2033
- Figure 11: North America Craft Beer Industry Revenue (billion), by Country 2025 & 2033
- Figure 12: North America Craft Beer Industry Volume (liter), by Country 2025 & 2033
- Figure 13: North America Craft Beer Industry Revenue Share (%), by Country 2025 & 2033
- Figure 14: North America Craft Beer Industry Volume Share (%), by Country 2025 & 2033
- Figure 15: Europe Craft Beer Industry Revenue (billion), by Type 2025 & 2033
- Figure 16: Europe Craft Beer Industry Volume (liter), by Type 2025 & 2033
- Figure 17: Europe Craft Beer Industry Revenue Share (%), by Type 2025 & 2033
- Figure 18: Europe Craft Beer Industry Volume Share (%), by Type 2025 & 2033
- Figure 19: Europe Craft Beer Industry Revenue (billion), by Distribution Channel 2025 & 2033
- Figure 20: Europe Craft Beer Industry Volume (liter), by Distribution Channel 2025 & 2033
- Figure 21: Europe Craft Beer Industry Revenue Share (%), by Distribution Channel 2025 & 2033
- Figure 22: Europe Craft Beer Industry Volume Share (%), by Distribution Channel 2025 & 2033
- Figure 23: Europe Craft Beer Industry Revenue (billion), by Country 2025 & 2033
- Figure 24: Europe Craft Beer Industry Volume (liter), by Country 2025 & 2033
- Figure 25: Europe Craft Beer Industry Revenue Share (%), by Country 2025 & 2033
- Figure 26: Europe Craft Beer Industry Volume Share (%), by Country 2025 & 2033
- Figure 27: Asia Pacific Craft Beer Industry Revenue (billion), by Type 2025 & 2033
- Figure 28: Asia Pacific Craft Beer Industry Volume (liter), by Type 2025 & 2033
- Figure 29: Asia Pacific Craft Beer Industry Revenue Share (%), by Type 2025 & 2033
- Figure 30: Asia Pacific Craft Beer Industry Volume Share (%), by Type 2025 & 2033
- Figure 31: Asia Pacific Craft Beer Industry Revenue (billion), by Distribution Channel 2025 & 2033
- Figure 32: Asia Pacific Craft Beer Industry Volume (liter), by Distribution Channel 2025 & 2033
- Figure 33: Asia Pacific Craft Beer Industry Revenue Share (%), by Distribution Channel 2025 & 2033
- Figure 34: Asia Pacific Craft Beer Industry Volume Share (%), by Distribution Channel 2025 & 2033
- Figure 35: Asia Pacific Craft Beer Industry Revenue (billion), by Country 2025 & 2033
- Figure 36: Asia Pacific Craft Beer Industry Volume (liter), by Country 2025 & 2033
- Figure 37: Asia Pacific Craft Beer Industry Revenue Share (%), by Country 2025 & 2033
- Figure 38: Asia Pacific Craft Beer Industry Volume Share (%), by Country 2025 & 2033
- Figure 39: South America Craft Beer Industry Revenue (billion), by Type 2025 & 2033
- Figure 40: South America Craft Beer Industry Volume (liter), by Type 2025 & 2033
- Figure 41: South America Craft Beer Industry Revenue Share (%), by Type 2025 & 2033
- Figure 42: South America Craft Beer Industry Volume Share (%), by Type 2025 & 2033
- Figure 43: South America Craft Beer Industry Revenue (billion), by Distribution Channel 2025 & 2033
- Figure 44: South America Craft Beer Industry Volume (liter), by Distribution Channel 2025 & 2033
- Figure 45: South America Craft Beer Industry Revenue Share (%), by Distribution Channel 2025 & 2033
- Figure 46: South America Craft Beer Industry Volume Share (%), by Distribution Channel 2025 & 2033
- Figure 47: South America Craft Beer Industry Revenue (billion), by Country 2025 & 2033
- Figure 48: South America Craft Beer Industry Volume (liter), by Country 2025 & 2033
- Figure 49: South America Craft Beer Industry Revenue Share (%), by Country 2025 & 2033
- Figure 50: South America Craft Beer Industry Volume Share (%), by Country 2025 & 2033
- Figure 51: Middle East and Africa Craft Beer Industry Revenue (billion), by Type 2025 & 2033
- Figure 52: Middle East and Africa Craft Beer Industry Volume (liter), by Type 2025 & 2033
- Figure 53: Middle East and Africa Craft Beer Industry Revenue Share (%), by Type 2025 & 2033
- Figure 54: Middle East and Africa Craft Beer Industry Volume Share (%), by Type 2025 & 2033
- Figure 55: Middle East and Africa Craft Beer Industry Revenue (billion), by Distribution Channel 2025 & 2033
- Figure 56: Middle East and Africa Craft Beer Industry Volume (liter), by Distribution Channel 2025 & 2033
- Figure 57: Middle East and Africa Craft Beer Industry Revenue Share (%), by Distribution Channel 2025 & 2033
- Figure 58: Middle East and Africa Craft Beer Industry Volume Share (%), by Distribution Channel 2025 & 2033
- Figure 59: Middle East and Africa Craft Beer Industry Revenue (billion), by Country 2025 & 2033
- Figure 60: Middle East and Africa Craft Beer Industry Volume (liter), by Country 2025 & 2033
- Figure 61: Middle East and Africa Craft Beer Industry Revenue Share (%), by Country 2025 & 2033
- Figure 62: Middle East and Africa Craft Beer Industry Volume Share (%), by Country 2025 & 2033
List of Tables
- Table 1: Global Craft Beer Industry Revenue billion Forecast, by Type 2020 & 2033
- Table 2: Global Craft Beer Industry Volume liter Forecast, by Type 2020 & 2033
- Table 3: Global Craft Beer Industry Revenue billion Forecast, by Distribution Channel 2020 & 2033
- Table 4: Global Craft Beer Industry Volume liter Forecast, by Distribution Channel 2020 & 2033
- Table 5: Global Craft Beer Industry Revenue billion Forecast, by Region 2020 & 2033
- Table 6: Global Craft Beer Industry Volume liter Forecast, by Region 2020 & 2033
- Table 7: Global Craft Beer Industry Revenue billion Forecast, by Type 2020 & 2033
- Table 8: Global Craft Beer Industry Volume liter Forecast, by Type 2020 & 2033
- Table 9: Global Craft Beer Industry Revenue billion Forecast, by Distribution Channel 2020 & 2033
- Table 10: Global Craft Beer Industry Volume liter Forecast, by Distribution Channel 2020 & 2033
- Table 11: Global Craft Beer Industry Revenue billion Forecast, by Country 2020 & 2033
- Table 12: Global Craft Beer Industry Volume liter Forecast, by Country 2020 & 2033
- Table 13: United States Craft Beer Industry Revenue (billion) Forecast, by Application 2020 & 2033
- Table 14: United States Craft Beer Industry Volume (liter) Forecast, by Application 2020 & 2033
- Table 15: Canada Craft Beer Industry Revenue (billion) Forecast, by Application 2020 & 2033
- Table 16: Canada Craft Beer Industry Volume (liter) Forecast, by Application 2020 & 2033
- Table 17: Mexico Craft Beer Industry Revenue (billion) Forecast, by Application 2020 & 2033
- Table 18: Mexico Craft Beer Industry Volume (liter) Forecast, by Application 2020 & 2033
- Table 19: Rest of North America Craft Beer Industry Revenue (billion) Forecast, by Application 2020 & 2033
- Table 20: Rest of North America Craft Beer Industry Volume (liter) Forecast, by Application 2020 & 2033
- Table 21: Global Craft Beer Industry Revenue billion Forecast, by Type 2020 & 2033
- Table 22: Global Craft Beer Industry Volume liter Forecast, by Type 2020 & 2033
- Table 23: Global Craft Beer Industry Revenue billion Forecast, by Distribution Channel 2020 & 2033
- Table 24: Global Craft Beer Industry Volume liter Forecast, by Distribution Channel 2020 & 2033
- Table 25: Global Craft Beer Industry Revenue billion Forecast, by Country 2020 & 2033
- Table 26: Global Craft Beer Industry Volume liter Forecast, by Country 2020 & 2033
- Table 27: Germany Craft Beer Industry Revenue (billion) Forecast, by Application 2020 & 2033
- Table 28: Germany Craft Beer Industry Volume (liter) Forecast, by Application 2020 & 2033
- Table 29: France Craft Beer Industry Revenue (billion) Forecast, by Application 2020 & 2033
- Table 30: France Craft Beer Industry Volume (liter) Forecast, by Application 2020 & 2033
- Table 31: United Kingdom Craft Beer Industry Revenue (billion) Forecast, by Application 2020 & 2033
- Table 32: United Kingdom Craft Beer Industry Volume (liter) Forecast, by Application 2020 & 2033
- Table 33: Italy Craft Beer Industry Revenue (billion) Forecast, by Application 2020 & 2033
- Table 34: Italy Craft Beer Industry Volume (liter) Forecast, by Application 2020 & 2033
- Table 35: Spain Craft Beer Industry Revenue (billion) Forecast, by Application 2020 & 2033
- Table 36: Spain Craft Beer Industry Volume (liter) Forecast, by Application 2020 & 2033
- Table 37: Russia Craft Beer Industry Revenue (billion) Forecast, by Application 2020 & 2033
- Table 38: Russia Craft Beer Industry Volume (liter) Forecast, by Application 2020 & 2033
- Table 39: Rest of Europe Craft Beer Industry Revenue (billion) Forecast, by Application 2020 & 2033
- Table 40: Rest of Europe Craft Beer Industry Volume (liter) Forecast, by Application 2020 & 2033
- Table 41: Global Craft Beer Industry Revenue billion Forecast, by Type 2020 & 2033
- Table 42: Global Craft Beer Industry Volume liter Forecast, by Type 2020 & 2033
- Table 43: Global Craft Beer Industry Revenue billion Forecast, by Distribution Channel 2020 & 2033
- Table 44: Global Craft Beer Industry Volume liter Forecast, by Distribution Channel 2020 & 2033
- Table 45: Global Craft Beer Industry Revenue billion Forecast, by Country 2020 & 2033
- Table 46: Global Craft Beer Industry Volume liter Forecast, by Country 2020 & 2033
- Table 47: India Craft Beer Industry Revenue (billion) Forecast, by Application 2020 & 2033
- Table 48: India Craft Beer Industry Volume (liter) Forecast, by Application 2020 & 2033
- Table 49: China Craft Beer Industry Revenue (billion) Forecast, by Application 2020 & 2033
- Table 50: China Craft Beer Industry Volume (liter) Forecast, by Application 2020 & 2033
- Table 51: Japan Craft Beer Industry Revenue (billion) Forecast, by Application 2020 & 2033
- Table 52: Japan Craft Beer Industry Volume (liter) Forecast, by Application 2020 & 2033
- Table 53: Australia Craft Beer Industry Revenue (billion) Forecast, by Application 2020 & 2033
- Table 54: Australia Craft Beer Industry Volume (liter) Forecast, by Application 2020 & 2033
- Table 55: Rest of Asia Pacific Craft Beer Industry Revenue (billion) Forecast, by Application 2020 & 2033
- Table 56: Rest of Asia Pacific Craft Beer Industry Volume (liter) Forecast, by Application 2020 & 2033
- Table 57: Global Craft Beer Industry Revenue billion Forecast, by Type 2020 & 2033
- Table 58: Global Craft Beer Industry Volume liter Forecast, by Type 2020 & 2033
- Table 59: Global Craft Beer Industry Revenue billion Forecast, by Distribution Channel 2020 & 2033
- Table 60: Global Craft Beer Industry Volume liter Forecast, by Distribution Channel 2020 & 2033
- Table 61: Global Craft Beer Industry Revenue billion Forecast, by Country 2020 & 2033
- Table 62: Global Craft Beer Industry Volume liter Forecast, by Country 2020 & 2033
- Table 63: Brazil Craft Beer Industry Revenue (billion) Forecast, by Application 2020 & 2033
- Table 64: Brazil Craft Beer Industry Volume (liter) Forecast, by Application 2020 & 2033
- Table 65: Argentina Craft Beer Industry Revenue (billion) Forecast, by Application 2020 & 2033
- Table 66: Argentina Craft Beer Industry Volume (liter) Forecast, by Application 2020 & 2033
- Table 67: Rest of South America Craft Beer Industry Revenue (billion) Forecast, by Application 2020 & 2033
- Table 68: Rest of South America Craft Beer Industry Volume (liter) Forecast, by Application 2020 & 2033
- Table 69: Global Craft Beer Industry Revenue billion Forecast, by Type 2020 & 2033
- Table 70: Global Craft Beer Industry Volume liter Forecast, by Type 2020 & 2033
- Table 71: Global Craft Beer Industry Revenue billion Forecast, by Distribution Channel 2020 & 2033
- Table 72: Global Craft Beer Industry Volume liter Forecast, by Distribution Channel 2020 & 2033
- Table 73: Global Craft Beer Industry Revenue billion Forecast, by Country 2020 & 2033
- Table 74: Global Craft Beer Industry Volume liter Forecast, by Country 2020 & 2033
- Table 75: United Arab Emirates Craft Beer Industry Revenue (billion) Forecast, by Application 2020 & 2033
- Table 76: United Arab Emirates Craft Beer Industry Volume (liter) Forecast, by Application 2020 & 2033
- Table 77: South Africa Craft Beer Industry Revenue (billion) Forecast, by Application 2020 & 2033
- Table 78: South Africa Craft Beer Industry Volume (liter) Forecast, by Application 2020 & 2033
- Table 79: Rest of Middle East and Africa Craft Beer Industry Revenue (billion) Forecast, by Application 2020 & 2033
- Table 80: Rest of Middle East and Africa Craft Beer Industry Volume (liter) Forecast, by Application 2020 & 2033
Frequently Asked Questions
1. What is the projected Compound Annual Growth Rate (CAGR) of the Craft Beer Industry?
The projected CAGR is approximately 1.8%.
2. Which companies are prominent players in the Craft Beer Industry?
Key companies in the market include Anheuser-Busch InBev, Stone and Wood Brewing Co, Bell's Brewery Inc, Constellation Brands, Molson Coors Beverage Company, Sierra Nevada Brewing Co *List Not Exhaustive, D G Yuengling & Son Inc, New Belgium Brewing Company Inc, The Boston Beer Company Inc, Heineken NV.
3. What are the main segments of the Craft Beer Industry?
The market segments include Type, Distribution Channel.
4. Can you provide details about the market size?
The market size is estimated to be USD 7.4 billion as of 2022.
5. What are some drivers contributing to market growth?
Growing Demand for Nutricosmetics Among Millennials; Growing Beauty and Wellness Trend.
6. What are the notable trends driving market growth?
Rising Number of Microbreweries.
7. Are there any restraints impacting market growth?
Stringent Government Regulations and Product Guidelines.
8. Can you provide examples of recent developments in the market?
In October 2022, as part of Anheuser-Busch InBev's strategy to accelerate economic growth in China and better meet consumer needs, Budweiser APAC opened a new brewery in Putian, China. A Budweiser craft brewery in the Fujian province is Budweiser's largest craft brewery in the Asia-Pacific.
9. What pricing options are available for accessing the report?
Pricing options include single-user, multi-user, and enterprise licenses priced at USD 4750, USD 5250, and USD 8750 respectively.
10. Is the market size provided in terms of value or volume?
The market size is provided in terms of value, measured in billion and volume, measured in liter.
11. Are there any specific market keywords associated with the report?
Yes, the market keyword associated with the report is "Craft Beer Industry," which aids in identifying and referencing the specific market segment covered.
12. How do I determine which pricing option suits my needs best?
The pricing options vary based on user requirements and access needs. Individual users may opt for single-user licenses, while businesses requiring broader access may choose multi-user or enterprise licenses for cost-effective access to the report.
13. Are there any additional resources or data provided in the Craft Beer Industry report?
While the report offers comprehensive insights, it's advisable to review the specific contents or supplementary materials provided to ascertain if additional resources or data are available.
14. How can I stay updated on further developments or reports in the Craft Beer Industry?
To stay informed about further developments, trends, and reports in the Craft Beer Industry, consider subscribing to industry newsletters, following relevant companies and organizations, or regularly checking reputable industry news sources and publications.
Methodology
Step 1 - Identification of Relevant Samples Size from Population Database


Step 2 - Approaches for Defining Global Market Size (Value, Volume* & Price*)

Note*: In applicable scenarios
Step 3 - Data Sources
Primary Research
- Web Analytics
- Survey Reports
- Research Institute
- Latest Research Reports
- Opinion Leaders
Secondary Research
- Annual Reports
- White Paper
- Latest Press Release
- Industry Association
- Paid Database
- Investor Presentations

Step 4 - Data Triangulation
Involves using different sources of information in order to increase the validity of a study
These sources are likely to be stakeholders in a program - participants, other researchers, program staff, other community members, and so on.
Then we put all data in single framework & apply various statistical tools to find out the dynamic on the market.
During the analysis stage, feedback from the stakeholder groups would be compared to determine areas of agreement as well as areas of divergence

