
Key Insights
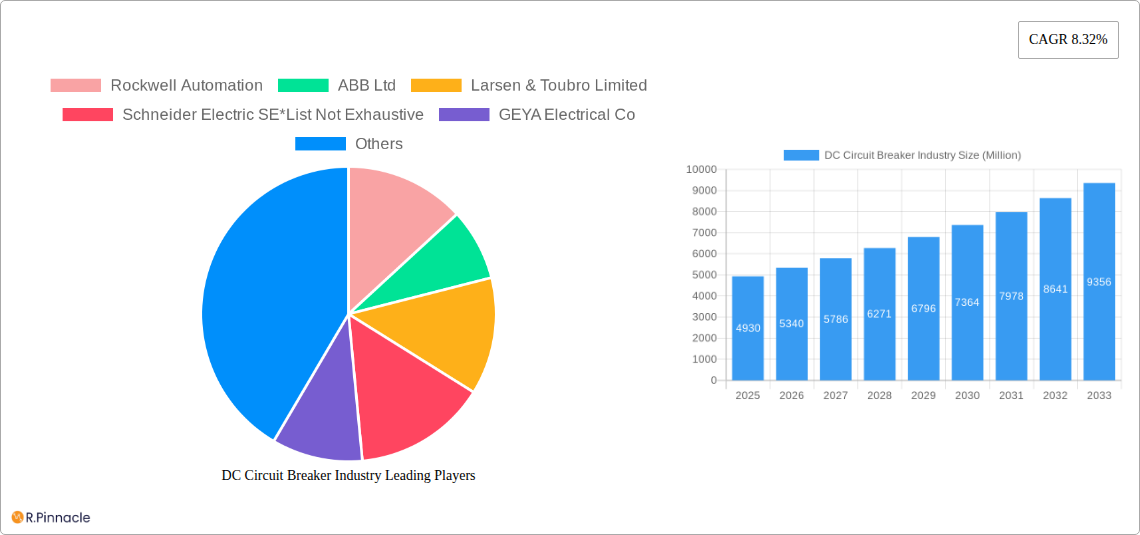
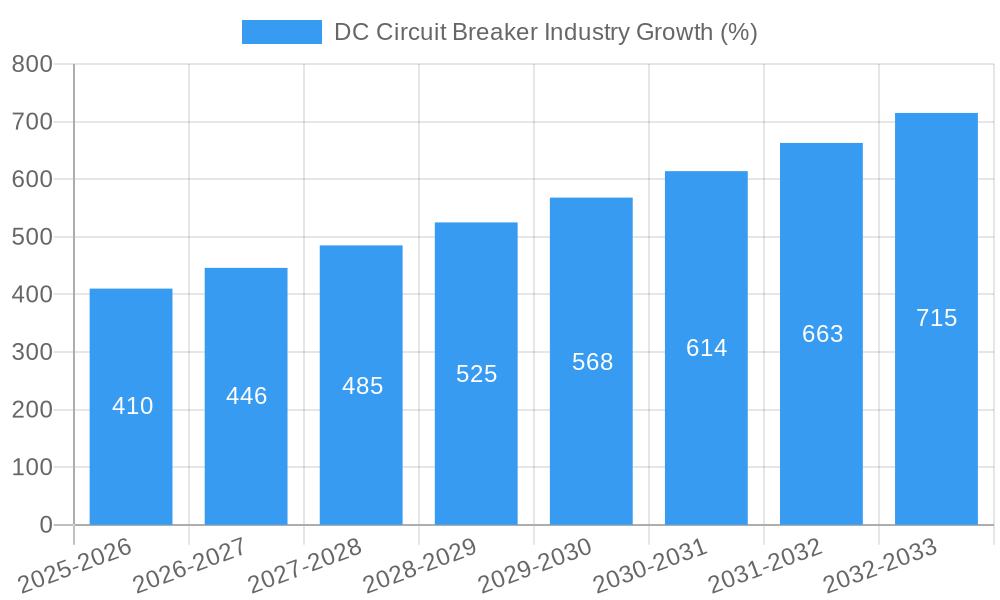
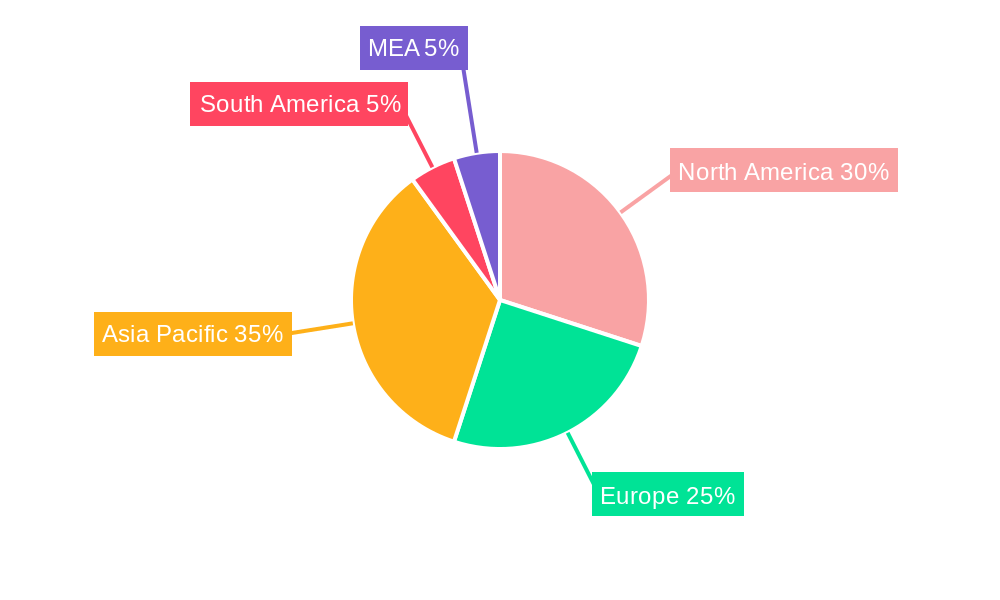
The global DC circuit breaker market, valued at $4.93 billion in 2025, is projected to experience robust growth, driven by the escalating demand for renewable energy sources and the expansion of energy storage systems (ESS). The increasing adoption of electric vehicles (EVs) and the growth of data centers are also significant contributors to market expansion. A compound annual growth rate (CAGR) of 8.32% is anticipated from 2025 to 2033, indicating a substantial market opportunity. Key segments driving this growth include solid-state circuit breakers, owing to their superior performance and reliability, and those utilized in high-voltage applications, reflecting the increasing power capacity of renewable energy installations and grid infrastructure. The market is geographically diverse, with North America and Asia-Pacific expected to be leading regions, fueled by significant investments in renewable energy projects and robust industrial growth. However, challenges such as high initial investment costs for certain breaker types and the need for specialized installation expertise could potentially restrain market growth to some extent.
Technological advancements are continuously shaping the DC circuit breaker landscape. The development of more efficient and compact designs, coupled with improved monitoring and control capabilities, is expected to further boost market adoption. Increased focus on grid stability and reliability, along with stringent environmental regulations promoting clean energy solutions, will propel the market forward. The competitive landscape is characterized by a mix of established players like ABB, Siemens, and Eaton, along with several regional and specialized manufacturers. These companies are actively engaged in R&D, strategic partnerships, and mergers and acquisitions to strengthen their market positions and offer innovative solutions. The market’s growth trajectory is expected to be influenced by government policies promoting renewable energy integration and advancements in power electronics technology.
DC Circuit Breaker Industry: A Comprehensive Market Report (2019-2033)
This comprehensive report provides an in-depth analysis of the global DC Circuit Breaker industry, offering invaluable insights for industry professionals, investors, and strategic decision-makers. With a study period spanning 2019-2033, a base year of 2025, and a forecast period of 2025-2033, this report delivers a meticulous examination of market trends, dynamics, and future projections. The report encompasses a detailed market sizing of $XX Million in 2025, and projects a CAGR of XX% during the forecast period.
DC Circuit Breaker Industry Market Structure & Innovation Trends
This section analyzes the competitive landscape of the DC circuit breaker market, examining market concentration, key innovation drivers, regulatory influences, and the impact of mergers and acquisitions (M&A). The report identifies key players such as Rockwell Automation, ABB Ltd, Larsen & Toubro Limited, Schneider Electric SE, GEYA Electrical Co, Mitsubishi Electric Corporation, Siemens AG, Nader Electrical, Eaton Corporation PLC, Powell Industries Inc, Entec Electric & Electronic Co Ltd, Fuji Electric Co Ltd, and Hyundai Electric & Energy Systems Company (list not exhaustive).
- Market Concentration: The market exhibits a moderately concentrated structure with a few dominant players holding significant market share. The report quantifies market share for major players, detailing their strategies and competitive positions. Further, analysis is included on the impact of recent M&A activities.
- Innovation Drivers: Key innovation drivers include the increasing demand for renewable energy sources, the need for improved grid infrastructure, and advancements in materials science leading to the development of more efficient and reliable circuit breakers.
- Regulatory Frameworks: Government regulations concerning grid modernization and the integration of renewable energy sources significantly impact the market. The report details relevant regulations across key regions.
- Product Substitutes & Technological Disruption: While few direct substitutes exist, the report analyzes potential technological disruptions and their impacts on market dynamics.
- M&A Activity: The report details recent M&A activity, including deal values and their implications for market consolidation and technological advancement. For example, Mitsubishi's acquisition of Scibreak AB in February 2023 highlights the growing interest in DCCB technology. The overall value of M&A deals within the past 5 years is estimated at $XX Million.
DC Circuit Breaker Industry Market Dynamics & Trends
This section explores the key factors driving market growth, including technological advancements, evolving consumer preferences, and competitive dynamics. The report uses a comprehensive analysis of market growth drivers, technological disruptions, changing consumer needs, and competitive pressures to provide a complete picture of the market's trajectory. The section features a detailed breakdown of market segmentation and the impact of various factors on market growth.
Dominant Regions & Segments in DC Circuit Breaker Industry
This section identifies the leading regions and segments within the DC circuit breaker market. The analysis considers various segments including:
- By Type: Solid-State, Hybrid
- By Insulation: Gas, Vacuum
- By Voltage: Low Voltage, Medium Voltage, High Voltage
- By End-User: Transmission and Distribution, Renewables and Energy Storage Systems, Commercial, Others
Dominant Regions: [Insert dominant region and country analysis here, including factors like economic policies, infrastructure development, and government initiatives supporting renewable energy. Specific examples of regions driving growth, supported by data, should be provided.].
Dominant Segments: [Insert detailed dominance analysis for each segment listed above. Include specific data points explaining why a specific segment is the leading segment within its category. Example: High Voltage segment is dominant due to growth in renewable energy and HVDC transmission projects. ]
DC Circuit Breaker Industry Product Innovations
This section summarizes recent product developments, highlighting key technological trends and market fit. The focus is on advancements in materials, design, and functionalities that improve efficiency, reliability, and safety. The growing adoption of eco-friendly circuit breakers, such as Siemens Energy's Blue DC circuit breakers, is a significant trend.
Report Scope & Segmentation Analysis
This report provides a detailed segmentation analysis covering Type (Solid-State, Hybrid), Insulation (Gas, Vacuum), Voltage (Low, Medium, High), and End-User (Transmission & Distribution, Renewables & Energy Storage, Commercial, Others). Each segment's market size, growth projections, and competitive dynamics are thoroughly examined. [Insert paragraph per segment detailing its market size, growth projections, and competitive landscape.].
Key Drivers of DC Circuit Breaker Industry Growth
Several factors fuel the growth of the DC circuit breaker industry. These include the increasing global demand for renewable energy, necessitating advanced grid infrastructure capable of handling fluctuating power sources. Government initiatives promoting grid modernization and the integration of renewable energy also contribute significantly. Furthermore, technological advancements resulting in more efficient and reliable circuit breakers are another key driver.
Challenges in the DC Circuit Breaker Industry Sector
The DC circuit breaker industry faces challenges such as stringent regulatory requirements, supply chain complexities leading to potential material shortages, and intense competition from established players. These factors can impact production costs, delivery times, and overall market growth. The report quantifies the impact of these challenges where data is available.
Emerging Opportunities in DC Circuit Breaker Industry
The industry presents significant growth opportunities in emerging markets with expanding power grids and increasing renewable energy adoption. Advancements in solid-state and hybrid technologies, offering enhanced efficiency and performance, create new market avenues. Furthermore, increasing demand for grid modernization and the development of smart grids present further opportunities.
Leading Players in the DC Circuit Breaker Industry Market
- Rockwell Automation
- ABB Ltd
- Larsen & Toubro Limited
- Schneider Electric SE
- GEYA Electrical Co
- Mitsubishi Electric Corporation
- Siemens AG
- Nader Electrical
- Eaton Corporation PLC
- Powell Industries Inc
- Entec Electric & Electronic Co Ltd
- Fuji Electric Co Ltd
- Hyundai Electric & Energy Systems Company
Key Developments in DC Circuit Breaker Industry
- February 2023: Mitsubishi acquired Scibreak AB, accelerating DCCB technology development for HVDC systems.
- March 2022: National Grid and Siemens Energy partnered to upgrade a substation with Siemens' fluorinated gas-free Blue DC circuit breakers, showcasing a commitment to sustainable technologies.
Future Outlook for DC Circuit Breaker Industry Market
The DC circuit breaker market is poised for robust growth driven by the global shift towards renewable energy and the consequent need for efficient grid infrastructure. Continued technological advancements, particularly in solid-state and hybrid technologies, will further fuel market expansion. Strategic partnerships and M&A activity will likely shape the competitive landscape in the coming years.
DC Circuit Breaker Industry Segmentation
-
1. Type
- 1.1. Solid-State
- 1.2. Hybrid
-
2. Insulation
- 2.1. Gas
- 2.2. Vacuum
-
3. Voltage
- 3.1. Low Volatage
- 3.2. Medium Voltage
- 3.3. High Voltage
-
4. End-User
- 4.1. Transmission and Distribution
- 4.2. Renewables and Energy Storage Systems
- 4.3. Commercial
- 4.4. Others
DC Circuit Breaker Industry Segmentation By Geography
-
1. North America
- 1.1. United States of America
- 1.2. Canada
- 1.3. Rest of the North America
-
2. Europe
- 2.1. United Kingdom
- 2.2. Germany
- 2.3. France
- 2.4. Italy
- 2.5. Rest of the Europe
-
3. Asia Pacific
- 3.1. China
- 3.2. India
- 3.3. South Korea
- 3.4. Rest of the Asia Pacific
-
4. South America
- 4.1. Brazil
- 4.2. Argentina
- 4.3. Rest of the South America
-
5. Middle East and Africa
- 5.1. United Arab Emirates
- 5.2. Saudi Arabia
- 5.3. Rest of the Middle East and Africa
DC Circuit Breaker Industry REPORT HIGHLIGHTS
| Aspects | Details |
|---|---|
| Study Period | 2019-2033 |
| Base Year | 2024 |
| Estimated Year | 2025 |
| Forecast Period | 2025-2033 |
| Historical Period | 2019-2024 |
| Growth Rate | CAGR of 8.32% from 2019-2033 |
| Segmentation |
|
Table of Contents
- 1. Introduction
- 1.1. Research Scope
- 1.2. Market Segmentation
- 1.3. Research Methodology
- 1.4. Definitions and Assumptions
- 2. Executive Summary
- 2.1. Introduction
- 3. Market Dynamics
- 3.1. Introduction
- 3.2. Market Drivers
- 3.2.1. 4.; The Rise of an Influx of Renewable Sources 4.; Rising Adoption of HVDC Transmission
- 3.3. Market Restrains
- 3.3.1 4.; A Rise in the Stability of Electricity Supply
- 3.3.2 thereby Reducing the Need for Circuit Breakers
- 3.4. Market Trends
- 3.4.1. Solid-State Segment Expected to Dominate the Market
- 4. Market Factor Analysis
- 4.1. Porters Five Forces
- 4.2. Supply/Value Chain
- 4.3. PESTEL analysis
- 4.4. Market Entropy
- 4.5. Patent/Trademark Analysis
- 5. Global DC Circuit Breaker Industry Analysis, Insights and Forecast, 2019-2031
- 5.1. Market Analysis, Insights and Forecast - by Type
- 5.1.1. Solid-State
- 5.1.2. Hybrid
- 5.2. Market Analysis, Insights and Forecast - by Insulation
- 5.2.1. Gas
- 5.2.2. Vacuum
- 5.3. Market Analysis, Insights and Forecast - by Voltage
- 5.3.1. Low Volatage
- 5.3.2. Medium Voltage
- 5.3.3. High Voltage
- 5.4. Market Analysis, Insights and Forecast - by End-User
- 5.4.1. Transmission and Distribution
- 5.4.2. Renewables and Energy Storage Systems
- 5.4.3. Commercial
- 5.4.4. Others
- 5.5. Market Analysis, Insights and Forecast - by Region
- 5.5.1. North America
- 5.5.2. Europe
- 5.5.3. Asia Pacific
- 5.5.4. South America
- 5.5.5. Middle East and Africa
- 5.1. Market Analysis, Insights and Forecast - by Type
- 6. North America DC Circuit Breaker Industry Analysis, Insights and Forecast, 2019-2031
- 6.1. Market Analysis, Insights and Forecast - by Type
- 6.1.1. Solid-State
- 6.1.2. Hybrid
- 6.2. Market Analysis, Insights and Forecast - by Insulation
- 6.2.1. Gas
- 6.2.2. Vacuum
- 6.3. Market Analysis, Insights and Forecast - by Voltage
- 6.3.1. Low Volatage
- 6.3.2. Medium Voltage
- 6.3.3. High Voltage
- 6.4. Market Analysis, Insights and Forecast - by End-User
- 6.4.1. Transmission and Distribution
- 6.4.2. Renewables and Energy Storage Systems
- 6.4.3. Commercial
- 6.4.4. Others
- 6.1. Market Analysis, Insights and Forecast - by Type
- 7. Europe DC Circuit Breaker Industry Analysis, Insights and Forecast, 2019-2031
- 7.1. Market Analysis, Insights and Forecast - by Type
- 7.1.1. Solid-State
- 7.1.2. Hybrid
- 7.2. Market Analysis, Insights and Forecast - by Insulation
- 7.2.1. Gas
- 7.2.2. Vacuum
- 7.3. Market Analysis, Insights and Forecast - by Voltage
- 7.3.1. Low Volatage
- 7.3.2. Medium Voltage
- 7.3.3. High Voltage
- 7.4. Market Analysis, Insights and Forecast - by End-User
- 7.4.1. Transmission and Distribution
- 7.4.2. Renewables and Energy Storage Systems
- 7.4.3. Commercial
- 7.4.4. Others
- 7.1. Market Analysis, Insights and Forecast - by Type
- 8. Asia Pacific DC Circuit Breaker Industry Analysis, Insights and Forecast, 2019-2031
- 8.1. Market Analysis, Insights and Forecast - by Type
- 8.1.1. Solid-State
- 8.1.2. Hybrid
- 8.2. Market Analysis, Insights and Forecast - by Insulation
- 8.2.1. Gas
- 8.2.2. Vacuum
- 8.3. Market Analysis, Insights and Forecast - by Voltage
- 8.3.1. Low Volatage
- 8.3.2. Medium Voltage
- 8.3.3. High Voltage
- 8.4. Market Analysis, Insights and Forecast - by End-User
- 8.4.1. Transmission and Distribution
- 8.4.2. Renewables and Energy Storage Systems
- 8.4.3. Commercial
- 8.4.4. Others
- 8.1. Market Analysis, Insights and Forecast - by Type
- 9. South America DC Circuit Breaker Industry Analysis, Insights and Forecast, 2019-2031
- 9.1. Market Analysis, Insights and Forecast - by Type
- 9.1.1. Solid-State
- 9.1.2. Hybrid
- 9.2. Market Analysis, Insights and Forecast - by Insulation
- 9.2.1. Gas
- 9.2.2. Vacuum
- 9.3. Market Analysis, Insights and Forecast - by Voltage
- 9.3.1. Low Volatage
- 9.3.2. Medium Voltage
- 9.3.3. High Voltage
- 9.4. Market Analysis, Insights and Forecast - by End-User
- 9.4.1. Transmission and Distribution
- 9.4.2. Renewables and Energy Storage Systems
- 9.4.3. Commercial
- 9.4.4. Others
- 9.1. Market Analysis, Insights and Forecast - by Type
- 10. Middle East and Africa DC Circuit Breaker Industry Analysis, Insights and Forecast, 2019-2031
- 10.1. Market Analysis, Insights and Forecast - by Type
- 10.1.1. Solid-State
- 10.1.2. Hybrid
- 10.2. Market Analysis, Insights and Forecast - by Insulation
- 10.2.1. Gas
- 10.2.2. Vacuum
- 10.3. Market Analysis, Insights and Forecast - by Voltage
- 10.3.1. Low Volatage
- 10.3.2. Medium Voltage
- 10.3.3. High Voltage
- 10.4. Market Analysis, Insights and Forecast - by End-User
- 10.4.1. Transmission and Distribution
- 10.4.2. Renewables and Energy Storage Systems
- 10.4.3. Commercial
- 10.4.4. Others
- 10.1. Market Analysis, Insights and Forecast - by Type
- 11. North America DC Circuit Breaker Industry Analysis, Insights and Forecast, 2019-2031
- 11.1. Market Analysis, Insights and Forecast - By Country/Sub-region
- 11.1.1 United States
- 11.1.2 Canada
- 11.1.3 Mexico
- 12. Europe DC Circuit Breaker Industry Analysis, Insights and Forecast, 2019-2031
- 12.1. Market Analysis, Insights and Forecast - By Country/Sub-region
- 12.1.1 Germany
- 12.1.2 United Kingdom
- 12.1.3 France
- 12.1.4 Spain
- 12.1.5 Italy
- 12.1.6 Spain
- 12.1.7 Belgium
- 12.1.8 Netherland
- 12.1.9 Nordics
- 12.1.10 Rest of Europe
- 13. Asia Pacific DC Circuit Breaker Industry Analysis, Insights and Forecast, 2019-2031
- 13.1. Market Analysis, Insights and Forecast - By Country/Sub-region
- 13.1.1 China
- 13.1.2 Japan
- 13.1.3 India
- 13.1.4 South Korea
- 13.1.5 Southeast Asia
- 13.1.6 Australia
- 13.1.7 Indonesia
- 13.1.8 Phillipes
- 13.1.9 Singapore
- 13.1.10 Thailandc
- 13.1.11 Rest of Asia Pacific
- 14. South America DC Circuit Breaker Industry Analysis, Insights and Forecast, 2019-2031
- 14.1. Market Analysis, Insights and Forecast - By Country/Sub-region
- 14.1.1 Brazil
- 14.1.2 Argentina
- 14.1.3 Peru
- 14.1.4 Chile
- 14.1.5 Colombia
- 14.1.6 Ecuador
- 14.1.7 Venezuela
- 14.1.8 Rest of South America
- 15. North America DC Circuit Breaker Industry Analysis, Insights and Forecast, 2019-2031
- 15.1. Market Analysis, Insights and Forecast - By Country/Sub-region
- 15.1.1 United States
- 15.1.2 Canada
- 15.1.3 Mexico
- 16. MEA DC Circuit Breaker Industry Analysis, Insights and Forecast, 2019-2031
- 16.1. Market Analysis, Insights and Forecast - By Country/Sub-region
- 16.1.1 United Arab Emirates
- 16.1.2 Saudi Arabia
- 16.1.3 South Africa
- 16.1.4 Rest of Middle East and Africa
- 17. Competitive Analysis
- 17.1. Global Market Share Analysis 2024
- 17.2. Company Profiles
- 17.2.1 Rockwell Automation
- 17.2.1.1. Overview
- 17.2.1.2. Products
- 17.2.1.3. SWOT Analysis
- 17.2.1.4. Recent Developments
- 17.2.1.5. Financials (Based on Availability)
- 17.2.2 ABB Ltd
- 17.2.2.1. Overview
- 17.2.2.2. Products
- 17.2.2.3. SWOT Analysis
- 17.2.2.4. Recent Developments
- 17.2.2.5. Financials (Based on Availability)
- 17.2.3 Larsen & Toubro Limited
- 17.2.3.1. Overview
- 17.2.3.2. Products
- 17.2.3.3. SWOT Analysis
- 17.2.3.4. Recent Developments
- 17.2.3.5. Financials (Based on Availability)
- 17.2.4 Schneider Electric SE*List Not Exhaustive
- 17.2.4.1. Overview
- 17.2.4.2. Products
- 17.2.4.3. SWOT Analysis
- 17.2.4.4. Recent Developments
- 17.2.4.5. Financials (Based on Availability)
- 17.2.5 GEYA Electrical Co
- 17.2.5.1. Overview
- 17.2.5.2. Products
- 17.2.5.3. SWOT Analysis
- 17.2.5.4. Recent Developments
- 17.2.5.5. Financials (Based on Availability)
- 17.2.6 Mitsubishi Electric Corporation
- 17.2.6.1. Overview
- 17.2.6.2. Products
- 17.2.6.3. SWOT Analysis
- 17.2.6.4. Recent Developments
- 17.2.6.5. Financials (Based on Availability)
- 17.2.7 Siemens AG
- 17.2.7.1. Overview
- 17.2.7.2. Products
- 17.2.7.3. SWOT Analysis
- 17.2.7.4. Recent Developments
- 17.2.7.5. Financials (Based on Availability)
- 17.2.8 Nader Electrical
- 17.2.8.1. Overview
- 17.2.8.2. Products
- 17.2.8.3. SWOT Analysis
- 17.2.8.4. Recent Developments
- 17.2.8.5. Financials (Based on Availability)
- 17.2.9 Eaton Corporation PLC
- 17.2.9.1. Overview
- 17.2.9.2. Products
- 17.2.9.3. SWOT Analysis
- 17.2.9.4. Recent Developments
- 17.2.9.5. Financials (Based on Availability)
- 17.2.10 Powell Industries Inc
- 17.2.10.1. Overview
- 17.2.10.2. Products
- 17.2.10.3. SWOT Analysis
- 17.2.10.4. Recent Developments
- 17.2.10.5. Financials (Based on Availability)
- 17.2.11 Entec Electric & Electronic Co Ltd
- 17.2.11.1. Overview
- 17.2.11.2. Products
- 17.2.11.3. SWOT Analysis
- 17.2.11.4. Recent Developments
- 17.2.11.5. Financials (Based on Availability)
- 17.2.12 Fuji Electric Co Ltd
- 17.2.12.1. Overview
- 17.2.12.2. Products
- 17.2.12.3. SWOT Analysis
- 17.2.12.4. Recent Developments
- 17.2.12.5. Financials (Based on Availability)
- 17.2.13 Hyundai Electric & Energy Systems Company
- 17.2.13.1. Overview
- 17.2.13.2. Products
- 17.2.13.3. SWOT Analysis
- 17.2.13.4. Recent Developments
- 17.2.13.5. Financials (Based on Availability)
- 17.2.1 Rockwell Automation
List of Figures
- Figure 1: Global DC Circuit Breaker Industry Revenue Breakdown (Million, %) by Region 2024 & 2032
- Figure 2: North America DC Circuit Breaker Industry Revenue (Million), by Country 2024 & 2032
- Figure 3: North America DC Circuit Breaker Industry Revenue Share (%), by Country 2024 & 2032
- Figure 4: Europe DC Circuit Breaker Industry Revenue (Million), by Country 2024 & 2032
- Figure 5: Europe DC Circuit Breaker Industry Revenue Share (%), by Country 2024 & 2032
- Figure 6: Asia Pacific DC Circuit Breaker Industry Revenue (Million), by Country 2024 & 2032
- Figure 7: Asia Pacific DC Circuit Breaker Industry Revenue Share (%), by Country 2024 & 2032
- Figure 8: South America DC Circuit Breaker Industry Revenue (Million), by Country 2024 & 2032
- Figure 9: South America DC Circuit Breaker Industry Revenue Share (%), by Country 2024 & 2032
- Figure 10: North America DC Circuit Breaker Industry Revenue (Million), by Country 2024 & 2032
- Figure 11: North America DC Circuit Breaker Industry Revenue Share (%), by Country 2024 & 2032
- Figure 12: MEA DC Circuit Breaker Industry Revenue (Million), by Country 2024 & 2032
- Figure 13: MEA DC Circuit Breaker Industry Revenue Share (%), by Country 2024 & 2032
- Figure 14: North America DC Circuit Breaker Industry Revenue (Million), by Type 2024 & 2032
- Figure 15: North America DC Circuit Breaker Industry Revenue Share (%), by Type 2024 & 2032
- Figure 16: North America DC Circuit Breaker Industry Revenue (Million), by Insulation 2024 & 2032
- Figure 17: North America DC Circuit Breaker Industry Revenue Share (%), by Insulation 2024 & 2032
- Figure 18: North America DC Circuit Breaker Industry Revenue (Million), by Voltage 2024 & 2032
- Figure 19: North America DC Circuit Breaker Industry Revenue Share (%), by Voltage 2024 & 2032
- Figure 20: North America DC Circuit Breaker Industry Revenue (Million), by End-User 2024 & 2032
- Figure 21: North America DC Circuit Breaker Industry Revenue Share (%), by End-User 2024 & 2032
- Figure 22: North America DC Circuit Breaker Industry Revenue (Million), by Country 2024 & 2032
- Figure 23: North America DC Circuit Breaker Industry Revenue Share (%), by Country 2024 & 2032
- Figure 24: Europe DC Circuit Breaker Industry Revenue (Million), by Type 2024 & 2032
- Figure 25: Europe DC Circuit Breaker Industry Revenue Share (%), by Type 2024 & 2032
- Figure 26: Europe DC Circuit Breaker Industry Revenue (Million), by Insulation 2024 & 2032
- Figure 27: Europe DC Circuit Breaker Industry Revenue Share (%), by Insulation 2024 & 2032
- Figure 28: Europe DC Circuit Breaker Industry Revenue (Million), by Voltage 2024 & 2032
- Figure 29: Europe DC Circuit Breaker Industry Revenue Share (%), by Voltage 2024 & 2032
- Figure 30: Europe DC Circuit Breaker Industry Revenue (Million), by End-User 2024 & 2032
- Figure 31: Europe DC Circuit Breaker Industry Revenue Share (%), by End-User 2024 & 2032
- Figure 32: Europe DC Circuit Breaker Industry Revenue (Million), by Country 2024 & 2032
- Figure 33: Europe DC Circuit Breaker Industry Revenue Share (%), by Country 2024 & 2032
- Figure 34: Asia Pacific DC Circuit Breaker Industry Revenue (Million), by Type 2024 & 2032
- Figure 35: Asia Pacific DC Circuit Breaker Industry Revenue Share (%), by Type 2024 & 2032
- Figure 36: Asia Pacific DC Circuit Breaker Industry Revenue (Million), by Insulation 2024 & 2032
- Figure 37: Asia Pacific DC Circuit Breaker Industry Revenue Share (%), by Insulation 2024 & 2032
- Figure 38: Asia Pacific DC Circuit Breaker Industry Revenue (Million), by Voltage 2024 & 2032
- Figure 39: Asia Pacific DC Circuit Breaker Industry Revenue Share (%), by Voltage 2024 & 2032
- Figure 40: Asia Pacific DC Circuit Breaker Industry Revenue (Million), by End-User 2024 & 2032
- Figure 41: Asia Pacific DC Circuit Breaker Industry Revenue Share (%), by End-User 2024 & 2032
- Figure 42: Asia Pacific DC Circuit Breaker Industry Revenue (Million), by Country 2024 & 2032
- Figure 43: Asia Pacific DC Circuit Breaker Industry Revenue Share (%), by Country 2024 & 2032
- Figure 44: South America DC Circuit Breaker Industry Revenue (Million), by Type 2024 & 2032
- Figure 45: South America DC Circuit Breaker Industry Revenue Share (%), by Type 2024 & 2032
- Figure 46: South America DC Circuit Breaker Industry Revenue (Million), by Insulation 2024 & 2032
- Figure 47: South America DC Circuit Breaker Industry Revenue Share (%), by Insulation 2024 & 2032
- Figure 48: South America DC Circuit Breaker Industry Revenue (Million), by Voltage 2024 & 2032
- Figure 49: South America DC Circuit Breaker Industry Revenue Share (%), by Voltage 2024 & 2032
- Figure 50: South America DC Circuit Breaker Industry Revenue (Million), by End-User 2024 & 2032
- Figure 51: South America DC Circuit Breaker Industry Revenue Share (%), by End-User 2024 & 2032
- Figure 52: South America DC Circuit Breaker Industry Revenue (Million), by Country 2024 & 2032
- Figure 53: South America DC Circuit Breaker Industry Revenue Share (%), by Country 2024 & 2032
- Figure 54: Middle East and Africa DC Circuit Breaker Industry Revenue (Million), by Type 2024 & 2032
- Figure 55: Middle East and Africa DC Circuit Breaker Industry Revenue Share (%), by Type 2024 & 2032
- Figure 56: Middle East and Africa DC Circuit Breaker Industry Revenue (Million), by Insulation 2024 & 2032
- Figure 57: Middle East and Africa DC Circuit Breaker Industry Revenue Share (%), by Insulation 2024 & 2032
- Figure 58: Middle East and Africa DC Circuit Breaker Industry Revenue (Million), by Voltage 2024 & 2032
- Figure 59: Middle East and Africa DC Circuit Breaker Industry Revenue Share (%), by Voltage 2024 & 2032
- Figure 60: Middle East and Africa DC Circuit Breaker Industry Revenue (Million), by End-User 2024 & 2032
- Figure 61: Middle East and Africa DC Circuit Breaker Industry Revenue Share (%), by End-User 2024 & 2032
- Figure 62: Middle East and Africa DC Circuit Breaker Industry Revenue (Million), by Country 2024 & 2032
- Figure 63: Middle East and Africa DC Circuit Breaker Industry Revenue Share (%), by Country 2024 & 2032
List of Tables
- Table 1: Global DC Circuit Breaker Industry Revenue Million Forecast, by Region 2019 & 2032
- Table 2: Global DC Circuit Breaker Industry Revenue Million Forecast, by Type 2019 & 2032
- Table 3: Global DC Circuit Breaker Industry Revenue Million Forecast, by Insulation 2019 & 2032
- Table 4: Global DC Circuit Breaker Industry Revenue Million Forecast, by Voltage 2019 & 2032
- Table 5: Global DC Circuit Breaker Industry Revenue Million Forecast, by End-User 2019 & 2032
- Table 6: Global DC Circuit Breaker Industry Revenue Million Forecast, by Region 2019 & 2032
- Table 7: Global DC Circuit Breaker Industry Revenue Million Forecast, by Country 2019 & 2032
- Table 8: United States DC Circuit Breaker Industry Revenue (Million) Forecast, by Application 2019 & 2032
- Table 9: Canada DC Circuit Breaker Industry Revenue (Million) Forecast, by Application 2019 & 2032
- Table 10: Mexico DC Circuit Breaker Industry Revenue (Million) Forecast, by Application 2019 & 2032
- Table 11: Global DC Circuit Breaker Industry Revenue Million Forecast, by Country 2019 & 2032
- Table 12: Germany DC Circuit Breaker Industry Revenue (Million) Forecast, by Application 2019 & 2032
- Table 13: United Kingdom DC Circuit Breaker Industry Revenue (Million) Forecast, by Application 2019 & 2032
- Table 14: France DC Circuit Breaker Industry Revenue (Million) Forecast, by Application 2019 & 2032
- Table 15: Spain DC Circuit Breaker Industry Revenue (Million) Forecast, by Application 2019 & 2032
- Table 16: Italy DC Circuit Breaker Industry Revenue (Million) Forecast, by Application 2019 & 2032
- Table 17: Spain DC Circuit Breaker Industry Revenue (Million) Forecast, by Application 2019 & 2032
- Table 18: Belgium DC Circuit Breaker Industry Revenue (Million) Forecast, by Application 2019 & 2032
- Table 19: Netherland DC Circuit Breaker Industry Revenue (Million) Forecast, by Application 2019 & 2032
- Table 20: Nordics DC Circuit Breaker Industry Revenue (Million) Forecast, by Application 2019 & 2032
- Table 21: Rest of Europe DC Circuit Breaker Industry Revenue (Million) Forecast, by Application 2019 & 2032
- Table 22: Global DC Circuit Breaker Industry Revenue Million Forecast, by Country 2019 & 2032
- Table 23: China DC Circuit Breaker Industry Revenue (Million) Forecast, by Application 2019 & 2032
- Table 24: Japan DC Circuit Breaker Industry Revenue (Million) Forecast, by Application 2019 & 2032
- Table 25: India DC Circuit Breaker Industry Revenue (Million) Forecast, by Application 2019 & 2032
- Table 26: South Korea DC Circuit Breaker Industry Revenue (Million) Forecast, by Application 2019 & 2032
- Table 27: Southeast Asia DC Circuit Breaker Industry Revenue (Million) Forecast, by Application 2019 & 2032
- Table 28: Australia DC Circuit Breaker Industry Revenue (Million) Forecast, by Application 2019 & 2032
- Table 29: Indonesia DC Circuit Breaker Industry Revenue (Million) Forecast, by Application 2019 & 2032
- Table 30: Phillipes DC Circuit Breaker Industry Revenue (Million) Forecast, by Application 2019 & 2032
- Table 31: Singapore DC Circuit Breaker Industry Revenue (Million) Forecast, by Application 2019 & 2032
- Table 32: Thailandc DC Circuit Breaker Industry Revenue (Million) Forecast, by Application 2019 & 2032
- Table 33: Rest of Asia Pacific DC Circuit Breaker Industry Revenue (Million) Forecast, by Application 2019 & 2032
- Table 34: Global DC Circuit Breaker Industry Revenue Million Forecast, by Country 2019 & 2032
- Table 35: Brazil DC Circuit Breaker Industry Revenue (Million) Forecast, by Application 2019 & 2032
- Table 36: Argentina DC Circuit Breaker Industry Revenue (Million) Forecast, by Application 2019 & 2032
- Table 37: Peru DC Circuit Breaker Industry Revenue (Million) Forecast, by Application 2019 & 2032
- Table 38: Chile DC Circuit Breaker Industry Revenue (Million) Forecast, by Application 2019 & 2032
- Table 39: Colombia DC Circuit Breaker Industry Revenue (Million) Forecast, by Application 2019 & 2032
- Table 40: Ecuador DC Circuit Breaker Industry Revenue (Million) Forecast, by Application 2019 & 2032
- Table 41: Venezuela DC Circuit Breaker Industry Revenue (Million) Forecast, by Application 2019 & 2032
- Table 42: Rest of South America DC Circuit Breaker Industry Revenue (Million) Forecast, by Application 2019 & 2032
- Table 43: Global DC Circuit Breaker Industry Revenue Million Forecast, by Country 2019 & 2032
- Table 44: United States DC Circuit Breaker Industry Revenue (Million) Forecast, by Application 2019 & 2032
- Table 45: Canada DC Circuit Breaker Industry Revenue (Million) Forecast, by Application 2019 & 2032
- Table 46: Mexico DC Circuit Breaker Industry Revenue (Million) Forecast, by Application 2019 & 2032
- Table 47: Global DC Circuit Breaker Industry Revenue Million Forecast, by Country 2019 & 2032
- Table 48: United Arab Emirates DC Circuit Breaker Industry Revenue (Million) Forecast, by Application 2019 & 2032
- Table 49: Saudi Arabia DC Circuit Breaker Industry Revenue (Million) Forecast, by Application 2019 & 2032
- Table 50: South Africa DC Circuit Breaker Industry Revenue (Million) Forecast, by Application 2019 & 2032
- Table 51: Rest of Middle East and Africa DC Circuit Breaker Industry Revenue (Million) Forecast, by Application 2019 & 2032
- Table 52: Global DC Circuit Breaker Industry Revenue Million Forecast, by Type 2019 & 2032
- Table 53: Global DC Circuit Breaker Industry Revenue Million Forecast, by Insulation 2019 & 2032
- Table 54: Global DC Circuit Breaker Industry Revenue Million Forecast, by Voltage 2019 & 2032
- Table 55: Global DC Circuit Breaker Industry Revenue Million Forecast, by End-User 2019 & 2032
- Table 56: Global DC Circuit Breaker Industry Revenue Million Forecast, by Country 2019 & 2032
- Table 57: United States of America DC Circuit Breaker Industry Revenue (Million) Forecast, by Application 2019 & 2032
- Table 58: Canada DC Circuit Breaker Industry Revenue (Million) Forecast, by Application 2019 & 2032
- Table 59: Rest of the North America DC Circuit Breaker Industry Revenue (Million) Forecast, by Application 2019 & 2032
- Table 60: Global DC Circuit Breaker Industry Revenue Million Forecast, by Type 2019 & 2032
- Table 61: Global DC Circuit Breaker Industry Revenue Million Forecast, by Insulation 2019 & 2032
- Table 62: Global DC Circuit Breaker Industry Revenue Million Forecast, by Voltage 2019 & 2032
- Table 63: Global DC Circuit Breaker Industry Revenue Million Forecast, by End-User 2019 & 2032
- Table 64: Global DC Circuit Breaker Industry Revenue Million Forecast, by Country 2019 & 2032
- Table 65: United Kingdom DC Circuit Breaker Industry Revenue (Million) Forecast, by Application 2019 & 2032
- Table 66: Germany DC Circuit Breaker Industry Revenue (Million) Forecast, by Application 2019 & 2032
- Table 67: France DC Circuit Breaker Industry Revenue (Million) Forecast, by Application 2019 & 2032
- Table 68: Italy DC Circuit Breaker Industry Revenue (Million) Forecast, by Application 2019 & 2032
- Table 69: Rest of the Europe DC Circuit Breaker Industry Revenue (Million) Forecast, by Application 2019 & 2032
- Table 70: Global DC Circuit Breaker Industry Revenue Million Forecast, by Type 2019 & 2032
- Table 71: Global DC Circuit Breaker Industry Revenue Million Forecast, by Insulation 2019 & 2032
- Table 72: Global DC Circuit Breaker Industry Revenue Million Forecast, by Voltage 2019 & 2032
- Table 73: Global DC Circuit Breaker Industry Revenue Million Forecast, by End-User 2019 & 2032
- Table 74: Global DC Circuit Breaker Industry Revenue Million Forecast, by Country 2019 & 2032
- Table 75: China DC Circuit Breaker Industry Revenue (Million) Forecast, by Application 2019 & 2032
- Table 76: India DC Circuit Breaker Industry Revenue (Million) Forecast, by Application 2019 & 2032
- Table 77: South Korea DC Circuit Breaker Industry Revenue (Million) Forecast, by Application 2019 & 2032
- Table 78: Rest of the Asia Pacific DC Circuit Breaker Industry Revenue (Million) Forecast, by Application 2019 & 2032
- Table 79: Global DC Circuit Breaker Industry Revenue Million Forecast, by Type 2019 & 2032
- Table 80: Global DC Circuit Breaker Industry Revenue Million Forecast, by Insulation 2019 & 2032
- Table 81: Global DC Circuit Breaker Industry Revenue Million Forecast, by Voltage 2019 & 2032
- Table 82: Global DC Circuit Breaker Industry Revenue Million Forecast, by End-User 2019 & 2032
- Table 83: Global DC Circuit Breaker Industry Revenue Million Forecast, by Country 2019 & 2032
- Table 84: Brazil DC Circuit Breaker Industry Revenue (Million) Forecast, by Application 2019 & 2032
- Table 85: Argentina DC Circuit Breaker Industry Revenue (Million) Forecast, by Application 2019 & 2032
- Table 86: Rest of the South America DC Circuit Breaker Industry Revenue (Million) Forecast, by Application 2019 & 2032
- Table 87: Global DC Circuit Breaker Industry Revenue Million Forecast, by Type 2019 & 2032
- Table 88: Global DC Circuit Breaker Industry Revenue Million Forecast, by Insulation 2019 & 2032
- Table 89: Global DC Circuit Breaker Industry Revenue Million Forecast, by Voltage 2019 & 2032
- Table 90: Global DC Circuit Breaker Industry Revenue Million Forecast, by End-User 2019 & 2032
- Table 91: Global DC Circuit Breaker Industry Revenue Million Forecast, by Country 2019 & 2032
- Table 92: United Arab Emirates DC Circuit Breaker Industry Revenue (Million) Forecast, by Application 2019 & 2032
- Table 93: Saudi Arabia DC Circuit Breaker Industry Revenue (Million) Forecast, by Application 2019 & 2032
- Table 94: Rest of the Middle East and Africa DC Circuit Breaker Industry Revenue (Million) Forecast, by Application 2019 & 2032
Frequently Asked Questions
1. What is the projected Compound Annual Growth Rate (CAGR) of the DC Circuit Breaker Industry?
The projected CAGR is approximately 8.32%.
2. Which companies are prominent players in the DC Circuit Breaker Industry?
Key companies in the market include Rockwell Automation, ABB Ltd, Larsen & Toubro Limited, Schneider Electric SE*List Not Exhaustive, GEYA Electrical Co, Mitsubishi Electric Corporation, Siemens AG, Nader Electrical, Eaton Corporation PLC, Powell Industries Inc, Entec Electric & Electronic Co Ltd, Fuji Electric Co Ltd, Hyundai Electric & Energy Systems Company.
3. What are the main segments of the DC Circuit Breaker Industry?
The market segments include Type, Insulation, Voltage, End-User.
4. Can you provide details about the market size?
The market size is estimated to be USD 4.93 Million as of 2022.
5. What are some drivers contributing to market growth?
4.; The Rise of an Influx of Renewable Sources 4.; Rising Adoption of HVDC Transmission.
6. What are the notable trends driving market growth?
Solid-State Segment Expected to Dominate the Market.
7. Are there any restraints impacting market growth?
4.; A Rise in the Stability of Electricity Supply. thereby Reducing the Need for Circuit Breakers.
8. Can you provide examples of recent developments in the market?
In February 2023, Mitsubishi entered into a share transfer agreement to acquire Scibreak AB, a Swedish-based company that develops direct current circuit breakers (DCCBs). Both companies aim to build DCCB technologies for high-voltage direct current (HVDC) systems to support the increasing global deployment of renewable energy.
9. What pricing options are available for accessing the report?
Pricing options include single-user, multi-user, and enterprise licenses priced at USD 4750, USD 5250, and USD 8750 respectively.
10. Is the market size provided in terms of value or volume?
The market size is provided in terms of value, measured in Million.
11. Are there any specific market keywords associated with the report?
Yes, the market keyword associated with the report is "DC Circuit Breaker Industry," which aids in identifying and referencing the specific market segment covered.
12. How do I determine which pricing option suits my needs best?
The pricing options vary based on user requirements and access needs. Individual users may opt for single-user licenses, while businesses requiring broader access may choose multi-user or enterprise licenses for cost-effective access to the report.
13. Are there any additional resources or data provided in the DC Circuit Breaker Industry report?
While the report offers comprehensive insights, it's advisable to review the specific contents or supplementary materials provided to ascertain if additional resources or data are available.
14. How can I stay updated on further developments or reports in the DC Circuit Breaker Industry?
To stay informed about further developments, trends, and reports in the DC Circuit Breaker Industry, consider subscribing to industry newsletters, following relevant companies and organizations, or regularly checking reputable industry news sources and publications.
Methodology
Step 1 - Identification of Relevant Samples Size from Population Database


Step 2 - Approaches for Defining Global Market Size (Value, Volume* & Price*)

Note*: In applicable scenarios
Step 3 - Data Sources
Primary Research
- Web Analytics
- Survey Reports
- Research Institute
- Latest Research Reports
- Opinion Leaders
Secondary Research
- Annual Reports
- White Paper
- Latest Press Release
- Industry Association
- Paid Database
- Investor Presentations

Step 4 - Data Triangulation
Involves using different sources of information in order to increase the validity of a study
These sources are likely to be stakeholders in a program - participants, other researchers, program staff, other community members, and so on.
Then we put all data in single framework & apply various statistical tools to find out the dynamic on the market.
During the analysis stage, feedback from the stakeholder groups would be compared to determine areas of agreement as well as areas of divergence


