

Key Insights
The global Dental CAD/CAM market is projected for significant expansion, propelled by the increasing integration of digital dentistry and the escalating demand for precise, aesthetically superior dental restorations. Key growth drivers include technological innovations in CAD/CAM hardware and software, such as enhanced scanner accuracy and accelerated milling capabilities, which empower dental professionals to deliver highly accurate, customized prosthetics and implants with greater efficiency. The preference for minimally invasive treatments and same-day dental procedures further boosts market adoption, leveraging CAD/CAM technology for expedited turnaround times and improved patient comfort. An increasing incidence of dental conditions and a growing elderly demographic necessitate more restorative treatments, thereby broadening the market's reach.
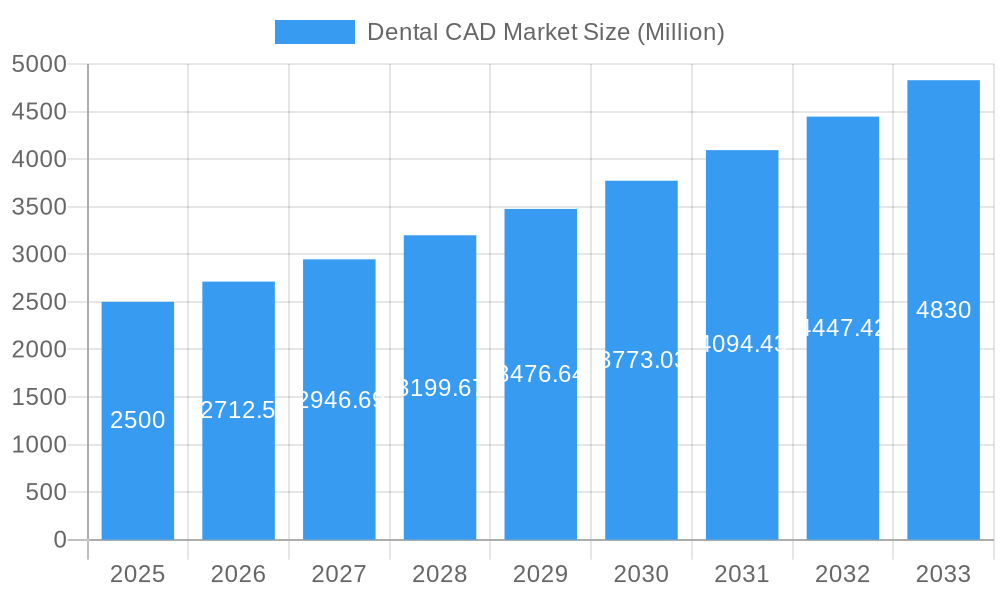
Dental CAD Market Market Size (In Billion)
The market is segmented by component, including scanners, milling machines, software, and accessories. While scanners and milling machines currently dominate, software solutions are experiencing rapid growth due to their critical function in design and manufacturing precision. The competitive environment features established entities and innovative new entrants, fostering technological advancement and price competition. North America and Europe lead in market share, attributed to high adoption rates and developed healthcare systems. Conversely, the Asia-Pacific region is expected to exhibit the fastest growth, driven by rising disposable incomes and heightened awareness of advanced dental care.
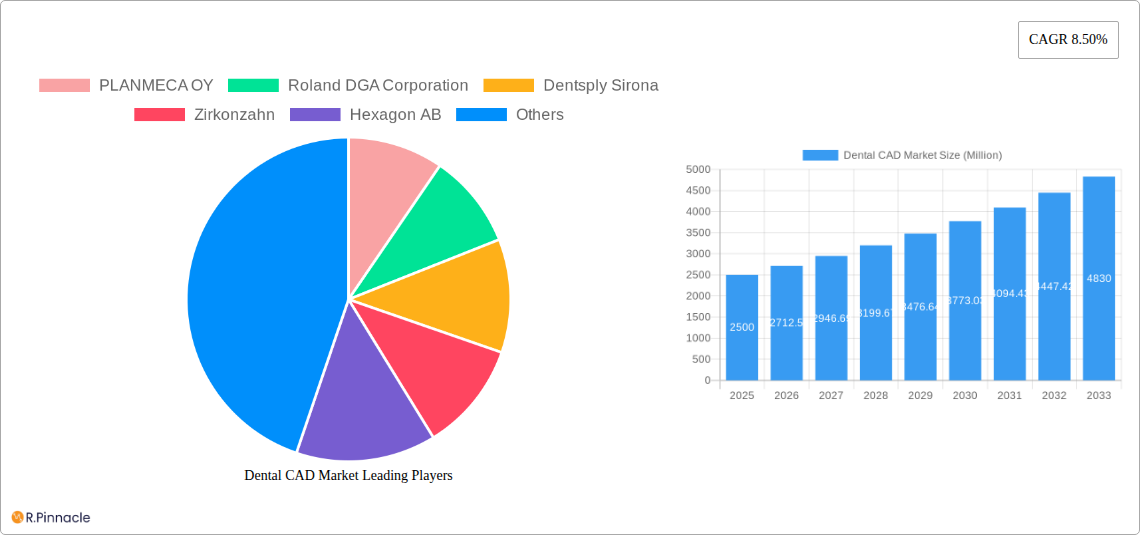
Dental CAD Market Company Market Share
Despite a positive growth outlook, certain challenges persist, including the substantial initial investment required for CAD/CAM systems, which can be a deterrent for smaller practices. The necessity for specialized training and expertise for operation and maintenance may also impede widespread adoption. However, these barriers are being mitigated by the availability of more accessible and user-friendly systems, alongside expanded training and support services. Considering these factors and projecting a Compound Annual Growth Rate (CAGR) of 8.5% from the base year of 2025, the market is set for considerable growth through the forecast period (2025-2033). This expansion will be further supported by continuous technological evolution, rising adoption of digital dentistry, and the ongoing enhancement of global healthcare infrastructure. The projected market size is $2.94 billion in 2025.
Dental CAD Market Report: A Comprehensive Analysis (2019-2033)
This comprehensive report provides an in-depth analysis of the global Dental CAD market, offering actionable insights for industry professionals, investors, and stakeholders. With a study period spanning 2019-2033, a base year of 2025, and a forecast period of 2025-2033, this report meticulously examines market dynamics, technological advancements, and competitive landscapes. The market is projected to reach xx Million by 2033, exhibiting a CAGR of xx% during the forecast period.
Dental CAD Market Structure & Innovation Trends
The Dental CAD market is characterized by a moderately concentrated structure with several key players holding significant market share.
- Market Leaders: Companies like Dentsply Sirona, 3Shape, and Planmeca OY command substantial market share, driving innovation and setting industry standards. Their combined market share is estimated at xx%.
- Emerging Players: Companies like Kelkar Dynamics LLP and ZimVie Inc are making inroads, particularly in niche segments, impacting market dynamics with innovative solutions.
- Mergers & Acquisitions (M&A): The Dental CAD market has witnessed significant M&A activity in recent years, with deal values exceeding xx Million in the past five years. These strategic moves have reshaped the competitive landscape, leading to increased consolidation and expansion.
- Innovation Drivers: Technological advancements in CAD/CAM software, intraoral scanners, and milling machines are driving market growth. The increasing demand for precise and efficient dental restorations fuels the adoption of digital dentistry technologies.
- Regulatory Frameworks: Stringent regulatory approvals and compliance requirements influence market dynamics, particularly concerning the safety and efficacy of dental CAD/CAM systems.
- Product Substitutes: Traditional methods of dental restoration still exist but are gradually being replaced by digital alternatives due to superior accuracy and efficiency offered by CAD/CAM technology.
- End-User Demographics: The growing geriatric population, coupled with rising awareness of dental health and aesthetic dentistry, is a major driver for market growth.
Dental CAD Market Dynamics & Trends
The Dental CAD market is experiencing robust growth driven by several factors:
- Technological Disruptions: Advancements in artificial intelligence (AI) and machine learning (ML) are enhancing the accuracy and efficiency of CAD/CAM systems, leading to improved workflow and patient outcomes. Miniaturization and improved ergonomics of equipment are also influencing growth.
- Rising Adoption of Digital Dentistry: The increasing adoption of digital workflows in dental practices is a key driver. Dentists are increasingly recognizing the advantages of CAD/CAM technology in terms of speed, accuracy, and patient comfort.
- Growing Demand for Aesthetic Dentistry: The rising demand for aesthetically pleasing restorations is fuelling the market, with CAD/CAM technology offering the precision needed to create natural-looking restorations.
- Improved Patient Experience: Digital dentistry offers patients a more comfortable and efficient experience, reducing treatment times and improving overall satisfaction. This positive experience promotes market growth.
- Competitive Dynamics: The market is characterized by intense competition amongst key players, leading to continuous innovation and product development. Pricing strategies, marketing campaigns and customer service are critical elements for market share.
- Market Penetration: The market penetration of CAD/CAM technology varies across regions and demographics, with developed countries exhibiting higher adoption rates. However, growth is expected in emerging markets.
Dominant Regions & Segments in Dental CAD Market
Leading Region: North America currently dominates the Dental CAD market due to high adoption rates, advanced infrastructure, and a large number of dental practices equipped with CAD/CAM technology. Europe follows closely, with a robust healthcare sector and high demand for advanced dental solutions.
Dominant Segments:
- By Component: The Software segment holds a significant market share due to the increasing complexity and sophistication of CAD/CAM software. The Scanners segment is also growing rapidly due to technological advancements in intraoral scanners.
- By Application: The Dental Prosthesis segment currently holds the largest market share owing to the widespread use of CAD/CAM technology in producing crowns, bridges, and dentures. The Dental Implants segment is also growing rapidly as CAD/CAM technology becomes increasingly integrated into implant planning and fabrication.
Key Drivers:
- North America: Strong regulatory support for digital dentistry, high disposable incomes, and established dental infrastructure.
- Europe: Significant investments in healthcare technology, a large pool of skilled dental professionals, and growing awareness of advanced dental treatments.
- Asia-Pacific: Rapid economic growth, increasing healthcare expenditure, and rising demand for high-quality dental care.
Dental CAD Market Product Innovations
Recent product developments have focused on integrating AI and ML algorithms to improve the accuracy and efficiency of CAD/CAM workflows. New intraoral scanners offer enhanced image quality and faster scanning speeds. Software platforms are becoming more user-friendly and intuitive, improving workflow and reducing training time. These innovations provide better patient outcomes and reduced treatment time, leading to increased market adoption.
Report Scope & Segmentation Analysis
This report segments the Dental CAD market by component (Scanners, Milling Machines, Software, Other Components) and by application (Dental Prosthesis, Dental Implants). Each segment is analyzed in detail, providing market size estimations, growth projections, and competitive dynamics. The market size for each segment is projected to grow significantly during the forecast period, driven by technological advancements and increasing adoption of digital dentistry. The competitive landscape within each segment is analysed, highlighting key players and their market strategies.
Key Drivers of Dental CAD Market Growth
Technological advancements in CAD/CAM technology, rising demand for aesthetic dentistry, increasing adoption of digital workflows in dental practices, and a growing geriatric population are major growth drivers. Government initiatives promoting digital healthcare and rising investments in dental infrastructure further fuel market expansion.
Challenges in the Dental CAD Market Sector
High initial investment costs for CAD/CAM systems can pose a barrier to adoption, particularly for smaller dental practices. The complexity of the technology may also require extensive training for dental professionals. Competition among key players can lead to price pressures. Furthermore, ensuring data security and regulatory compliance are critical aspects that pose challenges for the market.
Emerging Opportunities in Dental CAD Market
The integration of AI and ML into CAD/CAM systems presents significant opportunities for improved accuracy, efficiency, and automation. The growing demand for personalized dental solutions and the expansion of the market into emerging economies offer substantial growth potential. The development of biocompatible and bio-integrated materials for dental restorations will further drive market expansion.
Leading Players in the Dental CAD Market Market
Key Developments in Dental CAD Market Industry
- September 2022: Planmeca launched a new software module for Planmeca Romexis, streamlining digital impression workflows.
- April 2022: Dentsply Sirona released inLab Software 22.0, featuring a harmonized user interface and expanded design options.
Future Outlook for Dental CAD Market Market
The Dental CAD market is poised for significant growth driven by ongoing technological advancements, increasing adoption rates, and expanding applications. The integration of AI and ML, the development of new materials, and the expansion into emerging markets will further fuel market expansion. Strategic partnerships and collaborations will play a critical role in shaping the future of the Dental CAD market.
Dental CAD Market Segmentation
-
1. Component
- 1.1. Scanners
- 1.2. Milling Machines
- 1.3. Software
- 1.4. Other Components
-
2. Application
- 2.1. Dental Prosthesis
- 2.2. Dental Implants
Dental CAD Market Segmentation By Geography
-
1. North America
- 1.1. United States
- 1.2. Canada
- 1.3. Mexico
-
2. Europe
- 2.1. Germany
- 2.2. United Kingdom
- 2.3. France
- 2.4. Italy
- 2.5. Spain
- 2.6. Rest of Europe
-
3. Asia Pacific
- 3.1. China
- 3.2. Japan
- 3.3. India
- 3.4. Australia
- 3.5. South Korea
- 3.6. Rest of Asia Pacific
-
4. Middle East and Africa
- 4.1. GCC
- 4.2. South Africa
- 4.3. Rest of Middle East and Africa
-
5. South America
- 5.1. Brazil
- 5.2. Argentina
- 5.3. Rest of South America
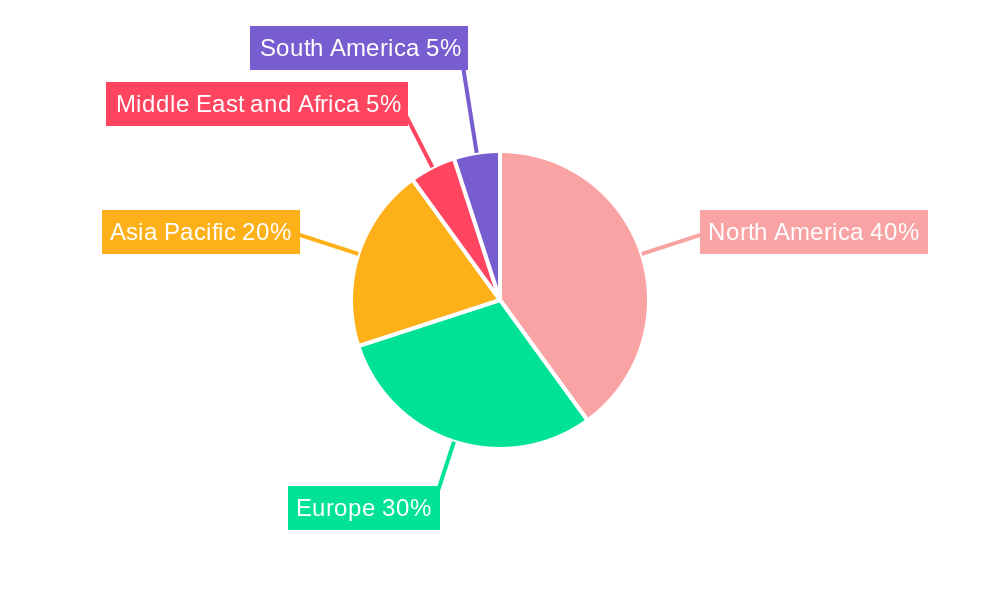
Dental CAD Market Regional Market Share
Geographic Coverage of Dental CAD Market
Dental CAD Market REPORT HIGHLIGHTS
| Aspects | Details |
|---|---|
| Study Period | 2020-2034 |
| Base Year | 2025 |
| Estimated Year | 2026 |
| Forecast Period | 2026-2034 |
| Historical Period | 2020-2025 |
| Growth Rate | CAGR of 8.5% from 2020-2034 |
| Segmentation |
|
Table of Contents
- 1. Introduction
- 1.1. Research Scope
- 1.2. Market Segmentation
- 1.3. Research Objective
- 1.4. Definitions and Assumptions
- 2. Executive Summary
- 2.1. Market Snapshot
- 3. Market Dynamics
- 3.1. Market Drivers
- 3.2. Market Restrains
- 3.3. Market Trends
- 3.4. Market Opportunities
- 4. Market Factor Analysis
- 4.1. Porters Five Forces
- 4.1.1. Bargaining Power of Suppliers
- 4.1.2. Bargaining Power of Buyers
- 4.1.3. Threat of New Entrants
- 4.1.4. Threat of Substitutes
- 4.1.5. Competitive Rivalry
- 4.2. PESTEL analysis
- 4.3. BCG Analysis
- 4.3.1. Stars (High Growth, High Market Share)
- 4.3.2. Cash Cows (Low Growth, High Market Share)
- 4.3.3. Question Mark (High Growth, Low Market Share)
- 4.3.4. Dogs (Low Growth, Low Market Share)
- 4.4. Ansoff Matrix Analysis
- 4.5. Supply Chain Analysis
- 4.6. Regulatory Landscape
- 4.7. Current Market Potential and Opportunity Assessment (TAM–SAM–SOM Framework)
- 4.8. PRI Analyst Note
- 4.1. Porters Five Forces
- 5. Market Analysis, Insights and Forecast 2021-2033
- 5.1. Market Analysis, Insights and Forecast - by Component
- 5.1.1. Scanners
- 5.1.2. Milling Machines
- 5.1.3. Software
- 5.1.4. Other Components
- 5.2. Market Analysis, Insights and Forecast - by Application
- 5.2.1. Dental Prosthesis
- 5.2.2. Dental Implants
- 5.3. Market Analysis, Insights and Forecast - by Region
- 5.3.1. North America
- 5.3.2. Europe
- 5.3.3. Asia Pacific
- 5.3.4. Middle East and Africa
- 5.3.5. South America
- 5.1. Market Analysis, Insights and Forecast - by Component
- 6. Global Dental CAD Market Analysis, Insights and Forecast, 2021-2033
- 6.1. Market Analysis, Insights and Forecast - by Component
- 6.1.1. Scanners
- 6.1.2. Milling Machines
- 6.1.3. Software
- 6.1.4. Other Components
- 6.2. Market Analysis, Insights and Forecast - by Application
- 6.2.1. Dental Prosthesis
- 6.2.2. Dental Implants
- 6.1. Market Analysis, Insights and Forecast - by Component
- 7. North America Dental CAD Market Analysis, Insights and Forecast, 2020-2032
- 7.1. Market Analysis, Insights and Forecast - by Component
- 7.1.1. Scanners
- 7.1.2. Milling Machines
- 7.1.3. Software
- 7.1.4. Other Components
- 7.2. Market Analysis, Insights and Forecast - by Application
- 7.2.1. Dental Prosthesis
- 7.2.2. Dental Implants
- 7.1. Market Analysis, Insights and Forecast - by Component
- 8. Europe Dental CAD Market Analysis, Insights and Forecast, 2020-2032
- 8.1. Market Analysis, Insights and Forecast - by Component
- 8.1.1. Scanners
- 8.1.2. Milling Machines
- 8.1.3. Software
- 8.1.4. Other Components
- 8.2. Market Analysis, Insights and Forecast - by Application
- 8.2.1. Dental Prosthesis
- 8.2.2. Dental Implants
- 8.1. Market Analysis, Insights and Forecast - by Component
- 9. Asia Pacific Dental CAD Market Analysis, Insights and Forecast, 2020-2032
- 9.1. Market Analysis, Insights and Forecast - by Component
- 9.1.1. Scanners
- 9.1.2. Milling Machines
- 9.1.3. Software
- 9.1.4. Other Components
- 9.2. Market Analysis, Insights and Forecast - by Application
- 9.2.1. Dental Prosthesis
- 9.2.2. Dental Implants
- 9.1. Market Analysis, Insights and Forecast - by Component
- 10. Middle East and Africa Dental CAD Market Analysis, Insights and Forecast, 2020-2032
- 10.1. Market Analysis, Insights and Forecast - by Component
- 10.1.1. Scanners
- 10.1.2. Milling Machines
- 10.1.3. Software
- 10.1.4. Other Components
- 10.2. Market Analysis, Insights and Forecast - by Application
- 10.2.1. Dental Prosthesis
- 10.2.2. Dental Implants
- 10.1. Market Analysis, Insights and Forecast - by Component
- 11. South America Dental CAD Market Analysis, Insights and Forecast, 2020-2032
- 11.1. Market Analysis, Insights and Forecast - by Component
- 11.1.1. Scanners
- 11.1.2. Milling Machines
- 11.1.3. Software
- 11.1.4. Other Components
- 11.2. Market Analysis, Insights and Forecast - by Application
- 11.2.1. Dental Prosthesis
- 11.2.2. Dental Implants
- 11.1. Market Analysis, Insights and Forecast - by Component
- 12. Competitive Analysis
- 12.1. Company Profiles
- 12.1.1 PLANMECA OY
- 12.1.1.1. Company Overview
- 12.1.1.2. Products
- 12.1.1.3. Company Financials
- 12.1.1.4. SWOT Analysis
- 12.1.2 Roland DGA Corporation
- 12.1.2.1. Company Overview
- 12.1.2.2. Products
- 12.1.2.3. Company Financials
- 12.1.2.4. SWOT Analysis
- 12.1.3 Dentsply Sirona
- 12.1.3.1. Company Overview
- 12.1.3.2. Products
- 12.1.3.3. Company Financials
- 12.1.3.4. SWOT Analysis
- 12.1.4 Zirkonzahn
- 12.1.4.1. Company Overview
- 12.1.4.2. Products
- 12.1.4.3. Company Financials
- 12.1.4.4. SWOT Analysis
- 12.1.5 Hexagon AB
- 12.1.5.1. Company Overview
- 12.1.5.2. Products
- 12.1.5.3. Company Financials
- 12.1.5.4. SWOT Analysis
- 12.1.6 Kelkar Dynamics LLP
- 12.1.6.1. Company Overview
- 12.1.6.2. Products
- 12.1.6.3. Company Financials
- 12.1.6.4. SWOT Analysis
- 12.1.7 Amann Girrbach AG
- 12.1.7.1. Company Overview
- 12.1.7.2. Products
- 12.1.7.3. Company Financials
- 12.1.7.4. SWOT Analysis
- 12.1.8 Carestream Dental LLC
- 12.1.8.1. Company Overview
- 12.1.8.2. Products
- 12.1.8.3. Company Financials
- 12.1.8.4. SWOT Analysis
- 12.1.9 3Shape
- 12.1.9.1. Company Overview
- 12.1.9.2. Products
- 12.1.9.3. Company Financials
- 12.1.9.4. SWOT Analysis
- 12.1.10 Align Technology Inc
- 12.1.10.1. Company Overview
- 12.1.10.2. Products
- 12.1.10.3. Company Financials
- 12.1.10.4. SWOT Analysis
- 12.1.11 Envista Holdings Corporation
- 12.1.11.1. Company Overview
- 12.1.11.2. Products
- 12.1.11.3. Company Financials
- 12.1.11.4. SWOT Analysis
- 12.1.12 Datron AG
- 12.1.12.1. Company Overview
- 12.1.12.2. Products
- 12.1.12.3. Company Financials
- 12.1.12.4. SWOT Analysis
- 12.1.13 Institut Straumann AG
- 12.1.13.1. Company Overview
- 12.1.13.2. Products
- 12.1.13.3. Company Financials
- 12.1.13.4. SWOT Analysis
- 12.1.14 ZimVie Inc
- 12.1.14.1. Company Overview
- 12.1.14.2. Products
- 12.1.14.3. Company Financials
- 12.1.14.4. SWOT Analysis
- 12.1.1 PLANMECA OY
- 12.2. Market Entropy
- 12.2.1 Company's Key Areas Served
- 12.2.2 Recent Developments
- 12.3. Company Market Share Analysis 2025
- 12.3.1 Top 5 Companies Market Share Analysis
- 12.3.2 Top 3 Companies Market Share Analysis
- 12.4. List of Potential Customers
- 13. Research Methodology
List of Figures
- Figure 1: Global Dental CAD Market Revenue Breakdown (billion, %) by Region 2025 & 2033
- Figure 2: Global Dental CAD Market Volume Breakdown (K Unit, %) by Region 2025 & 2033
- Figure 3: North America Dental CAD Market Revenue (billion), by Component 2025 & 2033
- Figure 4: North America Dental CAD Market Volume (K Unit), by Component 2025 & 2033
- Figure 5: North America Dental CAD Market Revenue Share (%), by Component 2025 & 2033
- Figure 6: North America Dental CAD Market Volume Share (%), by Component 2025 & 2033
- Figure 7: North America Dental CAD Market Revenue (billion), by Application 2025 & 2033
- Figure 8: North America Dental CAD Market Volume (K Unit), by Application 2025 & 2033
- Figure 9: North America Dental CAD Market Revenue Share (%), by Application 2025 & 2033
- Figure 10: North America Dental CAD Market Volume Share (%), by Application 2025 & 2033
- Figure 11: North America Dental CAD Market Revenue (billion), by Country 2025 & 2033
- Figure 12: North America Dental CAD Market Volume (K Unit), by Country 2025 & 2033
- Figure 13: North America Dental CAD Market Revenue Share (%), by Country 2025 & 2033
- Figure 14: North America Dental CAD Market Volume Share (%), by Country 2025 & 2033
- Figure 15: Europe Dental CAD Market Revenue (billion), by Component 2025 & 2033
- Figure 16: Europe Dental CAD Market Volume (K Unit), by Component 2025 & 2033
- Figure 17: Europe Dental CAD Market Revenue Share (%), by Component 2025 & 2033
- Figure 18: Europe Dental CAD Market Volume Share (%), by Component 2025 & 2033
- Figure 19: Europe Dental CAD Market Revenue (billion), by Application 2025 & 2033
- Figure 20: Europe Dental CAD Market Volume (K Unit), by Application 2025 & 2033
- Figure 21: Europe Dental CAD Market Revenue Share (%), by Application 2025 & 2033
- Figure 22: Europe Dental CAD Market Volume Share (%), by Application 2025 & 2033
- Figure 23: Europe Dental CAD Market Revenue (billion), by Country 2025 & 2033
- Figure 24: Europe Dental CAD Market Volume (K Unit), by Country 2025 & 2033
- Figure 25: Europe Dental CAD Market Revenue Share (%), by Country 2025 & 2033
- Figure 26: Europe Dental CAD Market Volume Share (%), by Country 2025 & 2033
- Figure 27: Asia Pacific Dental CAD Market Revenue (billion), by Component 2025 & 2033
- Figure 28: Asia Pacific Dental CAD Market Volume (K Unit), by Component 2025 & 2033
- Figure 29: Asia Pacific Dental CAD Market Revenue Share (%), by Component 2025 & 2033
- Figure 30: Asia Pacific Dental CAD Market Volume Share (%), by Component 2025 & 2033
- Figure 31: Asia Pacific Dental CAD Market Revenue (billion), by Application 2025 & 2033
- Figure 32: Asia Pacific Dental CAD Market Volume (K Unit), by Application 2025 & 2033
- Figure 33: Asia Pacific Dental CAD Market Revenue Share (%), by Application 2025 & 2033
- Figure 34: Asia Pacific Dental CAD Market Volume Share (%), by Application 2025 & 2033
- Figure 35: Asia Pacific Dental CAD Market Revenue (billion), by Country 2025 & 2033
- Figure 36: Asia Pacific Dental CAD Market Volume (K Unit), by Country 2025 & 2033
- Figure 37: Asia Pacific Dental CAD Market Revenue Share (%), by Country 2025 & 2033
- Figure 38: Asia Pacific Dental CAD Market Volume Share (%), by Country 2025 & 2033
- Figure 39: Middle East and Africa Dental CAD Market Revenue (billion), by Component 2025 & 2033
- Figure 40: Middle East and Africa Dental CAD Market Volume (K Unit), by Component 2025 & 2033
- Figure 41: Middle East and Africa Dental CAD Market Revenue Share (%), by Component 2025 & 2033
- Figure 42: Middle East and Africa Dental CAD Market Volume Share (%), by Component 2025 & 2033
- Figure 43: Middle East and Africa Dental CAD Market Revenue (billion), by Application 2025 & 2033
- Figure 44: Middle East and Africa Dental CAD Market Volume (K Unit), by Application 2025 & 2033
- Figure 45: Middle East and Africa Dental CAD Market Revenue Share (%), by Application 2025 & 2033
- Figure 46: Middle East and Africa Dental CAD Market Volume Share (%), by Application 2025 & 2033
- Figure 47: Middle East and Africa Dental CAD Market Revenue (billion), by Country 2025 & 2033
- Figure 48: Middle East and Africa Dental CAD Market Volume (K Unit), by Country 2025 & 2033
- Figure 49: Middle East and Africa Dental CAD Market Revenue Share (%), by Country 2025 & 2033
- Figure 50: Middle East and Africa Dental CAD Market Volume Share (%), by Country 2025 & 2033
- Figure 51: South America Dental CAD Market Revenue (billion), by Component 2025 & 2033
- Figure 52: South America Dental CAD Market Volume (K Unit), by Component 2025 & 2033
- Figure 53: South America Dental CAD Market Revenue Share (%), by Component 2025 & 2033
- Figure 54: South America Dental CAD Market Volume Share (%), by Component 2025 & 2033
- Figure 55: South America Dental CAD Market Revenue (billion), by Application 2025 & 2033
- Figure 56: South America Dental CAD Market Volume (K Unit), by Application 2025 & 2033
- Figure 57: South America Dental CAD Market Revenue Share (%), by Application 2025 & 2033
- Figure 58: South America Dental CAD Market Volume Share (%), by Application 2025 & 2033
- Figure 59: South America Dental CAD Market Revenue (billion), by Country 2025 & 2033
- Figure 60: South America Dental CAD Market Volume (K Unit), by Country 2025 & 2033
- Figure 61: South America Dental CAD Market Revenue Share (%), by Country 2025 & 2033
- Figure 62: South America Dental CAD Market Volume Share (%), by Country 2025 & 2033
List of Tables
- Table 1: Global Dental CAD Market Revenue billion Forecast, by Component 2020 & 2033
- Table 2: Global Dental CAD Market Volume K Unit Forecast, by Component 2020 & 2033
- Table 3: Global Dental CAD Market Revenue billion Forecast, by Application 2020 & 2033
- Table 4: Global Dental CAD Market Volume K Unit Forecast, by Application 2020 & 2033
- Table 5: Global Dental CAD Market Revenue billion Forecast, by Region 2020 & 2033
- Table 6: Global Dental CAD Market Volume K Unit Forecast, by Region 2020 & 2033
- Table 7: Global Dental CAD Market Revenue billion Forecast, by Component 2020 & 2033
- Table 8: Global Dental CAD Market Volume K Unit Forecast, by Component 2020 & 2033
- Table 9: Global Dental CAD Market Revenue billion Forecast, by Application 2020 & 2033
- Table 10: Global Dental CAD Market Volume K Unit Forecast, by Application 2020 & 2033
- Table 11: Global Dental CAD Market Revenue billion Forecast, by Country 2020 & 2033
- Table 12: Global Dental CAD Market Volume K Unit Forecast, by Country 2020 & 2033
- Table 13: United States Dental CAD Market Revenue (billion) Forecast, by Application 2020 & 2033
- Table 14: United States Dental CAD Market Volume (K Unit) Forecast, by Application 2020 & 2033
- Table 15: Canada Dental CAD Market Revenue (billion) Forecast, by Application 2020 & 2033
- Table 16: Canada Dental CAD Market Volume (K Unit) Forecast, by Application 2020 & 2033
- Table 17: Mexico Dental CAD Market Revenue (billion) Forecast, by Application 2020 & 2033
- Table 18: Mexico Dental CAD Market Volume (K Unit) Forecast, by Application 2020 & 2033
- Table 19: Global Dental CAD Market Revenue billion Forecast, by Component 2020 & 2033
- Table 20: Global Dental CAD Market Volume K Unit Forecast, by Component 2020 & 2033
- Table 21: Global Dental CAD Market Revenue billion Forecast, by Application 2020 & 2033
- Table 22: Global Dental CAD Market Volume K Unit Forecast, by Application 2020 & 2033
- Table 23: Global Dental CAD Market Revenue billion Forecast, by Country 2020 & 2033
- Table 24: Global Dental CAD Market Volume K Unit Forecast, by Country 2020 & 2033
- Table 25: Germany Dental CAD Market Revenue (billion) Forecast, by Application 2020 & 2033
- Table 26: Germany Dental CAD Market Volume (K Unit) Forecast, by Application 2020 & 2033
- Table 27: United Kingdom Dental CAD Market Revenue (billion) Forecast, by Application 2020 & 2033
- Table 28: United Kingdom Dental CAD Market Volume (K Unit) Forecast, by Application 2020 & 2033
- Table 29: France Dental CAD Market Revenue (billion) Forecast, by Application 2020 & 2033
- Table 30: France Dental CAD Market Volume (K Unit) Forecast, by Application 2020 & 2033
- Table 31: Italy Dental CAD Market Revenue (billion) Forecast, by Application 2020 & 2033
- Table 32: Italy Dental CAD Market Volume (K Unit) Forecast, by Application 2020 & 2033
- Table 33: Spain Dental CAD Market Revenue (billion) Forecast, by Application 2020 & 2033
- Table 34: Spain Dental CAD Market Volume (K Unit) Forecast, by Application 2020 & 2033
- Table 35: Rest of Europe Dental CAD Market Revenue (billion) Forecast, by Application 2020 & 2033
- Table 36: Rest of Europe Dental CAD Market Volume (K Unit) Forecast, by Application 2020 & 2033
- Table 37: Global Dental CAD Market Revenue billion Forecast, by Component 2020 & 2033
- Table 38: Global Dental CAD Market Volume K Unit Forecast, by Component 2020 & 2033
- Table 39: Global Dental CAD Market Revenue billion Forecast, by Application 2020 & 2033
- Table 40: Global Dental CAD Market Volume K Unit Forecast, by Application 2020 & 2033
- Table 41: Global Dental CAD Market Revenue billion Forecast, by Country 2020 & 2033
- Table 42: Global Dental CAD Market Volume K Unit Forecast, by Country 2020 & 2033
- Table 43: China Dental CAD Market Revenue (billion) Forecast, by Application 2020 & 2033
- Table 44: China Dental CAD Market Volume (K Unit) Forecast, by Application 2020 & 2033
- Table 45: Japan Dental CAD Market Revenue (billion) Forecast, by Application 2020 & 2033
- Table 46: Japan Dental CAD Market Volume (K Unit) Forecast, by Application 2020 & 2033
- Table 47: India Dental CAD Market Revenue (billion) Forecast, by Application 2020 & 2033
- Table 48: India Dental CAD Market Volume (K Unit) Forecast, by Application 2020 & 2033
- Table 49: Australia Dental CAD Market Revenue (billion) Forecast, by Application 2020 & 2033
- Table 50: Australia Dental CAD Market Volume (K Unit) Forecast, by Application 2020 & 2033
- Table 51: South Korea Dental CAD Market Revenue (billion) Forecast, by Application 2020 & 2033
- Table 52: South Korea Dental CAD Market Volume (K Unit) Forecast, by Application 2020 & 2033
- Table 53: Rest of Asia Pacific Dental CAD Market Revenue (billion) Forecast, by Application 2020 & 2033
- Table 54: Rest of Asia Pacific Dental CAD Market Volume (K Unit) Forecast, by Application 2020 & 2033
- Table 55: Global Dental CAD Market Revenue billion Forecast, by Component 2020 & 2033
- Table 56: Global Dental CAD Market Volume K Unit Forecast, by Component 2020 & 2033
- Table 57: Global Dental CAD Market Revenue billion Forecast, by Application 2020 & 2033
- Table 58: Global Dental CAD Market Volume K Unit Forecast, by Application 2020 & 2033
- Table 59: Global Dental CAD Market Revenue billion Forecast, by Country 2020 & 2033
- Table 60: Global Dental CAD Market Volume K Unit Forecast, by Country 2020 & 2033
- Table 61: GCC Dental CAD Market Revenue (billion) Forecast, by Application 2020 & 2033
- Table 62: GCC Dental CAD Market Volume (K Unit) Forecast, by Application 2020 & 2033
- Table 63: South Africa Dental CAD Market Revenue (billion) Forecast, by Application 2020 & 2033
- Table 64: South Africa Dental CAD Market Volume (K Unit) Forecast, by Application 2020 & 2033
- Table 65: Rest of Middle East and Africa Dental CAD Market Revenue (billion) Forecast, by Application 2020 & 2033
- Table 66: Rest of Middle East and Africa Dental CAD Market Volume (K Unit) Forecast, by Application 2020 & 2033
- Table 67: Global Dental CAD Market Revenue billion Forecast, by Component 2020 & 2033
- Table 68: Global Dental CAD Market Volume K Unit Forecast, by Component 2020 & 2033
- Table 69: Global Dental CAD Market Revenue billion Forecast, by Application 2020 & 2033
- Table 70: Global Dental CAD Market Volume K Unit Forecast, by Application 2020 & 2033
- Table 71: Global Dental CAD Market Revenue billion Forecast, by Country 2020 & 2033
- Table 72: Global Dental CAD Market Volume K Unit Forecast, by Country 2020 & 2033
- Table 73: Brazil Dental CAD Market Revenue (billion) Forecast, by Application 2020 & 2033
- Table 74: Brazil Dental CAD Market Volume (K Unit) Forecast, by Application 2020 & 2033
- Table 75: Argentina Dental CAD Market Revenue (billion) Forecast, by Application 2020 & 2033
- Table 76: Argentina Dental CAD Market Volume (K Unit) Forecast, by Application 2020 & 2033
- Table 77: Rest of South America Dental CAD Market Revenue (billion) Forecast, by Application 2020 & 2033
- Table 78: Rest of South America Dental CAD Market Volume (K Unit) Forecast, by Application 2020 & 2033
Frequently Asked Questions
1. What is the projected Compound Annual Growth Rate (CAGR) of the Dental CAD Market?
The projected CAGR is approximately 8.5%.
2. Which companies are prominent players in the Dental CAD Market?
Key companies in the market include PLANMECA OY, Roland DGA Corporation, Dentsply Sirona, Zirkonzahn, Hexagon AB, Kelkar Dynamics LLP, Amann Girrbach AG, Carestream Dental LLC, 3Shape, Align Technology Inc, Envista Holdings Corporation, Datron AG, Institut Straumann AG, ZimVie Inc.
3. What are the main segments of the Dental CAD Market?
The market segments include Component, Application.
4. Can you provide details about the market size?
The market size is estimated to be USD 2.94 billion as of 2022.
5. What are some drivers contributing to market growth?
Increasing Burden of Oral Diseases And Ageing Population; Technological Advancements in Dental Imaging Methodologies.
6. What are the notable trends driving market growth?
The Scanners Segment is Expected to Hold Significant Share in Dental CAD Market Over the Forecast Period.
7. Are there any restraints impacting market growth?
Excessive Costs Involved in Private Health Insurance.
8. Can you provide examples of recent developments in the market?
In September 2022, Planmeca introduced a completely new software module for Planmeca Romexis, which makes working with digital impressions easier and faster. The Planmeca Romexis CAD/CAM module streamlines the scan-and-send workflow for capturing, analyzing, and exporting digital impressions and offers new intraoral scanner users a smooth CAD/CAM dentistry experience.
9. What pricing options are available for accessing the report?
Pricing options include single-user, multi-user, and enterprise licenses priced at USD 4750, USD 5250, and USD 8750 respectively.
10. Is the market size provided in terms of value or volume?
The market size is provided in terms of value, measured in billion and volume, measured in K Unit.
11. Are there any specific market keywords associated with the report?
Yes, the market keyword associated with the report is "Dental CAD Market," which aids in identifying and referencing the specific market segment covered.
12. How do I determine which pricing option suits my needs best?
The pricing options vary based on user requirements and access needs. Individual users may opt for single-user licenses, while businesses requiring broader access may choose multi-user or enterprise licenses for cost-effective access to the report.
13. Are there any additional resources or data provided in the Dental CAD Market report?
While the report offers comprehensive insights, it's advisable to review the specific contents or supplementary materials provided to ascertain if additional resources or data are available.
14. How can I stay updated on further developments or reports in the Dental CAD Market?
To stay informed about further developments, trends, and reports in the Dental CAD Market, consider subscribing to industry newsletters, following relevant companies and organizations, or regularly checking reputable industry news sources and publications.
Methodology
Step 1 - Identification of Relevant Samples Size from Population Database


Step 2 - Approaches for Defining Global Market Size (Value, Volume* & Price*)

Note*: In applicable scenarios
Step 3 - Data Sources
Primary Research
- Web Analytics
- Survey Reports
- Research Institute
- Latest Research Reports
- Opinion Leaders
Secondary Research
- Annual Reports
- White Paper
- Latest Press Release
- Industry Association
- Paid Database
- Investor Presentations

Step 4 - Data Triangulation
Involves using different sources of information in order to increase the validity of a study
These sources are likely to be stakeholders in a program - participants, other researchers, program staff, other community members, and so on.
Then we put all data in single framework & apply various statistical tools to find out the dynamic on the market.
During the analysis stage, feedback from the stakeholder groups would be compared to determine areas of agreement as well as areas of divergence