
Key Insights
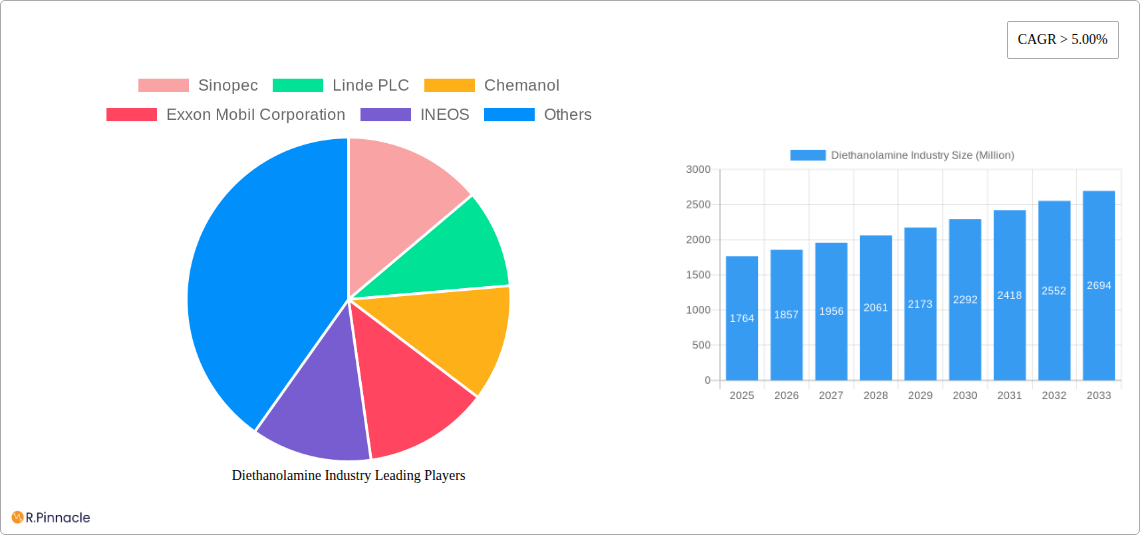
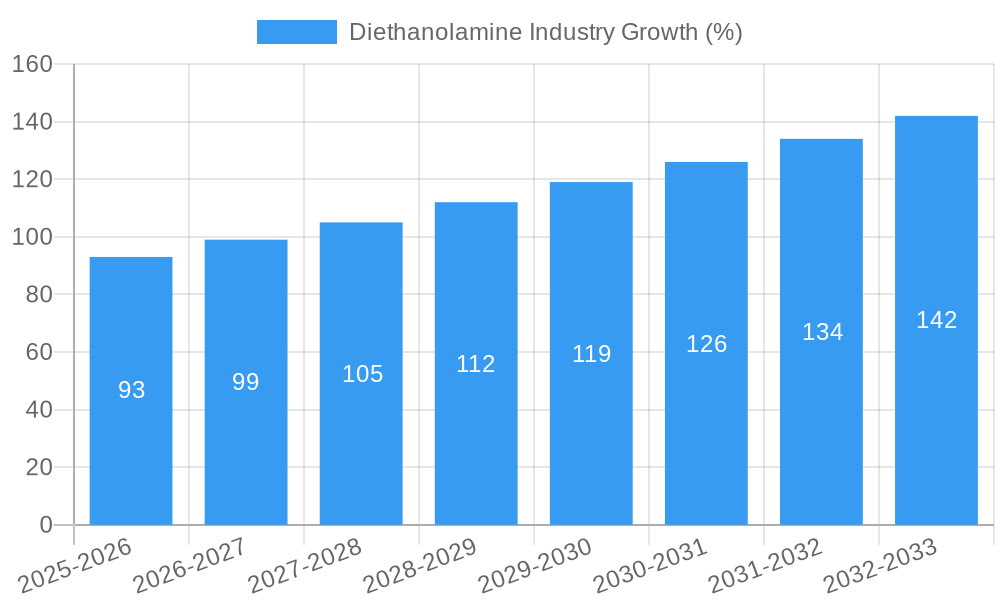
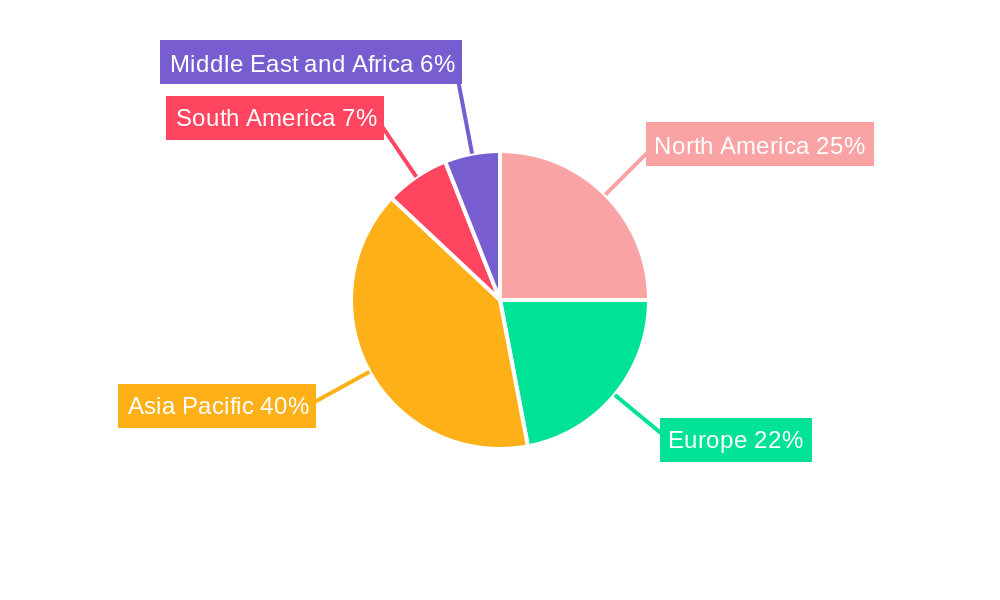
The global diethanolamine (DEA) market, valued at $1764 million in 2025, is projected to experience robust growth, exceeding a 5% CAGR through 2033. This growth is fueled by increasing demand across diverse application sectors. The chemical intermediate segment, utilizing DEA in the production of detergents, surfactants, and other chemicals, is a significant driver, alongside the paints and coatings industry, where DEA acts as a crucial component in improving the properties of resins and formulations. The expanding construction sector, particularly in developing economies of Asia-Pacific, further boosts market demand. Growth in the personal care and cosmetics industries, driven by the rising disposable incomes and changing consumer preferences for enhanced product formulations, also contributes to market expansion. However, environmental concerns related to DEA's potential toxicity and stringent regulations regarding its use in certain applications could act as restraints on market growth, necessitating manufacturers to explore and implement sustainable alternatives and production methods. The competitive landscape is characterized by a mix of large multinational corporations and regional players, indicating the market's maturity while simultaneously allowing for innovation and niche market penetration. Regional analysis suggests Asia-Pacific, driven by the rapidly industrializing economies of China and India, will maintain a significant market share, followed by North America and Europe, which showcase a more mature but stable demand profile.
The market's segmentation reveals specific opportunities within each application and end-user industry. The textile additives segment's growth is tied to the expanding textile industry in countries like India and Bangladesh, while the metalworking fluids segment benefits from increasing industrialization and manufacturing. Gas treatment applications utilize DEA's ability to absorb acidic gases, making it important for various industrial processes. The forecast period will see considerable focus on innovation in sustainable DEA production methods, coupled with efforts to mitigate the environmental concerns associated with its use. This will involve research into alternative solvents and processes as well as the development of biodegradable DEA formulations to meet evolving regulatory requirements and growing sustainability demands. Continuous monitoring of environmental regulations and proactive adaptation of production strategies will be crucial for sustained growth in the coming years.
Diethanolamine Industry Market Report: 2019-2033
This comprehensive report provides an in-depth analysis of the global Diethanolamine industry, offering invaluable insights for industry professionals, investors, and strategic decision-makers. The report covers the period 2019-2033, with a focus on the forecast period 2025-2033 and a base year of 2025. Expect detailed market sizing (in Millions), CAGR projections, and competitive landscape analysis.
Diethanolamine Industry Market Structure & Innovation Trends
This section analyzes the competitive landscape of the diethanolamine market, exploring market concentration, key innovation drivers, regulatory frameworks, the presence of product substitutes, and the demographic profile of end-users. We also examine mergers and acquisitions (M&A) activities within the industry.
Market Concentration: The diethanolamine market exhibits a moderately concentrated structure, with key players like Sinopec, Linde PLC, Chemanol, ExxonMobil Corporation, INEOS, and BASF SE holding significant market share. Precise market share figures are detailed in the full report. The level of concentration is expected to fluctuate slightly depending on M&A activity and new entrants in the forecast period.
Innovation Drivers: The demand for sustainable and biodegradable chemicals is driving innovation in diethanolamine production, leading to the development of bio-based alternatives and improved manufacturing processes. Furthermore, advancements in downstream applications are creating new market opportunities.
Regulatory Frameworks: Stringent environmental regulations regarding emissions and waste disposal are shaping the industry's production processes and influencing the adoption of environmentally friendly solutions. Compliance costs and evolving regulations represent a key consideration for market participants.
Product Substitutes: While there are some limited substitutes, diethanolamine's unique properties in various applications limit the threat of substitution. The report fully explores these alternatives and the situations where they might pose a risk.
M&A Activities: The report details recent M&A transactions, including their value (in Millions) and strategic implications for market consolidation. For example, the recent joint venture between Chemanol and GDI indicates a move towards diversification in the production of specialized chemicals.
End-User Demographics: The report provides a detailed breakdown of end-user industries, analyzing their consumption patterns and growth prospects.
Diethanolamine Industry Market Dynamics & Trends
This section dives deep into the factors influencing diethanolamine market growth, including technological disruptions, evolving consumer preferences, and competitive dynamics. The report provides a comprehensive outlook on market trends and their overall impact. Projected CAGRs are presented based on comprehensive market analysis.
Market Growth Drivers: Key growth drivers include increasing demand from various end-use sectors, such as personal care, agriculture, and industrial applications. The expanding global economy and industrial production are also contributing factors.
Technological Disruptions: The adoption of new technologies in manufacturing processes, such as advanced catalysis and process optimization, has improved the efficiency and cost-effectiveness of diethanolamine production.
Consumer Preferences: Increasing preference for sustainable and eco-friendly products is driving the demand for bio-based diethanolamine alternatives.
Competitive Dynamics: Intense competition among established players and emerging companies influences pricing strategies and innovation efforts within the market. The report provides detailed competitive analysis based on market share and growth strategies. Market penetration rates for various applications are presented.
Dominant Regions & Segments in Diethanolamine Industry
This section pinpoints the leading geographical regions and market segments (both application and end-user industry) for diethanolamine.
Leading Regions: [Details on the dominant region and rationale - e.g., Asia-Pacific due to strong growth in manufacturing industries, or North America due to high consumption in specific end-use segments will be provided here.] Detailed analysis of each region's market size, growth drivers and restraints will be found in the full report.
Leading Applications: The report identifies the dominant application segments, providing a comprehensive analysis for Chemical Intermediate, Paints and Coatings, Metalworking Fluids, Textile Additives, Gas Treatment, and Other Applications. This section details factors such as volume consumption, pricing, and growth prospects within each segment.
Key Drivers (by Region and Segment):
- Economic Policies: Government support for the chemical industry in certain regions.
- Infrastructure Development: Availability of infrastructure for production and distribution.
- Demand from specific End-Users: High demand from growing industries like textiles in specific regions.
End-User Industry Dominance: A similar detailed analysis will be provided for Agriculture, Personal Care, Textile, Construction, Cosmetics, and Other End-user Industries.
Diethanolamine Industry Product Innovations
This section summarizes recent product developments in diethanolamine, including new applications and their competitive advantages, highlighting technological trends and market fit. Recent innovations have focused on improving the sustainability of production processes and enhancing product performance to meet evolving market demands.
Report Scope & Segmentation Analysis
This report provides a detailed segmentation analysis of the diethanolamine market by application (Chemical Intermediate, Paints and Coatings, Metalworking Fluids, Textile Additives, Gas Treatment, Other Applications) and end-user industry (Agriculture, Personal Care, Textile, Construction, Cosmetics, Other End-user Industries). Each segment's growth projections, market size (in Millions), and competitive dynamics are analyzed thoroughly. For example, the Chemical Intermediate segment is expected to exhibit significant growth due to its extensive use in other chemical production processes. The report projects xx Million for this segment by 2033.
Key Drivers of Diethanolamine Industry Growth
Several factors are driving growth in the diethanolamine market. These include technological advancements in manufacturing processes, increasing demand from various end-use industries driven by global economic growth, and favorable government regulations promoting sustainable chemical production.
Challenges in the Diethanolamine Industry Sector
The diethanolamine industry faces several challenges, including fluctuations in raw material prices, stringent environmental regulations that increase production costs, and intense competition from existing and emerging players. These factors can impact profitability and necessitate adaptive strategies for industry stakeholders.
Emerging Opportunities in Diethanolamine Industry
The diethanolamine market presents promising opportunities for growth. The increasing demand for bio-based and sustainable products, coupled with advancements in downstream applications, opens up potential for innovation and expansion into new market segments. The development of novel applications in emerging sectors presents additional opportunities.
Leading Players in the Diethanolamine Industry Market
- Sinopec
- Linde PLC (Linde PLC)
- Chemanol
- Exxon Mobil Corporation (ExxonMobil)
- INEOS (INEOS)
- Mitsubishi Chemical Corporation (Mitsubishi Chemical)
- Reliance Industries Limited (Reliance Industries)
- BASF SE (BASF)
- LyondellBasell Industries Holdings B V (LyondellBasell)
- SABIC (SABIC)
- NIPPON SHOKUBAI CO LTD (NIPPON SHOKUBAI)
- LG Chem
- Dow (Dow)
- Formosa Plastics Corporation
- Air Liquide (Air Liquide)
- HELM AG (HELM AG)
Key Developments in Diethanolamine Industry
February 2023: Chemanol, a Saudi Methanol Chemicals Company, signed a joint venture agreement with GDI to develop a national company producing specialized chemicals, including methyl diethanolamine. Chemanol holds a 60% stake.
February 2023: NIPPON SHOKUBAI CO., LTD. received ISCC PLUS certification for 19 products, including Diethanolamine, enabling the use of biomass-derived raw materials.
Future Outlook for Diethanolamine Industry Market
The future outlook for the diethanolamine market is positive, driven by sustained growth in key end-use sectors and ongoing innovation in production processes and applications. The market is poised for continued expansion, with opportunities for strategic partnerships and market diversification. The report projects a market size of xx Million by 2033.
Diethanolamine Industry Segmentation
-
1. Application
- 1.1. Chemical Intermediate
- 1.2. Paints and Coatings
- 1.3. Metalworking Fluids
- 1.4. Textile Additives
- 1.5. Gas Treatment
- 1.6. Other Applications
-
2. End-user Industry
- 2.1. Agriculture
- 2.2. Personal Care
- 2.3. Textile
- 2.4. Construction
- 2.5. Cosmetics
- 2.6. Other End-user Industries
Diethanolamine Industry Segmentation By Geography
-
1. Asia Pacific
- 1.1. China
- 1.2. India
- 1.3. Japan
- 1.4. South Korea
- 1.5. Rest of Asia Pacific
-
2. North America
- 2.1. United States
- 2.2. Canada
- 2.3. Mexico
-
3. Europe
- 3.1. Germany
- 3.2. United Kingdom
- 3.3. France
- 3.4. Italy
- 3.5. Rest of Europe
-
4. South America
- 4.1. Brazil
- 4.2. Argentina
- 4.3. Rest of South America
-
5. Middle East and Africa
- 5.1. Saudi Arabia
- 5.2. South Africa
- 5.3. Rest of Middle East and Africa
Diethanolamine Industry REPORT HIGHLIGHTS
| Aspects | Details |
|---|---|
| Study Period | 2019-2033 |
| Base Year | 2024 |
| Estimated Year | 2025 |
| Forecast Period | 2025-2033 |
| Historical Period | 2019-2024 |
| Growth Rate | CAGR of > 5.00% from 2019-2033 |
| Segmentation |
|
Table of Contents
- 1. Introduction
- 1.1. Research Scope
- 1.2. Market Segmentation
- 1.3. Research Methodology
- 1.4. Definitions and Assumptions
- 2. Executive Summary
- 2.1. Introduction
- 3. Market Dynamics
- 3.1. Introduction
- 3.2. Market Drivers
- 3.2.1. Increasing Consumption of DEA as Herbicide in the Agricultural Industry; Increasing Construction Activities
- 3.3. Market Restrains
- 3.3.1. Environmental and Health Concerns; Other Restraints
- 3.4. Market Trends
- 3.4.1. Increasing Demand from the Textile Industry
- 4. Market Factor Analysis
- 4.1. Porters Five Forces
- 4.2. Supply/Value Chain
- 4.3. PESTEL analysis
- 4.4. Market Entropy
- 4.5. Patent/Trademark Analysis
- 5. Global Diethanolamine Industry Analysis, Insights and Forecast, 2019-2031
- 5.1. Market Analysis, Insights and Forecast - by Application
- 5.1.1. Chemical Intermediate
- 5.1.2. Paints and Coatings
- 5.1.3. Metalworking Fluids
- 5.1.4. Textile Additives
- 5.1.5. Gas Treatment
- 5.1.6. Other Applications
- 5.2. Market Analysis, Insights and Forecast - by End-user Industry
- 5.2.1. Agriculture
- 5.2.2. Personal Care
- 5.2.3. Textile
- 5.2.4. Construction
- 5.2.5. Cosmetics
- 5.2.6. Other End-user Industries
- 5.3. Market Analysis, Insights and Forecast - by Region
- 5.3.1. Asia Pacific
- 5.3.2. North America
- 5.3.3. Europe
- 5.3.4. South America
- 5.3.5. Middle East and Africa
- 5.1. Market Analysis, Insights and Forecast - by Application
- 6. Asia Pacific Diethanolamine Industry Analysis, Insights and Forecast, 2019-2031
- 6.1. Market Analysis, Insights and Forecast - by Application
- 6.1.1. Chemical Intermediate
- 6.1.2. Paints and Coatings
- 6.1.3. Metalworking Fluids
- 6.1.4. Textile Additives
- 6.1.5. Gas Treatment
- 6.1.6. Other Applications
- 6.2. Market Analysis, Insights and Forecast - by End-user Industry
- 6.2.1. Agriculture
- 6.2.2. Personal Care
- 6.2.3. Textile
- 6.2.4. Construction
- 6.2.5. Cosmetics
- 6.2.6. Other End-user Industries
- 6.1. Market Analysis, Insights and Forecast - by Application
- 7. North America Diethanolamine Industry Analysis, Insights and Forecast, 2019-2031
- 7.1. Market Analysis, Insights and Forecast - by Application
- 7.1.1. Chemical Intermediate
- 7.1.2. Paints and Coatings
- 7.1.3. Metalworking Fluids
- 7.1.4. Textile Additives
- 7.1.5. Gas Treatment
- 7.1.6. Other Applications
- 7.2. Market Analysis, Insights and Forecast - by End-user Industry
- 7.2.1. Agriculture
- 7.2.2. Personal Care
- 7.2.3. Textile
- 7.2.4. Construction
- 7.2.5. Cosmetics
- 7.2.6. Other End-user Industries
- 7.1. Market Analysis, Insights and Forecast - by Application
- 8. Europe Diethanolamine Industry Analysis, Insights and Forecast, 2019-2031
- 8.1. Market Analysis, Insights and Forecast - by Application
- 8.1.1. Chemical Intermediate
- 8.1.2. Paints and Coatings
- 8.1.3. Metalworking Fluids
- 8.1.4. Textile Additives
- 8.1.5. Gas Treatment
- 8.1.6. Other Applications
- 8.2. Market Analysis, Insights and Forecast - by End-user Industry
- 8.2.1. Agriculture
- 8.2.2. Personal Care
- 8.2.3. Textile
- 8.2.4. Construction
- 8.2.5. Cosmetics
- 8.2.6. Other End-user Industries
- 8.1. Market Analysis, Insights and Forecast - by Application
- 9. South America Diethanolamine Industry Analysis, Insights and Forecast, 2019-2031
- 9.1. Market Analysis, Insights and Forecast - by Application
- 9.1.1. Chemical Intermediate
- 9.1.2. Paints and Coatings
- 9.1.3. Metalworking Fluids
- 9.1.4. Textile Additives
- 9.1.5. Gas Treatment
- 9.1.6. Other Applications
- 9.2. Market Analysis, Insights and Forecast - by End-user Industry
- 9.2.1. Agriculture
- 9.2.2. Personal Care
- 9.2.3. Textile
- 9.2.4. Construction
- 9.2.5. Cosmetics
- 9.2.6. Other End-user Industries
- 9.1. Market Analysis, Insights and Forecast - by Application
- 10. Middle East and Africa Diethanolamine Industry Analysis, Insights and Forecast, 2019-2031
- 10.1. Market Analysis, Insights and Forecast - by Application
- 10.1.1. Chemical Intermediate
- 10.1.2. Paints and Coatings
- 10.1.3. Metalworking Fluids
- 10.1.4. Textile Additives
- 10.1.5. Gas Treatment
- 10.1.6. Other Applications
- 10.2. Market Analysis, Insights and Forecast - by End-user Industry
- 10.2.1. Agriculture
- 10.2.2. Personal Care
- 10.2.3. Textile
- 10.2.4. Construction
- 10.2.5. Cosmetics
- 10.2.6. Other End-user Industries
- 10.1. Market Analysis, Insights and Forecast - by Application
- 11. Asia Pacific Diethanolamine Industry Analysis, Insights and Forecast, 2019-2031
- 11.1. Market Analysis, Insights and Forecast - By Country/Sub-region
- 11.1.1 China
- 11.1.2 India
- 11.1.3 Japan
- 11.1.4 South Korea
- 11.1.5 Rest of Asia Pacific
- 12. North America Diethanolamine Industry Analysis, Insights and Forecast, 2019-2031
- 12.1. Market Analysis, Insights and Forecast - By Country/Sub-region
- 12.1.1 United States
- 12.1.2 Canada
- 12.1.3 Mexico
- 13. Europe Diethanolamine Industry Analysis, Insights and Forecast, 2019-2031
- 13.1. Market Analysis, Insights and Forecast - By Country/Sub-region
- 13.1.1 Germany
- 13.1.2 United Kingdom
- 13.1.3 France
- 13.1.4 Italy
- 13.1.5 Rest of Europe
- 14. South America Diethanolamine Industry Analysis, Insights and Forecast, 2019-2031
- 14.1. Market Analysis, Insights and Forecast - By Country/Sub-region
- 14.1.1 Brazil
- 14.1.2 Argentina
- 14.1.3 Rest of South America
- 15. Middle East and Africa Diethanolamine Industry Analysis, Insights and Forecast, 2019-2031
- 15.1. Market Analysis, Insights and Forecast - By Country/Sub-region
- 15.1.1 Saudi Arabia
- 15.1.2 South Africa
- 15.1.3 Rest of Middle East and Africa
- 16. Competitive Analysis
- 16.1. Global Market Share Analysis 2024
- 16.2. Company Profiles
- 16.2.1 Sinopec
- 16.2.1.1. Overview
- 16.2.1.2. Products
- 16.2.1.3. SWOT Analysis
- 16.2.1.4. Recent Developments
- 16.2.1.5. Financials (Based on Availability)
- 16.2.2 Linde PLC
- 16.2.2.1. Overview
- 16.2.2.2. Products
- 16.2.2.3. SWOT Analysis
- 16.2.2.4. Recent Developments
- 16.2.2.5. Financials (Based on Availability)
- 16.2.3 Chemanol
- 16.2.3.1. Overview
- 16.2.3.2. Products
- 16.2.3.3. SWOT Analysis
- 16.2.3.4. Recent Developments
- 16.2.3.5. Financials (Based on Availability)
- 16.2.4 Exxon Mobil Corporation
- 16.2.4.1. Overview
- 16.2.4.2. Products
- 16.2.4.3. SWOT Analysis
- 16.2.4.4. Recent Developments
- 16.2.4.5. Financials (Based on Availability)
- 16.2.5 INEOS
- 16.2.5.1. Overview
- 16.2.5.2. Products
- 16.2.5.3. SWOT Analysis
- 16.2.5.4. Recent Developments
- 16.2.5.5. Financials (Based on Availability)
- 16.2.6 Mitsubishi Chemical Corporation
- 16.2.6.1. Overview
- 16.2.6.2. Products
- 16.2.6.3. SWOT Analysis
- 16.2.6.4. Recent Developments
- 16.2.6.5. Financials (Based on Availability)
- 16.2.7 Reliance Industries Limited
- 16.2.7.1. Overview
- 16.2.7.2. Products
- 16.2.7.3. SWOT Analysis
- 16.2.7.4. Recent Developments
- 16.2.7.5. Financials (Based on Availability)
- 16.2.8 BASF SE
- 16.2.8.1. Overview
- 16.2.8.2. Products
- 16.2.8.3. SWOT Analysis
- 16.2.8.4. Recent Developments
- 16.2.8.5. Financials (Based on Availability)
- 16.2.9 LyondellBasell Industries Holdings B V
- 16.2.9.1. Overview
- 16.2.9.2. Products
- 16.2.9.3. SWOT Analysis
- 16.2.9.4. Recent Developments
- 16.2.9.5. Financials (Based on Availability)
- 16.2.10 SABIC
- 16.2.10.1. Overview
- 16.2.10.2. Products
- 16.2.10.3. SWOT Analysis
- 16.2.10.4. Recent Developments
- 16.2.10.5. Financials (Based on Availability)
- 16.2.11 NIPPON SHOKUBAI CO LTD *List Not Exhaustive
- 16.2.11.1. Overview
- 16.2.11.2. Products
- 16.2.11.3. SWOT Analysis
- 16.2.11.4. Recent Developments
- 16.2.11.5. Financials (Based on Availability)
- 16.2.12 LG Chem
- 16.2.12.1. Overview
- 16.2.12.2. Products
- 16.2.12.3. SWOT Analysis
- 16.2.12.4. Recent Developments
- 16.2.12.5. Financials (Based on Availability)
- 16.2.13 Dow
- 16.2.13.1. Overview
- 16.2.13.2. Products
- 16.2.13.3. SWOT Analysis
- 16.2.13.4. Recent Developments
- 16.2.13.5. Financials (Based on Availability)
- 16.2.14 Formosa Plastics Corporation
- 16.2.14.1. Overview
- 16.2.14.2. Products
- 16.2.14.3. SWOT Analysis
- 16.2.14.4. Recent Developments
- 16.2.14.5. Financials (Based on Availability)
- 16.2.15 Air Liquide
- 16.2.15.1. Overview
- 16.2.15.2. Products
- 16.2.15.3. SWOT Analysis
- 16.2.15.4. Recent Developments
- 16.2.15.5. Financials (Based on Availability)
- 16.2.16 HELM AG
- 16.2.16.1. Overview
- 16.2.16.2. Products
- 16.2.16.3. SWOT Analysis
- 16.2.16.4. Recent Developments
- 16.2.16.5. Financials (Based on Availability)
- 16.2.1 Sinopec
List of Figures
- Figure 1: Global Diethanolamine Industry Revenue Breakdown (Million, %) by Region 2024 & 2032
- Figure 2: Global Diethanolamine Industry Volume Breakdown (K Tons, %) by Region 2024 & 2032
- Figure 3: Asia Pacific Diethanolamine Industry Revenue (Million), by Country 2024 & 2032
- Figure 4: Asia Pacific Diethanolamine Industry Volume (K Tons), by Country 2024 & 2032
- Figure 5: Asia Pacific Diethanolamine Industry Revenue Share (%), by Country 2024 & 2032
- Figure 6: Asia Pacific Diethanolamine Industry Volume Share (%), by Country 2024 & 2032
- Figure 7: North America Diethanolamine Industry Revenue (Million), by Country 2024 & 2032
- Figure 8: North America Diethanolamine Industry Volume (K Tons), by Country 2024 & 2032
- Figure 9: North America Diethanolamine Industry Revenue Share (%), by Country 2024 & 2032
- Figure 10: North America Diethanolamine Industry Volume Share (%), by Country 2024 & 2032
- Figure 11: Europe Diethanolamine Industry Revenue (Million), by Country 2024 & 2032
- Figure 12: Europe Diethanolamine Industry Volume (K Tons), by Country 2024 & 2032
- Figure 13: Europe Diethanolamine Industry Revenue Share (%), by Country 2024 & 2032
- Figure 14: Europe Diethanolamine Industry Volume Share (%), by Country 2024 & 2032
- Figure 15: South America Diethanolamine Industry Revenue (Million), by Country 2024 & 2032
- Figure 16: South America Diethanolamine Industry Volume (K Tons), by Country 2024 & 2032
- Figure 17: South America Diethanolamine Industry Revenue Share (%), by Country 2024 & 2032
- Figure 18: South America Diethanolamine Industry Volume Share (%), by Country 2024 & 2032
- Figure 19: Middle East and Africa Diethanolamine Industry Revenue (Million), by Country 2024 & 2032
- Figure 20: Middle East and Africa Diethanolamine Industry Volume (K Tons), by Country 2024 & 2032
- Figure 21: Middle East and Africa Diethanolamine Industry Revenue Share (%), by Country 2024 & 2032
- Figure 22: Middle East and Africa Diethanolamine Industry Volume Share (%), by Country 2024 & 2032
- Figure 23: Asia Pacific Diethanolamine Industry Revenue (Million), by Application 2024 & 2032
- Figure 24: Asia Pacific Diethanolamine Industry Volume (K Tons), by Application 2024 & 2032
- Figure 25: Asia Pacific Diethanolamine Industry Revenue Share (%), by Application 2024 & 2032
- Figure 26: Asia Pacific Diethanolamine Industry Volume Share (%), by Application 2024 & 2032
- Figure 27: Asia Pacific Diethanolamine Industry Revenue (Million), by End-user Industry 2024 & 2032
- Figure 28: Asia Pacific Diethanolamine Industry Volume (K Tons), by End-user Industry 2024 & 2032
- Figure 29: Asia Pacific Diethanolamine Industry Revenue Share (%), by End-user Industry 2024 & 2032
- Figure 30: Asia Pacific Diethanolamine Industry Volume Share (%), by End-user Industry 2024 & 2032
- Figure 31: Asia Pacific Diethanolamine Industry Revenue (Million), by Country 2024 & 2032
- Figure 32: Asia Pacific Diethanolamine Industry Volume (K Tons), by Country 2024 & 2032
- Figure 33: Asia Pacific Diethanolamine Industry Revenue Share (%), by Country 2024 & 2032
- Figure 34: Asia Pacific Diethanolamine Industry Volume Share (%), by Country 2024 & 2032
- Figure 35: North America Diethanolamine Industry Revenue (Million), by Application 2024 & 2032
- Figure 36: North America Diethanolamine Industry Volume (K Tons), by Application 2024 & 2032
- Figure 37: North America Diethanolamine Industry Revenue Share (%), by Application 2024 & 2032
- Figure 38: North America Diethanolamine Industry Volume Share (%), by Application 2024 & 2032
- Figure 39: North America Diethanolamine Industry Revenue (Million), by End-user Industry 2024 & 2032
- Figure 40: North America Diethanolamine Industry Volume (K Tons), by End-user Industry 2024 & 2032
- Figure 41: North America Diethanolamine Industry Revenue Share (%), by End-user Industry 2024 & 2032
- Figure 42: North America Diethanolamine Industry Volume Share (%), by End-user Industry 2024 & 2032
- Figure 43: North America Diethanolamine Industry Revenue (Million), by Country 2024 & 2032
- Figure 44: North America Diethanolamine Industry Volume (K Tons), by Country 2024 & 2032
- Figure 45: North America Diethanolamine Industry Revenue Share (%), by Country 2024 & 2032
- Figure 46: North America Diethanolamine Industry Volume Share (%), by Country 2024 & 2032
- Figure 47: Europe Diethanolamine Industry Revenue (Million), by Application 2024 & 2032
- Figure 48: Europe Diethanolamine Industry Volume (K Tons), by Application 2024 & 2032
- Figure 49: Europe Diethanolamine Industry Revenue Share (%), by Application 2024 & 2032
- Figure 50: Europe Diethanolamine Industry Volume Share (%), by Application 2024 & 2032
- Figure 51: Europe Diethanolamine Industry Revenue (Million), by End-user Industry 2024 & 2032
- Figure 52: Europe Diethanolamine Industry Volume (K Tons), by End-user Industry 2024 & 2032
- Figure 53: Europe Diethanolamine Industry Revenue Share (%), by End-user Industry 2024 & 2032
- Figure 54: Europe Diethanolamine Industry Volume Share (%), by End-user Industry 2024 & 2032
- Figure 55: Europe Diethanolamine Industry Revenue (Million), by Country 2024 & 2032
- Figure 56: Europe Diethanolamine Industry Volume (K Tons), by Country 2024 & 2032
- Figure 57: Europe Diethanolamine Industry Revenue Share (%), by Country 2024 & 2032
- Figure 58: Europe Diethanolamine Industry Volume Share (%), by Country 2024 & 2032
- Figure 59: South America Diethanolamine Industry Revenue (Million), by Application 2024 & 2032
- Figure 60: South America Diethanolamine Industry Volume (K Tons), by Application 2024 & 2032
- Figure 61: South America Diethanolamine Industry Revenue Share (%), by Application 2024 & 2032
- Figure 62: South America Diethanolamine Industry Volume Share (%), by Application 2024 & 2032
- Figure 63: South America Diethanolamine Industry Revenue (Million), by End-user Industry 2024 & 2032
- Figure 64: South America Diethanolamine Industry Volume (K Tons), by End-user Industry 2024 & 2032
- Figure 65: South America Diethanolamine Industry Revenue Share (%), by End-user Industry 2024 & 2032
- Figure 66: South America Diethanolamine Industry Volume Share (%), by End-user Industry 2024 & 2032
- Figure 67: South America Diethanolamine Industry Revenue (Million), by Country 2024 & 2032
- Figure 68: South America Diethanolamine Industry Volume (K Tons), by Country 2024 & 2032
- Figure 69: South America Diethanolamine Industry Revenue Share (%), by Country 2024 & 2032
- Figure 70: South America Diethanolamine Industry Volume Share (%), by Country 2024 & 2032
- Figure 71: Middle East and Africa Diethanolamine Industry Revenue (Million), by Application 2024 & 2032
- Figure 72: Middle East and Africa Diethanolamine Industry Volume (K Tons), by Application 2024 & 2032
- Figure 73: Middle East and Africa Diethanolamine Industry Revenue Share (%), by Application 2024 & 2032
- Figure 74: Middle East and Africa Diethanolamine Industry Volume Share (%), by Application 2024 & 2032
- Figure 75: Middle East and Africa Diethanolamine Industry Revenue (Million), by End-user Industry 2024 & 2032
- Figure 76: Middle East and Africa Diethanolamine Industry Volume (K Tons), by End-user Industry 2024 & 2032
- Figure 77: Middle East and Africa Diethanolamine Industry Revenue Share (%), by End-user Industry 2024 & 2032
- Figure 78: Middle East and Africa Diethanolamine Industry Volume Share (%), by End-user Industry 2024 & 2032
- Figure 79: Middle East and Africa Diethanolamine Industry Revenue (Million), by Country 2024 & 2032
- Figure 80: Middle East and Africa Diethanolamine Industry Volume (K Tons), by Country 2024 & 2032
- Figure 81: Middle East and Africa Diethanolamine Industry Revenue Share (%), by Country 2024 & 2032
- Figure 82: Middle East and Africa Diethanolamine Industry Volume Share (%), by Country 2024 & 2032
List of Tables
- Table 1: Global Diethanolamine Industry Revenue Million Forecast, by Region 2019 & 2032
- Table 2: Global Diethanolamine Industry Volume K Tons Forecast, by Region 2019 & 2032
- Table 3: Global Diethanolamine Industry Revenue Million Forecast, by Application 2019 & 2032
- Table 4: Global Diethanolamine Industry Volume K Tons Forecast, by Application 2019 & 2032
- Table 5: Global Diethanolamine Industry Revenue Million Forecast, by End-user Industry 2019 & 2032
- Table 6: Global Diethanolamine Industry Volume K Tons Forecast, by End-user Industry 2019 & 2032
- Table 7: Global Diethanolamine Industry Revenue Million Forecast, by Region 2019 & 2032
- Table 8: Global Diethanolamine Industry Volume K Tons Forecast, by Region 2019 & 2032
- Table 9: Global Diethanolamine Industry Revenue Million Forecast, by Country 2019 & 2032
- Table 10: Global Diethanolamine Industry Volume K Tons Forecast, by Country 2019 & 2032
- Table 11: China Diethanolamine Industry Revenue (Million) Forecast, by Application 2019 & 2032
- Table 12: China Diethanolamine Industry Volume (K Tons) Forecast, by Application 2019 & 2032
- Table 13: India Diethanolamine Industry Revenue (Million) Forecast, by Application 2019 & 2032
- Table 14: India Diethanolamine Industry Volume (K Tons) Forecast, by Application 2019 & 2032
- Table 15: Japan Diethanolamine Industry Revenue (Million) Forecast, by Application 2019 & 2032
- Table 16: Japan Diethanolamine Industry Volume (K Tons) Forecast, by Application 2019 & 2032
- Table 17: South Korea Diethanolamine Industry Revenue (Million) Forecast, by Application 2019 & 2032
- Table 18: South Korea Diethanolamine Industry Volume (K Tons) Forecast, by Application 2019 & 2032
- Table 19: Rest of Asia Pacific Diethanolamine Industry Revenue (Million) Forecast, by Application 2019 & 2032
- Table 20: Rest of Asia Pacific Diethanolamine Industry Volume (K Tons) Forecast, by Application 2019 & 2032
- Table 21: Global Diethanolamine Industry Revenue Million Forecast, by Country 2019 & 2032
- Table 22: Global Diethanolamine Industry Volume K Tons Forecast, by Country 2019 & 2032
- Table 23: United States Diethanolamine Industry Revenue (Million) Forecast, by Application 2019 & 2032
- Table 24: United States Diethanolamine Industry Volume (K Tons) Forecast, by Application 2019 & 2032
- Table 25: Canada Diethanolamine Industry Revenue (Million) Forecast, by Application 2019 & 2032
- Table 26: Canada Diethanolamine Industry Volume (K Tons) Forecast, by Application 2019 & 2032
- Table 27: Mexico Diethanolamine Industry Revenue (Million) Forecast, by Application 2019 & 2032
- Table 28: Mexico Diethanolamine Industry Volume (K Tons) Forecast, by Application 2019 & 2032
- Table 29: Global Diethanolamine Industry Revenue Million Forecast, by Country 2019 & 2032
- Table 30: Global Diethanolamine Industry Volume K Tons Forecast, by Country 2019 & 2032
- Table 31: Germany Diethanolamine Industry Revenue (Million) Forecast, by Application 2019 & 2032
- Table 32: Germany Diethanolamine Industry Volume (K Tons) Forecast, by Application 2019 & 2032
- Table 33: United Kingdom Diethanolamine Industry Revenue (Million) Forecast, by Application 2019 & 2032
- Table 34: United Kingdom Diethanolamine Industry Volume (K Tons) Forecast, by Application 2019 & 2032
- Table 35: France Diethanolamine Industry Revenue (Million) Forecast, by Application 2019 & 2032
- Table 36: France Diethanolamine Industry Volume (K Tons) Forecast, by Application 2019 & 2032
- Table 37: Italy Diethanolamine Industry Revenue (Million) Forecast, by Application 2019 & 2032
- Table 38: Italy Diethanolamine Industry Volume (K Tons) Forecast, by Application 2019 & 2032
- Table 39: Rest of Europe Diethanolamine Industry Revenue (Million) Forecast, by Application 2019 & 2032
- Table 40: Rest of Europe Diethanolamine Industry Volume (K Tons) Forecast, by Application 2019 & 2032
- Table 41: Global Diethanolamine Industry Revenue Million Forecast, by Country 2019 & 2032
- Table 42: Global Diethanolamine Industry Volume K Tons Forecast, by Country 2019 & 2032
- Table 43: Brazil Diethanolamine Industry Revenue (Million) Forecast, by Application 2019 & 2032
- Table 44: Brazil Diethanolamine Industry Volume (K Tons) Forecast, by Application 2019 & 2032
- Table 45: Argentina Diethanolamine Industry Revenue (Million) Forecast, by Application 2019 & 2032
- Table 46: Argentina Diethanolamine Industry Volume (K Tons) Forecast, by Application 2019 & 2032
- Table 47: Rest of South America Diethanolamine Industry Revenue (Million) Forecast, by Application 2019 & 2032
- Table 48: Rest of South America Diethanolamine Industry Volume (K Tons) Forecast, by Application 2019 & 2032
- Table 49: Global Diethanolamine Industry Revenue Million Forecast, by Country 2019 & 2032
- Table 50: Global Diethanolamine Industry Volume K Tons Forecast, by Country 2019 & 2032
- Table 51: Saudi Arabia Diethanolamine Industry Revenue (Million) Forecast, by Application 2019 & 2032
- Table 52: Saudi Arabia Diethanolamine Industry Volume (K Tons) Forecast, by Application 2019 & 2032
- Table 53: South Africa Diethanolamine Industry Revenue (Million) Forecast, by Application 2019 & 2032
- Table 54: South Africa Diethanolamine Industry Volume (K Tons) Forecast, by Application 2019 & 2032
- Table 55: Rest of Middle East and Africa Diethanolamine Industry Revenue (Million) Forecast, by Application 2019 & 2032
- Table 56: Rest of Middle East and Africa Diethanolamine Industry Volume (K Tons) Forecast, by Application 2019 & 2032
- Table 57: Global Diethanolamine Industry Revenue Million Forecast, by Application 2019 & 2032
- Table 58: Global Diethanolamine Industry Volume K Tons Forecast, by Application 2019 & 2032
- Table 59: Global Diethanolamine Industry Revenue Million Forecast, by End-user Industry 2019 & 2032
- Table 60: Global Diethanolamine Industry Volume K Tons Forecast, by End-user Industry 2019 & 2032
- Table 61: Global Diethanolamine Industry Revenue Million Forecast, by Country 2019 & 2032
- Table 62: Global Diethanolamine Industry Volume K Tons Forecast, by Country 2019 & 2032
- Table 63: China Diethanolamine Industry Revenue (Million) Forecast, by Application 2019 & 2032
- Table 64: China Diethanolamine Industry Volume (K Tons) Forecast, by Application 2019 & 2032
- Table 65: India Diethanolamine Industry Revenue (Million) Forecast, by Application 2019 & 2032
- Table 66: India Diethanolamine Industry Volume (K Tons) Forecast, by Application 2019 & 2032
- Table 67: Japan Diethanolamine Industry Revenue (Million) Forecast, by Application 2019 & 2032
- Table 68: Japan Diethanolamine Industry Volume (K Tons) Forecast, by Application 2019 & 2032
- Table 69: South Korea Diethanolamine Industry Revenue (Million) Forecast, by Application 2019 & 2032
- Table 70: South Korea Diethanolamine Industry Volume (K Tons) Forecast, by Application 2019 & 2032
- Table 71: Rest of Asia Pacific Diethanolamine Industry Revenue (Million) Forecast, by Application 2019 & 2032
- Table 72: Rest of Asia Pacific Diethanolamine Industry Volume (K Tons) Forecast, by Application 2019 & 2032
- Table 73: Global Diethanolamine Industry Revenue Million Forecast, by Application 2019 & 2032
- Table 74: Global Diethanolamine Industry Volume K Tons Forecast, by Application 2019 & 2032
- Table 75: Global Diethanolamine Industry Revenue Million Forecast, by End-user Industry 2019 & 2032
- Table 76: Global Diethanolamine Industry Volume K Tons Forecast, by End-user Industry 2019 & 2032
- Table 77: Global Diethanolamine Industry Revenue Million Forecast, by Country 2019 & 2032
- Table 78: Global Diethanolamine Industry Volume K Tons Forecast, by Country 2019 & 2032
- Table 79: United States Diethanolamine Industry Revenue (Million) Forecast, by Application 2019 & 2032
- Table 80: United States Diethanolamine Industry Volume (K Tons) Forecast, by Application 2019 & 2032
- Table 81: Canada Diethanolamine Industry Revenue (Million) Forecast, by Application 2019 & 2032
- Table 82: Canada Diethanolamine Industry Volume (K Tons) Forecast, by Application 2019 & 2032
- Table 83: Mexico Diethanolamine Industry Revenue (Million) Forecast, by Application 2019 & 2032
- Table 84: Mexico Diethanolamine Industry Volume (K Tons) Forecast, by Application 2019 & 2032
- Table 85: Global Diethanolamine Industry Revenue Million Forecast, by Application 2019 & 2032
- Table 86: Global Diethanolamine Industry Volume K Tons Forecast, by Application 2019 & 2032
- Table 87: Global Diethanolamine Industry Revenue Million Forecast, by End-user Industry 2019 & 2032
- Table 88: Global Diethanolamine Industry Volume K Tons Forecast, by End-user Industry 2019 & 2032
- Table 89: Global Diethanolamine Industry Revenue Million Forecast, by Country 2019 & 2032
- Table 90: Global Diethanolamine Industry Volume K Tons Forecast, by Country 2019 & 2032
- Table 91: Germany Diethanolamine Industry Revenue (Million) Forecast, by Application 2019 & 2032
- Table 92: Germany Diethanolamine Industry Volume (K Tons) Forecast, by Application 2019 & 2032
- Table 93: United Kingdom Diethanolamine Industry Revenue (Million) Forecast, by Application 2019 & 2032
- Table 94: United Kingdom Diethanolamine Industry Volume (K Tons) Forecast, by Application 2019 & 2032
- Table 95: France Diethanolamine Industry Revenue (Million) Forecast, by Application 2019 & 2032
- Table 96: France Diethanolamine Industry Volume (K Tons) Forecast, by Application 2019 & 2032
- Table 97: Italy Diethanolamine Industry Revenue (Million) Forecast, by Application 2019 & 2032
- Table 98: Italy Diethanolamine Industry Volume (K Tons) Forecast, by Application 2019 & 2032
- Table 99: Rest of Europe Diethanolamine Industry Revenue (Million) Forecast, by Application 2019 & 2032
- Table 100: Rest of Europe Diethanolamine Industry Volume (K Tons) Forecast, by Application 2019 & 2032
- Table 101: Global Diethanolamine Industry Revenue Million Forecast, by Application 2019 & 2032
- Table 102: Global Diethanolamine Industry Volume K Tons Forecast, by Application 2019 & 2032
- Table 103: Global Diethanolamine Industry Revenue Million Forecast, by End-user Industry 2019 & 2032
- Table 104: Global Diethanolamine Industry Volume K Tons Forecast, by End-user Industry 2019 & 2032
- Table 105: Global Diethanolamine Industry Revenue Million Forecast, by Country 2019 & 2032
- Table 106: Global Diethanolamine Industry Volume K Tons Forecast, by Country 2019 & 2032
- Table 107: Brazil Diethanolamine Industry Revenue (Million) Forecast, by Application 2019 & 2032
- Table 108: Brazil Diethanolamine Industry Volume (K Tons) Forecast, by Application 2019 & 2032
- Table 109: Argentina Diethanolamine Industry Revenue (Million) Forecast, by Application 2019 & 2032
- Table 110: Argentina Diethanolamine Industry Volume (K Tons) Forecast, by Application 2019 & 2032
- Table 111: Rest of South America Diethanolamine Industry Revenue (Million) Forecast, by Application 2019 & 2032
- Table 112: Rest of South America Diethanolamine Industry Volume (K Tons) Forecast, by Application 2019 & 2032
- Table 113: Global Diethanolamine Industry Revenue Million Forecast, by Application 2019 & 2032
- Table 114: Global Diethanolamine Industry Volume K Tons Forecast, by Application 2019 & 2032
- Table 115: Global Diethanolamine Industry Revenue Million Forecast, by End-user Industry 2019 & 2032
- Table 116: Global Diethanolamine Industry Volume K Tons Forecast, by End-user Industry 2019 & 2032
- Table 117: Global Diethanolamine Industry Revenue Million Forecast, by Country 2019 & 2032
- Table 118: Global Diethanolamine Industry Volume K Tons Forecast, by Country 2019 & 2032
- Table 119: Saudi Arabia Diethanolamine Industry Revenue (Million) Forecast, by Application 2019 & 2032
- Table 120: Saudi Arabia Diethanolamine Industry Volume (K Tons) Forecast, by Application 2019 & 2032
- Table 121: South Africa Diethanolamine Industry Revenue (Million) Forecast, by Application 2019 & 2032
- Table 122: South Africa Diethanolamine Industry Volume (K Tons) Forecast, by Application 2019 & 2032
- Table 123: Rest of Middle East and Africa Diethanolamine Industry Revenue (Million) Forecast, by Application 2019 & 2032
- Table 124: Rest of Middle East and Africa Diethanolamine Industry Volume (K Tons) Forecast, by Application 2019 & 2032
Frequently Asked Questions
1. What is the projected Compound Annual Growth Rate (CAGR) of the Diethanolamine Industry?
The projected CAGR is approximately > 5.00%.
2. Which companies are prominent players in the Diethanolamine Industry?
Key companies in the market include Sinopec, Linde PLC, Chemanol, Exxon Mobil Corporation, INEOS, Mitsubishi Chemical Corporation, Reliance Industries Limited, BASF SE, LyondellBasell Industries Holdings B V, SABIC, NIPPON SHOKUBAI CO LTD *List Not Exhaustive, LG Chem, Dow, Formosa Plastics Corporation, Air Liquide, HELM AG.
3. What are the main segments of the Diethanolamine Industry?
The market segments include Application, End-user Industry.
4. Can you provide details about the market size?
The market size is estimated to be USD 17640 Million as of 2022.
5. What are some drivers contributing to market growth?
Increasing Consumption of DEA as Herbicide in the Agricultural Industry; Increasing Construction Activities.
6. What are the notable trends driving market growth?
Increasing Demand from the Textile Industry.
7. Are there any restraints impacting market growth?
Environmental and Health Concerns; Other Restraints.
8. Can you provide examples of recent developments in the market?
February 2023: Chemanol, a Saudi Methanol Chemicals Company, signed a joint venture agreement with GDI to develop a national company to produce specialized chemicals. Chemanol will own a 60% stake in the new company. The joint venture will manufacture methyl diethanolamine, choline chloride, dimethyl disulfide, dimethyl sulfate, chlorine derivatives, poly alpha olefins, and aromatic solvents.
9. What pricing options are available for accessing the report?
Pricing options include single-user, multi-user, and enterprise licenses priced at USD 4750, USD 5250, and USD 8750 respectively.
10. Is the market size provided in terms of value or volume?
The market size is provided in terms of value, measured in Million and volume, measured in K Tons.
11. Are there any specific market keywords associated with the report?
Yes, the market keyword associated with the report is "Diethanolamine Industry," which aids in identifying and referencing the specific market segment covered.
12. How do I determine which pricing option suits my needs best?
The pricing options vary based on user requirements and access needs. Individual users may opt for single-user licenses, while businesses requiring broader access may choose multi-user or enterprise licenses for cost-effective access to the report.
13. Are there any additional resources or data provided in the Diethanolamine Industry report?
While the report offers comprehensive insights, it's advisable to review the specific contents or supplementary materials provided to ascertain if additional resources or data are available.
14. How can I stay updated on further developments or reports in the Diethanolamine Industry?
To stay informed about further developments, trends, and reports in the Diethanolamine Industry, consider subscribing to industry newsletters, following relevant companies and organizations, or regularly checking reputable industry news sources and publications.
Methodology
Step 1 - Identification of Relevant Samples Size from Population Database


Step 2 - Approaches for Defining Global Market Size (Value, Volume* & Price*)

Note*: In applicable scenarios
Step 3 - Data Sources
Primary Research
- Web Analytics
- Survey Reports
- Research Institute
- Latest Research Reports
- Opinion Leaders
Secondary Research
- Annual Reports
- White Paper
- Latest Press Release
- Industry Association
- Paid Database
- Investor Presentations

Step 4 - Data Triangulation
Involves using different sources of information in order to increase the validity of a study
These sources are likely to be stakeholders in a program - participants, other researchers, program staff, other community members, and so on.
Then we put all data in single framework & apply various statistical tools to find out the dynamic on the market.
During the analysis stage, feedback from the stakeholder groups would be compared to determine areas of agreement as well as areas of divergence


