
Key Insights
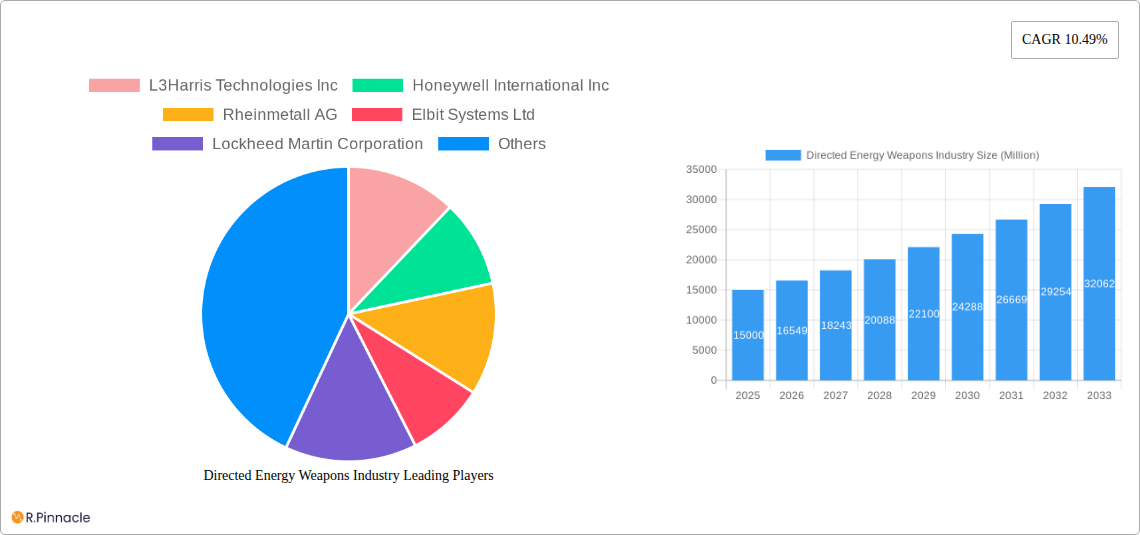
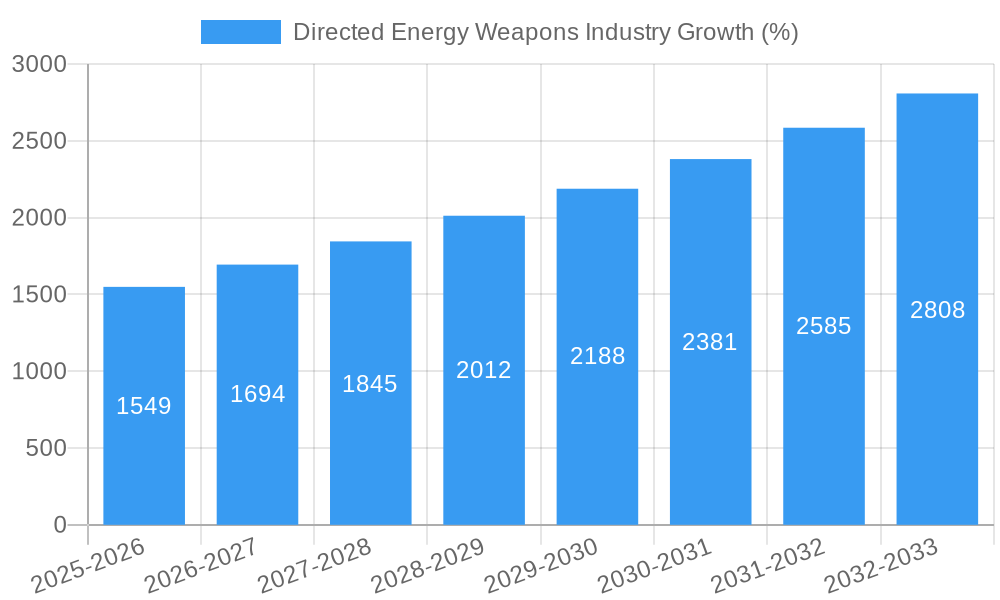
The Directed Energy Weapons (DEW) industry is experiencing robust growth, projected to maintain a Compound Annual Growth Rate (CAGR) of 10.49% from 2025 to 2033. This expansion is fueled by several key factors. Firstly, increasing geopolitical instability and the need for advanced defense systems are driving significant investment in DEW technologies. Secondly, advancements in laser and microwave technologies are leading to more powerful, precise, and cost-effective DEW systems. The development of adaptable platforms, including land, sea, and air-based deployment, further enhances the market's potential. Finally, the growing adoption of DEW systems by both military and civilian sectors contributes to the market's overall expansion. The market is segmented by weapon type (Laser, Microwave, and Other Types) and platform (Land, Sea, and Air), with Laser-based systems currently dominating due to their technological maturity and wide-ranging applications.
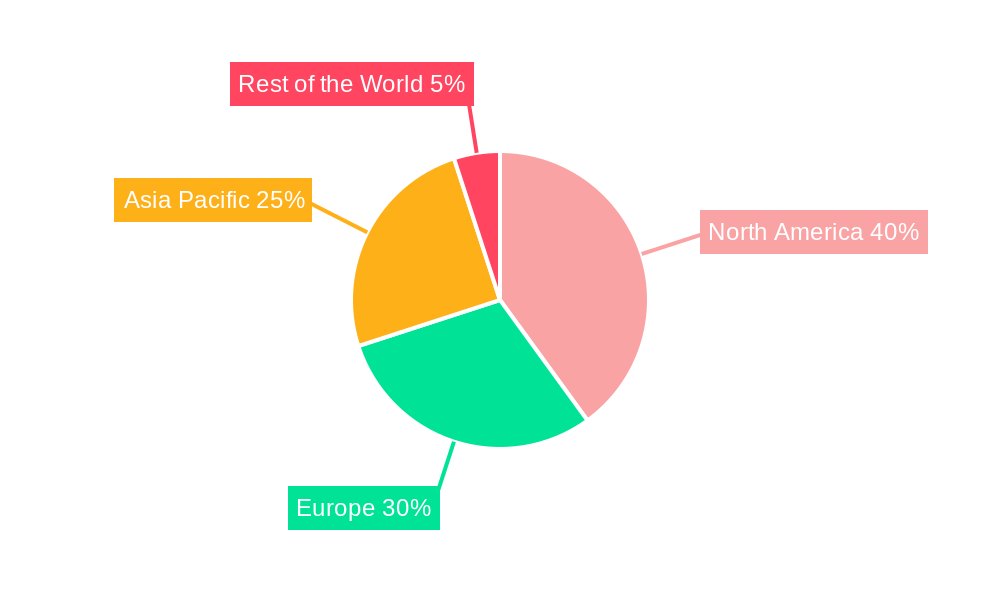
However, the market faces certain challenges. High initial investment costs associated with R&D and manufacturing can hinder wider adoption. Additionally, technological limitations, such as atmospheric effects on laser accuracy and the need for advanced power sources, represent ongoing hurdles. Despite these restraints, the long-term outlook for the DEW industry remains exceptionally positive. Continuous technological innovation, alongside increased government funding and collaborations between major defense contractors (including L3Harris Technologies Inc, Honeywell International Inc, Rheinmetall AG, Elbit Systems Ltd, Lockheed Martin Corporation, MBDA, Rafael Advanced Defense Systems Ltd, RTX Corporation, QinetiQ Group, BAE Systems plc, Northrop Grumman Corporation, and The Boeing Company), will drive market expansion and overcome present limitations. The Asia-Pacific region is expected to witness substantial growth due to rising defense budgets and increasing geopolitical tensions.
Directed Energy Weapons Industry Market Report: 2019-2033
This comprehensive report provides a detailed analysis of the Directed Energy Weapons (DEW) industry, offering invaluable insights for industry professionals, investors, and strategic decision-makers. The report covers the period 2019-2033, with a focus on the 2025-2033 forecast period. The global market is projected to reach xx Million by 2033, exhibiting a CAGR of xx% during the forecast period.
Directed Energy Weapons Industry Market Structure & Innovation Trends
The DEW market is characterized by a moderately concentrated structure, with key players like Lockheed Martin, Boeing, and Raytheon holding significant market share. However, smaller, specialized companies are also contributing significantly to innovation. Market share analysis reveals that the top 5 companies account for approximately xx% of the global market. The industry is driven by advancements in laser and microwave technologies, coupled with increasing defense budgets worldwide. Regulatory frameworks vary across nations, influencing market access and technological adoption. M&A activity is expected to increase, with deal values potentially reaching xx Million annually by 2030.
- Market Concentration: High, with a few major players dominating.
- Innovation Drivers: Advancements in laser and microwave technology, increased defense spending.
- Regulatory Frameworks: Vary significantly across regions, impacting market growth.
- Product Substitutes: Limited, mainly traditional weaponry.
- End-User Demographics: Primarily defense forces (Army, Navy, Air Force), with increasing adoption by law enforcement and cybersecurity sectors.
- M&A Activity: Expected to increase in the coming years.
Directed Energy Weapons Industry Market Dynamics & Trends
The DEW market is experiencing significant growth driven by the increasing demand for precise, non-kinetic weapons systems, capable of neutralizing threats without causing significant collateral damage. Technological disruptions in laser and microwave technologies are continually improving the effectiveness, range, and affordability of DEW systems. Consumer preferences among defense forces are shifting towards more versatile, adaptable and accurate weapon systems. Competitive dynamics are intensely focused on R&D and innovation, with companies seeking to differentiate their products through enhanced capabilities and performance.
The market is poised for continued expansion, fueled by technological breakthroughs, growing geopolitical instability, and the escalating demand for advanced defense solutions. The global market is estimated to reach xx Million by 2025 and further grow to xx Million by 2033, with a CAGR of xx% during the forecast period. Market penetration remains relatively low, but is expected to significantly increase as technologies mature and prices become more competitive.
Dominant Regions & Segments in Directed Energy Weapons Industry
The North American region, specifically the United States, currently dominates the DEW market, driven by substantial defense spending and advanced technological capabilities. However, Asia-Pacific is anticipated to witness rapid growth in the coming years, driven by increasing defense budgets and technological advancements in countries like China and India. Europe also holds a significant share, boosted by the activities of companies like Rheinmetall and MBDA.
- Leading Region: North America (primarily the US)
- Key Drivers (North America): High defense spending, advanced technological capabilities, robust R&D infrastructure.
- Key Drivers (Asia-Pacific): Rising defense budgets in China and India, technological advancements.
- Key Drivers (Europe): Strong defense industry presence, collaborative research initiatives.
- Dominant Segment (Type): Laser weapons hold the largest market share currently, driven by their precision and effectiveness.
- Dominant Segment (Platform): Air-based DEW systems are currently dominant due to their strategic advantages, although land and sea-based systems are witnessing increasing adoption.
Directed Energy Weapons Industry Product Innovations
Recent years have witnessed significant advancements in DEW technology, leading to the development of more compact, efficient, and powerful laser and microwave weapons. These innovations have enhanced the precision and effectiveness of DEW systems, while expanding their applicability across various platforms and applications. The market is witnessing a strong focus on developing integrated systems that seamlessly combine DEW capabilities with existing defense systems, thereby enhancing overall operational effectiveness. The integration of AI and machine learning is further enhancing DEW accuracy and targeting capabilities.
Report Scope & Segmentation Analysis
This report segments the DEW market based on Type (Laser, Microwave, Other Types) and Platform (Land, Sea, Air). Each segment's market size, growth projections, and competitive landscape are thoroughly analyzed. The laser segment is projected to experience the highest CAGR, driven by its precision and effectiveness. The air-based platform segment is currently dominant, but land and sea-based systems are experiencing significant growth, fueled by increasing demand for improved defense capabilities. The "other types" segment encompasses emerging technologies like particle beams, which have significant long-term growth potential, though currently the market share is minimal.
Key Drivers of Directed Energy Weapons Industry Growth
The DEW industry's growth is fueled by several key factors: the escalating need for precise, non-lethal weapons to counter emerging threats; significant increases in defense spending globally; technological advancements in laser and microwave technologies leading to increased efficiency and affordability; and growing geopolitical instability and conflicts. Favorable government policies and regulations further stimulate market growth by encouraging R&D and investment in this sector.
Challenges in the Directed Energy Weapons Industry Sector
The DEW industry faces challenges such as high development costs, technological complexity, and regulatory hurdles surrounding weapon deployment and testing. Supply chain disruptions and limitations in the availability of critical components can also impact production and delivery schedules. Intense competition from established defense contractors also poses a challenge to smaller companies entering the market. The successful integration of new technologies into existing defense systems can be complex, leading to considerable time and resource investments.
Emerging Opportunities in Directed Energy Weapons Industry
Emerging opportunities include the development of high-energy laser systems for defense applications, expansion into new markets (e.g., homeland security and law enforcement), and integration of DEW systems with autonomous platforms. The use of AI and machine learning to enhance targeting accuracy and autonomous decision-making provides another exciting opportunity. Further, the development of more compact and portable systems for diverse applications creates significant potential for market expansion.
Leading Players in the Directed Energy Weapons Industry Market
- L3Harris Technologies Inc
- Honeywell International Inc
- Rheinmetall AG
- Elbit Systems Ltd
- Lockheed Martin Corporation
- MBDA
- Rafael Advanced Defense Systems Ltd
- RTX Corporation
- QinetiQ Group
- BAE Systems plc
- Northrop Grumman Corporation
- The Boeing Company
Key Developments in Directed Energy Weapons Industry
- May 2022: Rheinmetall successfully tested a laser weapon technology demonstrator for the German Bundeswehr. This signifies a significant step towards the operational deployment of laser weapon systems.
- July 2021: The US Navy and Air Force Research Laboratory (AFRL) launched a five-year project to develop high-power microwave technology capable of disabling adversary electronics. This collaboration highlights the growing importance of directed energy weapons in modern warfare and underscores the commitment to innovation in this critical area.
Future Outlook for Directed Energy Weapons Industry Market
The DEW market is projected to experience significant growth in the coming years, driven by continuous technological advancements, increasing defense budgets, and the growing demand for precise, non-kinetic weapons. Strategic opportunities lie in developing next-generation DEW systems, focusing on increased power, efficiency, and adaptability. Further integration with other defense systems and expansion into new markets, coupled with growing partnerships and collaborations, promise substantial market expansion and accelerated growth.
Directed Energy Weapons Industry Segmentation
- 1. Production Analysis
- 2. Consumption Analysis
- 3. Import Market Analysis (Value & Volume)
- 4. Export Market Analysis (Value & Volume)
- 5. Price Trend Analysis
Directed Energy Weapons Industry Segmentation By Geography
-
1. North America
- 1.1. United States
- 1.2. Canada
- 1.3. Mexico
-
2. South America
- 2.1. Brazil
- 2.2. Argentina
- 2.3. Rest of South America
-
3. Europe
- 3.1. United Kingdom
- 3.2. Germany
- 3.3. France
- 3.4. Italy
- 3.5. Spain
- 3.6. Russia
- 3.7. Benelux
- 3.8. Nordics
- 3.9. Rest of Europe
-
4. Middle East & Africa
- 4.1. Turkey
- 4.2. Israel
- 4.3. GCC
- 4.4. North Africa
- 4.5. South Africa
- 4.6. Rest of Middle East & Africa
-
5. Asia Pacific
- 5.1. China
- 5.2. India
- 5.3. Japan
- 5.4. South Korea
- 5.5. ASEAN
- 5.6. Oceania
- 5.7. Rest of Asia Pacific
Directed Energy Weapons Industry REPORT HIGHLIGHTS
| Aspects | Details |
|---|---|
| Study Period | 2019-2033 |
| Base Year | 2024 |
| Estimated Year | 2025 |
| Forecast Period | 2025-2033 |
| Historical Period | 2019-2024 |
| Growth Rate | CAGR of 10.49% from 2019-2033 |
| Segmentation |
|
Table of Contents
- 1. Introduction
- 1.1. Research Scope
- 1.2. Market Segmentation
- 1.3. Research Methodology
- 1.4. Definitions and Assumptions
- 2. Executive Summary
- 2.1. Introduction
- 3. Market Dynamics
- 3.1. Introduction
- 3.2. Market Drivers
- 3.2.1. Increase in Internet of Things (IoT) and Autonomous Systems; Rise in Demand for Military and Defense Satellite Communication Solutions
- 3.3. Market Restrains
- 3.3.1. Cybersecurity Threats to Satellite Communication; Interference in Transmission of Data
- 3.4. Market Trends
- 3.4.1. Sea Segment Expected to WItness Rapid Growth
- 4. Market Factor Analysis
- 4.1. Porters Five Forces
- 4.2. Supply/Value Chain
- 4.3. PESTEL analysis
- 4.4. Market Entropy
- 4.5. Patent/Trademark Analysis
- 5. Global Directed Energy Weapons Industry Analysis, Insights and Forecast, 2019-2031
- 5.1. Market Analysis, Insights and Forecast - by Production Analysis
- 5.2. Market Analysis, Insights and Forecast - by Consumption Analysis
- 5.3. Market Analysis, Insights and Forecast - by Import Market Analysis (Value & Volume)
- 5.4. Market Analysis, Insights and Forecast - by Export Market Analysis (Value & Volume)
- 5.5. Market Analysis, Insights and Forecast - by Price Trend Analysis
- 5.6. Market Analysis, Insights and Forecast - by Region
- 5.6.1. North America
- 5.6.2. South America
- 5.6.3. Europe
- 5.6.4. Middle East & Africa
- 5.6.5. Asia Pacific
- 5.1. Market Analysis, Insights and Forecast - by Production Analysis
- 6. North America Directed Energy Weapons Industry Analysis, Insights and Forecast, 2019-2031
- 6.1. Market Analysis, Insights and Forecast - by Production Analysis
- 6.2. Market Analysis, Insights and Forecast - by Consumption Analysis
- 6.3. Market Analysis, Insights and Forecast - by Import Market Analysis (Value & Volume)
- 6.4. Market Analysis, Insights and Forecast - by Export Market Analysis (Value & Volume)
- 6.5. Market Analysis, Insights and Forecast - by Price Trend Analysis
- 6.1. Market Analysis, Insights and Forecast - by Production Analysis
- 7. South America Directed Energy Weapons Industry Analysis, Insights and Forecast, 2019-2031
- 7.1. Market Analysis, Insights and Forecast - by Production Analysis
- 7.2. Market Analysis, Insights and Forecast - by Consumption Analysis
- 7.3. Market Analysis, Insights and Forecast - by Import Market Analysis (Value & Volume)
- 7.4. Market Analysis, Insights and Forecast - by Export Market Analysis (Value & Volume)
- 7.5. Market Analysis, Insights and Forecast - by Price Trend Analysis
- 7.1. Market Analysis, Insights and Forecast - by Production Analysis
- 8. Europe Directed Energy Weapons Industry Analysis, Insights and Forecast, 2019-2031
- 8.1. Market Analysis, Insights and Forecast - by Production Analysis
- 8.2. Market Analysis, Insights and Forecast - by Consumption Analysis
- 8.3. Market Analysis, Insights and Forecast - by Import Market Analysis (Value & Volume)
- 8.4. Market Analysis, Insights and Forecast - by Export Market Analysis (Value & Volume)
- 8.5. Market Analysis, Insights and Forecast - by Price Trend Analysis
- 8.1. Market Analysis, Insights and Forecast - by Production Analysis
- 9. Middle East & Africa Directed Energy Weapons Industry Analysis, Insights and Forecast, 2019-2031
- 9.1. Market Analysis, Insights and Forecast - by Production Analysis
- 9.2. Market Analysis, Insights and Forecast - by Consumption Analysis
- 9.3. Market Analysis, Insights and Forecast - by Import Market Analysis (Value & Volume)
- 9.4. Market Analysis, Insights and Forecast - by Export Market Analysis (Value & Volume)
- 9.5. Market Analysis, Insights and Forecast - by Price Trend Analysis
- 9.1. Market Analysis, Insights and Forecast - by Production Analysis
- 10. Asia Pacific Directed Energy Weapons Industry Analysis, Insights and Forecast, 2019-2031
- 10.1. Market Analysis, Insights and Forecast - by Production Analysis
- 10.2. Market Analysis, Insights and Forecast - by Consumption Analysis
- 10.3. Market Analysis, Insights and Forecast - by Import Market Analysis (Value & Volume)
- 10.4. Market Analysis, Insights and Forecast - by Export Market Analysis (Value & Volume)
- 10.5. Market Analysis, Insights and Forecast - by Price Trend Analysis
- 10.1. Market Analysis, Insights and Forecast - by Production Analysis
- 11. North America Directed Energy Weapons Industry Analysis, Insights and Forecast, 2019-2031
- 11.1. Market Analysis, Insights and Forecast - By Country/Sub-region
- 11.1.1.
- 12. Europe Directed Energy Weapons Industry Analysis, Insights and Forecast, 2019-2031
- 12.1. Market Analysis, Insights and Forecast - By Country/Sub-region
- 12.1.1.
- 13. Asia Pacific Directed Energy Weapons Industry Analysis, Insights and Forecast, 2019-2031
- 13.1. Market Analysis, Insights and Forecast - By Country/Sub-region
- 13.1.1.
- 14. Rest of the World Directed Energy Weapons Industry Analysis, Insights and Forecast, 2019-2031
- 14.1. Market Analysis, Insights and Forecast - By Country/Sub-region
- 14.1.1.
- 15. Competitive Analysis
- 15.1. Global Market Share Analysis 2024
- 15.2. Company Profiles
- 15.2.1 L3Harris Technologies Inc
- 15.2.1.1. Overview
- 15.2.1.2. Products
- 15.2.1.3. SWOT Analysis
- 15.2.1.4. Recent Developments
- 15.2.1.5. Financials (Based on Availability)
- 15.2.2 Honeywell International Inc
- 15.2.2.1. Overview
- 15.2.2.2. Products
- 15.2.2.3. SWOT Analysis
- 15.2.2.4. Recent Developments
- 15.2.2.5. Financials (Based on Availability)
- 15.2.3 Rheinmetall AG
- 15.2.3.1. Overview
- 15.2.3.2. Products
- 15.2.3.3. SWOT Analysis
- 15.2.3.4. Recent Developments
- 15.2.3.5. Financials (Based on Availability)
- 15.2.4 Elbit Systems Ltd
- 15.2.4.1. Overview
- 15.2.4.2. Products
- 15.2.4.3. SWOT Analysis
- 15.2.4.4. Recent Developments
- 15.2.4.5. Financials (Based on Availability)
- 15.2.5 Lockheed Martin Corporation
- 15.2.5.1. Overview
- 15.2.5.2. Products
- 15.2.5.3. SWOT Analysis
- 15.2.5.4. Recent Developments
- 15.2.5.5. Financials (Based on Availability)
- 15.2.6 MBDA
- 15.2.6.1. Overview
- 15.2.6.2. Products
- 15.2.6.3. SWOT Analysis
- 15.2.6.4. Recent Developments
- 15.2.6.5. Financials (Based on Availability)
- 15.2.7 Rafael Advanced Defense Systems Ltd
- 15.2.7.1. Overview
- 15.2.7.2. Products
- 15.2.7.3. SWOT Analysis
- 15.2.7.4. Recent Developments
- 15.2.7.5. Financials (Based on Availability)
- 15.2.8 RTX Corporation
- 15.2.8.1. Overview
- 15.2.8.2. Products
- 15.2.8.3. SWOT Analysis
- 15.2.8.4. Recent Developments
- 15.2.8.5. Financials (Based on Availability)
- 15.2.9 QinetiQ Grou
- 15.2.9.1. Overview
- 15.2.9.2. Products
- 15.2.9.3. SWOT Analysis
- 15.2.9.4. Recent Developments
- 15.2.9.5. Financials (Based on Availability)
- 15.2.10 BAE Systems plc
- 15.2.10.1. Overview
- 15.2.10.2. Products
- 15.2.10.3. SWOT Analysis
- 15.2.10.4. Recent Developments
- 15.2.10.5. Financials (Based on Availability)
- 15.2.11 Northrop Grumman Corporation
- 15.2.11.1. Overview
- 15.2.11.2. Products
- 15.2.11.3. SWOT Analysis
- 15.2.11.4. Recent Developments
- 15.2.11.5. Financials (Based on Availability)
- 15.2.12 The Boeing Company
- 15.2.12.1. Overview
- 15.2.12.2. Products
- 15.2.12.3. SWOT Analysis
- 15.2.12.4. Recent Developments
- 15.2.12.5. Financials (Based on Availability)
- 15.2.1 L3Harris Technologies Inc
List of Figures
- Figure 1: Global Directed Energy Weapons Industry Revenue Breakdown (Million, %) by Region 2024 & 2032
- Figure 2: North America Directed Energy Weapons Industry Revenue (Million), by Country 2024 & 2032
- Figure 3: North America Directed Energy Weapons Industry Revenue Share (%), by Country 2024 & 2032
- Figure 4: Europe Directed Energy Weapons Industry Revenue (Million), by Country 2024 & 2032
- Figure 5: Europe Directed Energy Weapons Industry Revenue Share (%), by Country 2024 & 2032
- Figure 6: Asia Pacific Directed Energy Weapons Industry Revenue (Million), by Country 2024 & 2032
- Figure 7: Asia Pacific Directed Energy Weapons Industry Revenue Share (%), by Country 2024 & 2032
- Figure 8: Rest of the World Directed Energy Weapons Industry Revenue (Million), by Country 2024 & 2032
- Figure 9: Rest of the World Directed Energy Weapons Industry Revenue Share (%), by Country 2024 & 2032
- Figure 10: North America Directed Energy Weapons Industry Revenue (Million), by Production Analysis 2024 & 2032
- Figure 11: North America Directed Energy Weapons Industry Revenue Share (%), by Production Analysis 2024 & 2032
- Figure 12: North America Directed Energy Weapons Industry Revenue (Million), by Consumption Analysis 2024 & 2032
- Figure 13: North America Directed Energy Weapons Industry Revenue Share (%), by Consumption Analysis 2024 & 2032
- Figure 14: North America Directed Energy Weapons Industry Revenue (Million), by Import Market Analysis (Value & Volume) 2024 & 2032
- Figure 15: North America Directed Energy Weapons Industry Revenue Share (%), by Import Market Analysis (Value & Volume) 2024 & 2032
- Figure 16: North America Directed Energy Weapons Industry Revenue (Million), by Export Market Analysis (Value & Volume) 2024 & 2032
- Figure 17: North America Directed Energy Weapons Industry Revenue Share (%), by Export Market Analysis (Value & Volume) 2024 & 2032
- Figure 18: North America Directed Energy Weapons Industry Revenue (Million), by Price Trend Analysis 2024 & 2032
- Figure 19: North America Directed Energy Weapons Industry Revenue Share (%), by Price Trend Analysis 2024 & 2032
- Figure 20: North America Directed Energy Weapons Industry Revenue (Million), by Country 2024 & 2032
- Figure 21: North America Directed Energy Weapons Industry Revenue Share (%), by Country 2024 & 2032
- Figure 22: South America Directed Energy Weapons Industry Revenue (Million), by Production Analysis 2024 & 2032
- Figure 23: South America Directed Energy Weapons Industry Revenue Share (%), by Production Analysis 2024 & 2032
- Figure 24: South America Directed Energy Weapons Industry Revenue (Million), by Consumption Analysis 2024 & 2032
- Figure 25: South America Directed Energy Weapons Industry Revenue Share (%), by Consumption Analysis 2024 & 2032
- Figure 26: South America Directed Energy Weapons Industry Revenue (Million), by Import Market Analysis (Value & Volume) 2024 & 2032
- Figure 27: South America Directed Energy Weapons Industry Revenue Share (%), by Import Market Analysis (Value & Volume) 2024 & 2032
- Figure 28: South America Directed Energy Weapons Industry Revenue (Million), by Export Market Analysis (Value & Volume) 2024 & 2032
- Figure 29: South America Directed Energy Weapons Industry Revenue Share (%), by Export Market Analysis (Value & Volume) 2024 & 2032
- Figure 30: South America Directed Energy Weapons Industry Revenue (Million), by Price Trend Analysis 2024 & 2032
- Figure 31: South America Directed Energy Weapons Industry Revenue Share (%), by Price Trend Analysis 2024 & 2032
- Figure 32: South America Directed Energy Weapons Industry Revenue (Million), by Country 2024 & 2032
- Figure 33: South America Directed Energy Weapons Industry Revenue Share (%), by Country 2024 & 2032
- Figure 34: Europe Directed Energy Weapons Industry Revenue (Million), by Production Analysis 2024 & 2032
- Figure 35: Europe Directed Energy Weapons Industry Revenue Share (%), by Production Analysis 2024 & 2032
- Figure 36: Europe Directed Energy Weapons Industry Revenue (Million), by Consumption Analysis 2024 & 2032
- Figure 37: Europe Directed Energy Weapons Industry Revenue Share (%), by Consumption Analysis 2024 & 2032
- Figure 38: Europe Directed Energy Weapons Industry Revenue (Million), by Import Market Analysis (Value & Volume) 2024 & 2032
- Figure 39: Europe Directed Energy Weapons Industry Revenue Share (%), by Import Market Analysis (Value & Volume) 2024 & 2032
- Figure 40: Europe Directed Energy Weapons Industry Revenue (Million), by Export Market Analysis (Value & Volume) 2024 & 2032
- Figure 41: Europe Directed Energy Weapons Industry Revenue Share (%), by Export Market Analysis (Value & Volume) 2024 & 2032
- Figure 42: Europe Directed Energy Weapons Industry Revenue (Million), by Price Trend Analysis 2024 & 2032
- Figure 43: Europe Directed Energy Weapons Industry Revenue Share (%), by Price Trend Analysis 2024 & 2032
- Figure 44: Europe Directed Energy Weapons Industry Revenue (Million), by Country 2024 & 2032
- Figure 45: Europe Directed Energy Weapons Industry Revenue Share (%), by Country 2024 & 2032
- Figure 46: Middle East & Africa Directed Energy Weapons Industry Revenue (Million), by Production Analysis 2024 & 2032
- Figure 47: Middle East & Africa Directed Energy Weapons Industry Revenue Share (%), by Production Analysis 2024 & 2032
- Figure 48: Middle East & Africa Directed Energy Weapons Industry Revenue (Million), by Consumption Analysis 2024 & 2032
- Figure 49: Middle East & Africa Directed Energy Weapons Industry Revenue Share (%), by Consumption Analysis 2024 & 2032
- Figure 50: Middle East & Africa Directed Energy Weapons Industry Revenue (Million), by Import Market Analysis (Value & Volume) 2024 & 2032
- Figure 51: Middle East & Africa Directed Energy Weapons Industry Revenue Share (%), by Import Market Analysis (Value & Volume) 2024 & 2032
- Figure 52: Middle East & Africa Directed Energy Weapons Industry Revenue (Million), by Export Market Analysis (Value & Volume) 2024 & 2032
- Figure 53: Middle East & Africa Directed Energy Weapons Industry Revenue Share (%), by Export Market Analysis (Value & Volume) 2024 & 2032
- Figure 54: Middle East & Africa Directed Energy Weapons Industry Revenue (Million), by Price Trend Analysis 2024 & 2032
- Figure 55: Middle East & Africa Directed Energy Weapons Industry Revenue Share (%), by Price Trend Analysis 2024 & 2032
- Figure 56: Middle East & Africa Directed Energy Weapons Industry Revenue (Million), by Country 2024 & 2032
- Figure 57: Middle East & Africa Directed Energy Weapons Industry Revenue Share (%), by Country 2024 & 2032
- Figure 58: Asia Pacific Directed Energy Weapons Industry Revenue (Million), by Production Analysis 2024 & 2032
- Figure 59: Asia Pacific Directed Energy Weapons Industry Revenue Share (%), by Production Analysis 2024 & 2032
- Figure 60: Asia Pacific Directed Energy Weapons Industry Revenue (Million), by Consumption Analysis 2024 & 2032
- Figure 61: Asia Pacific Directed Energy Weapons Industry Revenue Share (%), by Consumption Analysis 2024 & 2032
- Figure 62: Asia Pacific Directed Energy Weapons Industry Revenue (Million), by Import Market Analysis (Value & Volume) 2024 & 2032
- Figure 63: Asia Pacific Directed Energy Weapons Industry Revenue Share (%), by Import Market Analysis (Value & Volume) 2024 & 2032
- Figure 64: Asia Pacific Directed Energy Weapons Industry Revenue (Million), by Export Market Analysis (Value & Volume) 2024 & 2032
- Figure 65: Asia Pacific Directed Energy Weapons Industry Revenue Share (%), by Export Market Analysis (Value & Volume) 2024 & 2032
- Figure 66: Asia Pacific Directed Energy Weapons Industry Revenue (Million), by Price Trend Analysis 2024 & 2032
- Figure 67: Asia Pacific Directed Energy Weapons Industry Revenue Share (%), by Price Trend Analysis 2024 & 2032
- Figure 68: Asia Pacific Directed Energy Weapons Industry Revenue (Million), by Country 2024 & 2032
- Figure 69: Asia Pacific Directed Energy Weapons Industry Revenue Share (%), by Country 2024 & 2032
List of Tables
- Table 1: Global Directed Energy Weapons Industry Revenue Million Forecast, by Region 2019 & 2032
- Table 2: Global Directed Energy Weapons Industry Revenue Million Forecast, by Production Analysis 2019 & 2032
- Table 3: Global Directed Energy Weapons Industry Revenue Million Forecast, by Consumption Analysis 2019 & 2032
- Table 4: Global Directed Energy Weapons Industry Revenue Million Forecast, by Import Market Analysis (Value & Volume) 2019 & 2032
- Table 5: Global Directed Energy Weapons Industry Revenue Million Forecast, by Export Market Analysis (Value & Volume) 2019 & 2032
- Table 6: Global Directed Energy Weapons Industry Revenue Million Forecast, by Price Trend Analysis 2019 & 2032
- Table 7: Global Directed Energy Weapons Industry Revenue Million Forecast, by Region 2019 & 2032
- Table 8: Global Directed Energy Weapons Industry Revenue Million Forecast, by Country 2019 & 2032
- Table 9: Directed Energy Weapons Industry Revenue (Million) Forecast, by Application 2019 & 2032
- Table 10: Global Directed Energy Weapons Industry Revenue Million Forecast, by Country 2019 & 2032
- Table 11: Directed Energy Weapons Industry Revenue (Million) Forecast, by Application 2019 & 2032
- Table 12: Global Directed Energy Weapons Industry Revenue Million Forecast, by Country 2019 & 2032
- Table 13: Directed Energy Weapons Industry Revenue (Million) Forecast, by Application 2019 & 2032
- Table 14: Global Directed Energy Weapons Industry Revenue Million Forecast, by Country 2019 & 2032
- Table 15: Directed Energy Weapons Industry Revenue (Million) Forecast, by Application 2019 & 2032
- Table 16: Global Directed Energy Weapons Industry Revenue Million Forecast, by Production Analysis 2019 & 2032
- Table 17: Global Directed Energy Weapons Industry Revenue Million Forecast, by Consumption Analysis 2019 & 2032
- Table 18: Global Directed Energy Weapons Industry Revenue Million Forecast, by Import Market Analysis (Value & Volume) 2019 & 2032
- Table 19: Global Directed Energy Weapons Industry Revenue Million Forecast, by Export Market Analysis (Value & Volume) 2019 & 2032
- Table 20: Global Directed Energy Weapons Industry Revenue Million Forecast, by Price Trend Analysis 2019 & 2032
- Table 21: Global Directed Energy Weapons Industry Revenue Million Forecast, by Country 2019 & 2032
- Table 22: United States Directed Energy Weapons Industry Revenue (Million) Forecast, by Application 2019 & 2032
- Table 23: Canada Directed Energy Weapons Industry Revenue (Million) Forecast, by Application 2019 & 2032
- Table 24: Mexico Directed Energy Weapons Industry Revenue (Million) Forecast, by Application 2019 & 2032
- Table 25: Global Directed Energy Weapons Industry Revenue Million Forecast, by Production Analysis 2019 & 2032
- Table 26: Global Directed Energy Weapons Industry Revenue Million Forecast, by Consumption Analysis 2019 & 2032
- Table 27: Global Directed Energy Weapons Industry Revenue Million Forecast, by Import Market Analysis (Value & Volume) 2019 & 2032
- Table 28: Global Directed Energy Weapons Industry Revenue Million Forecast, by Export Market Analysis (Value & Volume) 2019 & 2032
- Table 29: Global Directed Energy Weapons Industry Revenue Million Forecast, by Price Trend Analysis 2019 & 2032
- Table 30: Global Directed Energy Weapons Industry Revenue Million Forecast, by Country 2019 & 2032
- Table 31: Brazil Directed Energy Weapons Industry Revenue (Million) Forecast, by Application 2019 & 2032
- Table 32: Argentina Directed Energy Weapons Industry Revenue (Million) Forecast, by Application 2019 & 2032
- Table 33: Rest of South America Directed Energy Weapons Industry Revenue (Million) Forecast, by Application 2019 & 2032
- Table 34: Global Directed Energy Weapons Industry Revenue Million Forecast, by Production Analysis 2019 & 2032
- Table 35: Global Directed Energy Weapons Industry Revenue Million Forecast, by Consumption Analysis 2019 & 2032
- Table 36: Global Directed Energy Weapons Industry Revenue Million Forecast, by Import Market Analysis (Value & Volume) 2019 & 2032
- Table 37: Global Directed Energy Weapons Industry Revenue Million Forecast, by Export Market Analysis (Value & Volume) 2019 & 2032
- Table 38: Global Directed Energy Weapons Industry Revenue Million Forecast, by Price Trend Analysis 2019 & 2032
- Table 39: Global Directed Energy Weapons Industry Revenue Million Forecast, by Country 2019 & 2032
- Table 40: United Kingdom Directed Energy Weapons Industry Revenue (Million) Forecast, by Application 2019 & 2032
- Table 41: Germany Directed Energy Weapons Industry Revenue (Million) Forecast, by Application 2019 & 2032
- Table 42: France Directed Energy Weapons Industry Revenue (Million) Forecast, by Application 2019 & 2032
- Table 43: Italy Directed Energy Weapons Industry Revenue (Million) Forecast, by Application 2019 & 2032
- Table 44: Spain Directed Energy Weapons Industry Revenue (Million) Forecast, by Application 2019 & 2032
- Table 45: Russia Directed Energy Weapons Industry Revenue (Million) Forecast, by Application 2019 & 2032
- Table 46: Benelux Directed Energy Weapons Industry Revenue (Million) Forecast, by Application 2019 & 2032
- Table 47: Nordics Directed Energy Weapons Industry Revenue (Million) Forecast, by Application 2019 & 2032
- Table 48: Rest of Europe Directed Energy Weapons Industry Revenue (Million) Forecast, by Application 2019 & 2032
- Table 49: Global Directed Energy Weapons Industry Revenue Million Forecast, by Production Analysis 2019 & 2032
- Table 50: Global Directed Energy Weapons Industry Revenue Million Forecast, by Consumption Analysis 2019 & 2032
- Table 51: Global Directed Energy Weapons Industry Revenue Million Forecast, by Import Market Analysis (Value & Volume) 2019 & 2032
- Table 52: Global Directed Energy Weapons Industry Revenue Million Forecast, by Export Market Analysis (Value & Volume) 2019 & 2032
- Table 53: Global Directed Energy Weapons Industry Revenue Million Forecast, by Price Trend Analysis 2019 & 2032
- Table 54: Global Directed Energy Weapons Industry Revenue Million Forecast, by Country 2019 & 2032
- Table 55: Turkey Directed Energy Weapons Industry Revenue (Million) Forecast, by Application 2019 & 2032
- Table 56: Israel Directed Energy Weapons Industry Revenue (Million) Forecast, by Application 2019 & 2032
- Table 57: GCC Directed Energy Weapons Industry Revenue (Million) Forecast, by Application 2019 & 2032
- Table 58: North Africa Directed Energy Weapons Industry Revenue (Million) Forecast, by Application 2019 & 2032
- Table 59: South Africa Directed Energy Weapons Industry Revenue (Million) Forecast, by Application 2019 & 2032
- Table 60: Rest of Middle East & Africa Directed Energy Weapons Industry Revenue (Million) Forecast, by Application 2019 & 2032
- Table 61: Global Directed Energy Weapons Industry Revenue Million Forecast, by Production Analysis 2019 & 2032
- Table 62: Global Directed Energy Weapons Industry Revenue Million Forecast, by Consumption Analysis 2019 & 2032
- Table 63: Global Directed Energy Weapons Industry Revenue Million Forecast, by Import Market Analysis (Value & Volume) 2019 & 2032
- Table 64: Global Directed Energy Weapons Industry Revenue Million Forecast, by Export Market Analysis (Value & Volume) 2019 & 2032
- Table 65: Global Directed Energy Weapons Industry Revenue Million Forecast, by Price Trend Analysis 2019 & 2032
- Table 66: Global Directed Energy Weapons Industry Revenue Million Forecast, by Country 2019 & 2032
- Table 67: China Directed Energy Weapons Industry Revenue (Million) Forecast, by Application 2019 & 2032
- Table 68: India Directed Energy Weapons Industry Revenue (Million) Forecast, by Application 2019 & 2032
- Table 69: Japan Directed Energy Weapons Industry Revenue (Million) Forecast, by Application 2019 & 2032
- Table 70: South Korea Directed Energy Weapons Industry Revenue (Million) Forecast, by Application 2019 & 2032
- Table 71: ASEAN Directed Energy Weapons Industry Revenue (Million) Forecast, by Application 2019 & 2032
- Table 72: Oceania Directed Energy Weapons Industry Revenue (Million) Forecast, by Application 2019 & 2032
- Table 73: Rest of Asia Pacific Directed Energy Weapons Industry Revenue (Million) Forecast, by Application 2019 & 2032
Frequently Asked Questions
1. What is the projected Compound Annual Growth Rate (CAGR) of the Directed Energy Weapons Industry?
The projected CAGR is approximately 10.49%.
2. Which companies are prominent players in the Directed Energy Weapons Industry?
Key companies in the market include L3Harris Technologies Inc, Honeywell International Inc, Rheinmetall AG, Elbit Systems Ltd, Lockheed Martin Corporation, MBDA, Rafael Advanced Defense Systems Ltd, RTX Corporation, QinetiQ Grou, BAE Systems plc, Northrop Grumman Corporation, The Boeing Company.
3. What are the main segments of the Directed Energy Weapons Industry?
The market segments include Production Analysis, Consumption Analysis, Import Market Analysis (Value & Volume), Export Market Analysis (Value & Volume), Price Trend Analysis.
4. Can you provide details about the market size?
The market size is estimated to be USD XX Million as of 2022.
5. What are some drivers contributing to market growth?
Increase in Internet of Things (IoT) and Autonomous Systems; Rise in Demand for Military and Defense Satellite Communication Solutions.
6. What are the notable trends driving market growth?
Sea Segment Expected to WItness Rapid Growth.
7. Are there any restraints impacting market growth?
Cybersecurity Threats to Satellite Communication; Interference in Transmission of Data.
8. Can you provide examples of recent developments in the market?
May 2022: Rheinmetall announced that it had successfully tested the laser weapon technology demonstrator version built on behalf of the German Bundeswehr forces.
9. What pricing options are available for accessing the report?
Pricing options include single-user, multi-user, and enterprise licenses priced at USD 4750, USD 5250, and USD 8750 respectively.
10. Is the market size provided in terms of value or volume?
The market size is provided in terms of value, measured in Million.
11. Are there any specific market keywords associated with the report?
Yes, the market keyword associated with the report is "Directed Energy Weapons Industry," which aids in identifying and referencing the specific market segment covered.
12. How do I determine which pricing option suits my needs best?
The pricing options vary based on user requirements and access needs. Individual users may opt for single-user licenses, while businesses requiring broader access may choose multi-user or enterprise licenses for cost-effective access to the report.
13. Are there any additional resources or data provided in the Directed Energy Weapons Industry report?
While the report offers comprehensive insights, it's advisable to review the specific contents or supplementary materials provided to ascertain if additional resources or data are available.
14. How can I stay updated on further developments or reports in the Directed Energy Weapons Industry?
To stay informed about further developments, trends, and reports in the Directed Energy Weapons Industry, consider subscribing to industry newsletters, following relevant companies and organizations, or regularly checking reputable industry news sources and publications.
Methodology
Step 1 - Identification of Relevant Samples Size from Population Database


Step 2 - Approaches for Defining Global Market Size (Value, Volume* & Price*)

Note*: In applicable scenarios
Step 3 - Data Sources
Primary Research
- Web Analytics
- Survey Reports
- Research Institute
- Latest Research Reports
- Opinion Leaders
Secondary Research
- Annual Reports
- White Paper
- Latest Press Release
- Industry Association
- Paid Database
- Investor Presentations

Step 4 - Data Triangulation
Involves using different sources of information in order to increase the validity of a study
These sources are likely to be stakeholders in a program - participants, other researchers, program staff, other community members, and so on.
Then we put all data in single framework & apply various statistical tools to find out the dynamic on the market.
During the analysis stage, feedback from the stakeholder groups would be compared to determine areas of agreement as well as areas of divergence


