
Key Insights
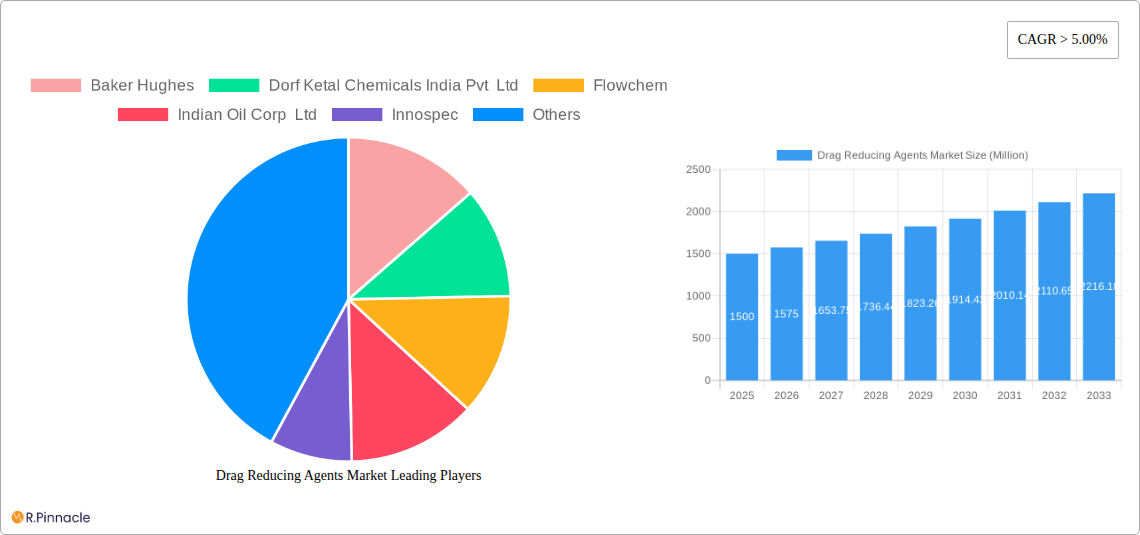
The Drag Reducing Agents (DRA) market is experiencing robust growth, projected to maintain a CAGR exceeding 5% from 2025 to 2033. This expansion is fueled by several key factors. The increasing demand for efficient oil and gas extraction, coupled with a global push for enhanced energy efficiency across various industries, is driving adoption. Technological advancements leading to the development of more effective and environmentally friendly DRAs are also contributing significantly. Furthermore, stringent regulations aimed at reducing pipeline friction losses and minimizing energy consumption are incentivizing the wider application of these agents. The market is segmented by type (polymeric, surfactant-based, etc.), application (oil and gas pipelines, water pipelines, etc.), and region. While precise market segmentation data is unavailable, we can infer that the oil and gas sector currently dominates, given its high energy consumption and lengthy pipeline networks. However, growing applications in water transportation and other industrial sectors are expected to diversify the market in the coming years. Leading players such as Baker Hughes, Dorf Ketal Chemicals, and others are actively investing in research and development, expanding their product portfolios, and pursuing strategic partnerships to maintain a competitive edge.
The competitive landscape is characterized by both large multinational corporations and smaller specialized chemical manufacturers. While specific market share data is unavailable, the presence of established players like Baker Hughes and Indian Oil Corp Ltd indicates a mature market with significant investment and technological capabilities. However, smaller, innovative companies are also making inroads, offering specialized solutions and focusing on niche applications. Challenges for market expansion could include fluctuating raw material prices and the potential for regulatory changes affecting the use of certain DRA chemistries. The overall outlook for the DRA market remains positive, supported by continuous technological innovation, sustainable practices, and the ongoing need for efficient fluid transportation across various industries. Future growth will likely be determined by the ongoing balance between innovation, regulatory frameworks, and the evolving needs of key end-use sectors.
Drag Reducing Agents Market Report: 2019-2033 Forecast
This comprehensive report provides an in-depth analysis of the Drag Reducing Agents (DRA) market, offering invaluable insights for industry professionals, investors, and stakeholders. Covering the period 2019-2033, with a focus on 2025, this study meticulously examines market dynamics, technological advancements, competitive landscapes, and future growth potential. The report is meticulously structured to deliver actionable intelligence, enabling informed decision-making.
Drag Reducing Agents Market Structure & Innovation Trends
The Drag Reducing Agents market exhibits a moderately concentrated structure, with key players such as Baker Hughes, Dorf Ketal Chemicals India Pvt Ltd, Flowchem, Indian Oil Corp Ltd, Innospec, Jiangyin Huaheng Auxiliary Co Ltd, LiquidPower Specialty Products Inc, NuGenTec, Oil Flux Americas, and The Zoranoc Oilfield Chemical holding significant market share. However, the market also accommodates several smaller, specialized players. Precise market share figures for each company are not publicly available and require further research; however, we can estimate xx% for the top 5 players collectively.
Innovation within the DRA market is driven by the need for enhanced efficiency in various industries, including oil & gas, water management, and chemical processing. Stringent environmental regulations, particularly concerning the reduction of carbon emissions associated with fluid transport, are significant catalysts. The development of bio-based and environmentally friendly DRA alternatives is a key area of focus.
Mergers and acquisitions (M&A) activities play a considerable role in shaping the market landscape. For example, the August 2022 acquisition of Quest Integrity by Baker Hughes significantly strengthened Baker Hughes' position in pipeline inspection, directly impacting the DRA market due to increased demand for drag reduction solutions in pipeline maintenance and optimization. The estimated deal value for such acquisitions typically falls within the range of xx Million to xx Million. Further research is required to determine the exact value of this and other M&A activities in the DRA market.
- Market Concentration: Moderately concentrated.
- Innovation Drivers: Enhanced efficiency, environmental regulations, bio-based alternatives.
- Regulatory Frameworks: Stringent environmental regulations impacting material selection and production processes.
- Product Substitutes: Limited viable substitutes exist, but research into alternative technologies is ongoing.
- End-User Demographics: Primarily industrial, with a focus on oil & gas, water management, and chemical processing sectors.
- M&A Activities: Significant influence on market share and technological capabilities, with deal values ranging from xx Million to xx Million.
Drag Reducing Agents Market Dynamics & Trends
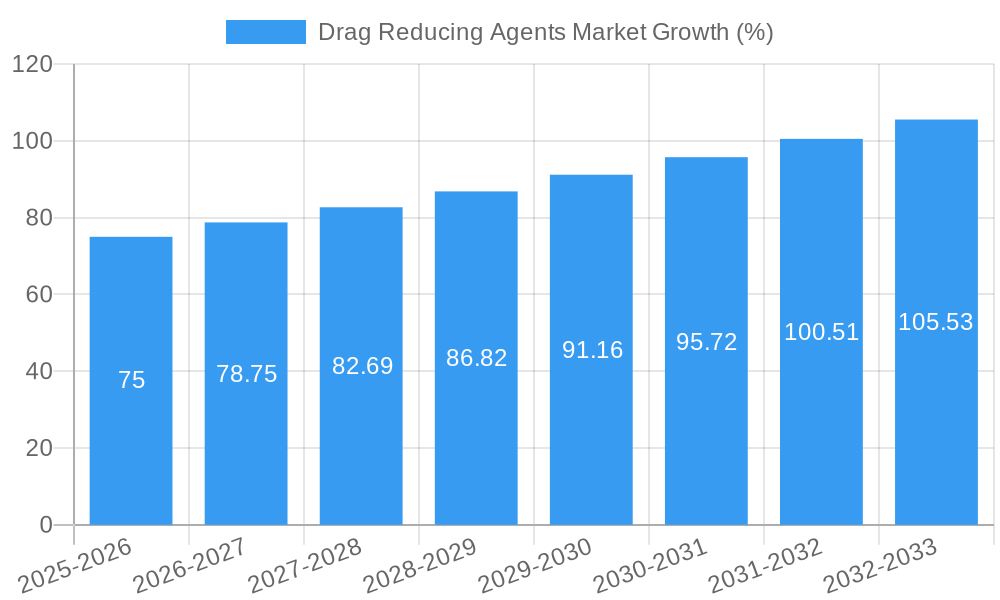
The global Drag Reducing Agents market is experiencing substantial growth, driven by the increasing demand for efficient fluid transportation across various industries. The market is projected to witness a Compound Annual Growth Rate (CAGR) of xx% during the forecast period (2025-2033). This robust growth is fueled by several factors:
- Expanding Oil & Gas Exploration: The continuous expansion of offshore and deepwater oil and gas operations necessitates the use of DRA to optimize pipeline efficiency and reduce energy consumption.
- Technological Advancements: Development of high-performance, environmentally friendly DRAs enhances market appeal and expands application scope.
- Stringent Environmental Regulations: Governments worldwide are enacting stricter environmental norms, driving the adoption of efficient and sustainable DRA solutions.
- Rising Energy Costs: The increasing cost of energy compels industries to seek cost-effective solutions, with DRAs offering a means to reduce energy consumption in fluid transport.
- Infrastructure Development: Ongoing infrastructure development projects in various sectors boost demand for DRAs in pipeline and conduit systems. The market penetration rate for DRA is steadily increasing, currently estimated at xx%, with projections to reach xx% by 2033.
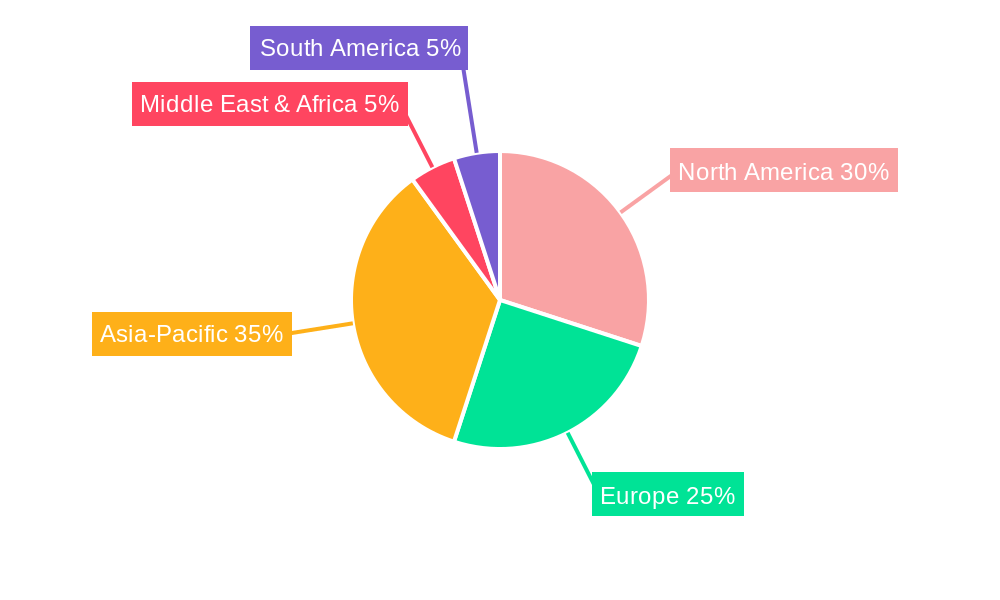
Dominant Regions & Segments in Drag Reducing Agents Market
The North American region currently holds a dominant position in the global Drag Reducing Agents market, primarily due to the significant presence of major oil & gas companies and robust infrastructure. However, the Asia-Pacific region is poised for significant growth owing to substantial investments in infrastructure development and increasing industrial activity.
- Key Drivers in North America:
- Well-established oil and gas industry.
- Advanced pipeline infrastructure.
- Stringent environmental regulations driving innovation.
- Key Drivers in Asia-Pacific:
- Rapid industrialization and infrastructure development.
- Rising energy demand.
- Growing awareness of environmental sustainability.
Drag Reducing Agents Market Product Innovations
Recent innovations in the DRA market focus on the development of environmentally friendly, high-performance polymers and additives. These new DRAs aim to improve efficiency, reduce friction losses, and minimize environmental impact. The introduction of bio-based DRAs is a notable trend, addressing concerns about sustainability and reducing the carbon footprint of fluid transport systems. This addresses a critical market need for eco-conscious solutions while maintaining or improving performance compared to traditional options.
Report Scope & Segmentation Analysis
This report comprehensively segments the Drag Reducing Agents market based on several key parameters:
- By Type: This section details the market share and growth projections for different types of DRAs, including polymer-based, surfactant-based, and others. The polymer-based segment currently holds a significant market share, driven by its superior performance.
- By Application: The report analyzes market size and growth across various applications, including oil & gas, water management, and chemical processing. The oil & gas sector currently dominates the application segment, but other sectors are showing promising growth.
- By Region: The market is segmented by region, providing a detailed analysis of growth drivers and market dynamics in each region.
Key Drivers of Drag Reducing Agents Market Growth
The growth of the DRA market is primarily driven by the increasing need for efficient fluid transportation across various industries. Rising energy costs and stringent environmental regulations are compelling industries to adopt energy-efficient solutions. Furthermore, technological advancements leading to the development of high-performance, eco-friendly DRAs contribute to the market's expansion. The ongoing expansion of oil & gas exploration and production further fuels demand.
Challenges in the Drag Reducing Agents Market Sector
The DRA market faces challenges such as fluctuating raw material prices, which directly impact production costs. The industry also contends with the development of alternative technologies and stringent environmental regulations, requiring ongoing innovation and compliance efforts. Maintaining a balance between cost-effectiveness and environmental sustainability poses a considerable challenge to market players.
Emerging Opportunities in Drag Reducing Agents Market
Emerging opportunities include the expansion into new applications such as water management and enhanced oil recovery. The development of bio-based and biodegradable DRAs presents a significant growth avenue, aligning with the global push for sustainability. Further research and development into advanced polymer chemistries promise even higher performing and cost-effective DRAs.
Leading Players in the Drag Reducing Agents Market
- Baker Hughes
- Dorf Ketal Chemicals India Pvt Ltd
- Flowchem
- Indian Oil Corp Ltd
- Innospec
- Jiangyin Huaheng Auxiliary Co Ltd
- LiquidPower Specialty Products Inc
- NuGenTec
- Oil Flux Americas
- The Zoranoc Oilfield Chemical
Key Developments in Drag Reducing Agents Market Industry
- August 2022: Baker Hughes acquired Quest Integrity, enhancing its pipeline inspection capabilities and indirectly boosting demand for DRAs in pipeline optimization.
- October 2021: LiquidPower Specialty Products Inc. partnered with Safe Marine Transfer, LLC, expanding the application of DRAs into subsea operations.
Future Outlook for Drag Reducing Agents Market
The Drag Reducing Agents market is poised for continued growth, driven by sustained demand from the oil & gas sector, alongside expansion into new applications. Technological advancements and a growing focus on sustainability will shape the market's future trajectory, creating opportunities for innovation and expansion for market players. The market is expected to experience substantial growth, particularly in emerging economies, driven by increased industrialization and infrastructure development.
Drag Reducing Agents Market Segmentation
-
1. Application
- 1.1. Low- and Medium-phase Crude Oil
- 1.2. Heavy/Asphaltic Crude
- 1.3. Multiphase Fluid
- 1.4. Refined Products
- 1.5. Other Applications
Drag Reducing Agents Market Segmentation By Geography
-
1. Asia Pacific
- 1.1. China
- 1.2. India
- 1.3. Japan
- 1.4. South Korea
- 1.5. Rest of Asia Pacific
-
2. North America
- 2.1. United States
- 2.2. Canada
- 2.3. Mexico
-
3. Europe
- 3.1. Germany
- 3.2. United Kingdom
- 3.3. France
- 3.4. Italy
- 3.5. Rest of Europe
-
4. South America
- 4.1. Brazil
- 4.2. Argentina
- 4.3. Rest of South America
-
5. Middle East and Africa
- 5.1. South Africa
- 5.2. Saudi Arabia
- 5.3. Rest of Middle East and Africa
Drag Reducing Agents Market REPORT HIGHLIGHTS
| Aspects | Details |
|---|---|
| Study Period | 2019-2033 |
| Base Year | 2024 |
| Estimated Year | 2025 |
| Forecast Period | 2025-2033 |
| Historical Period | 2019-2024 |
| Growth Rate | CAGR of > 5.00% from 2019-2033 |
| Segmentation |
|
Table of Contents
- 1. Introduction
- 1.1. Research Scope
- 1.2. Market Segmentation
- 1.3. Research Methodology
- 1.4. Definitions and Assumptions
- 2. Executive Summary
- 2.1. Introduction
- 3. Market Dynamics
- 3.1. Introduction
- 3.2. Market Drivers
- 3.2.1. Increasing Demand from Refineries; Other Drivers
- 3.3. Market Restrains
- 3.3.1. Increasing Demand from Refineries; Other Drivers
- 3.4. Market Trends
- 3.4.1. Crude Oil has a Substantial Market Share
- 4. Market Factor Analysis
- 4.1. Porters Five Forces
- 4.2. Supply/Value Chain
- 4.3. PESTEL analysis
- 4.4. Market Entropy
- 4.5. Patent/Trademark Analysis
- 5. Global Drag Reducing Agents Market Analysis, Insights and Forecast, 2019-2031
- 5.1. Market Analysis, Insights and Forecast - by Application
- 5.1.1. Low- and Medium-phase Crude Oil
- 5.1.2. Heavy/Asphaltic Crude
- 5.1.3. Multiphase Fluid
- 5.1.4. Refined Products
- 5.1.5. Other Applications
- 5.2. Market Analysis, Insights and Forecast - by Region
- 5.2.1. Asia Pacific
- 5.2.2. North America
- 5.2.3. Europe
- 5.2.4. South America
- 5.2.5. Middle East and Africa
- 5.1. Market Analysis, Insights and Forecast - by Application
- 6. Asia Pacific Drag Reducing Agents Market Analysis, Insights and Forecast, 2019-2031
- 6.1. Market Analysis, Insights and Forecast - by Application
- 6.1.1. Low- and Medium-phase Crude Oil
- 6.1.2. Heavy/Asphaltic Crude
- 6.1.3. Multiphase Fluid
- 6.1.4. Refined Products
- 6.1.5. Other Applications
- 6.1. Market Analysis, Insights and Forecast - by Application
- 7. North America Drag Reducing Agents Market Analysis, Insights and Forecast, 2019-2031
- 7.1. Market Analysis, Insights and Forecast - by Application
- 7.1.1. Low- and Medium-phase Crude Oil
- 7.1.2. Heavy/Asphaltic Crude
- 7.1.3. Multiphase Fluid
- 7.1.4. Refined Products
- 7.1.5. Other Applications
- 7.1. Market Analysis, Insights and Forecast - by Application
- 8. Europe Drag Reducing Agents Market Analysis, Insights and Forecast, 2019-2031
- 8.1. Market Analysis, Insights and Forecast - by Application
- 8.1.1. Low- and Medium-phase Crude Oil
- 8.1.2. Heavy/Asphaltic Crude
- 8.1.3. Multiphase Fluid
- 8.1.4. Refined Products
- 8.1.5. Other Applications
- 8.1. Market Analysis, Insights and Forecast - by Application
- 9. South America Drag Reducing Agents Market Analysis, Insights and Forecast, 2019-2031
- 9.1. Market Analysis, Insights and Forecast - by Application
- 9.1.1. Low- and Medium-phase Crude Oil
- 9.1.2. Heavy/Asphaltic Crude
- 9.1.3. Multiphase Fluid
- 9.1.4. Refined Products
- 9.1.5. Other Applications
- 9.1. Market Analysis, Insights and Forecast - by Application
- 10. Middle East and Africa Drag Reducing Agents Market Analysis, Insights and Forecast, 2019-2031
- 10.1. Market Analysis, Insights and Forecast - by Application
- 10.1.1. Low- and Medium-phase Crude Oil
- 10.1.2. Heavy/Asphaltic Crude
- 10.1.3. Multiphase Fluid
- 10.1.4. Refined Products
- 10.1.5. Other Applications
- 10.1. Market Analysis, Insights and Forecast - by Application
- 11. Competitive Analysis
- 11.1. Global Market Share Analysis 2024
- 11.2. Company Profiles
- 11.2.1 Baker Hughes
- 11.2.1.1. Overview
- 11.2.1.2. Products
- 11.2.1.3. SWOT Analysis
- 11.2.1.4. Recent Developments
- 11.2.1.5. Financials (Based on Availability)
- 11.2.2 Dorf Ketal Chemicals India Pvt Ltd
- 11.2.2.1. Overview
- 11.2.2.2. Products
- 11.2.2.3. SWOT Analysis
- 11.2.2.4. Recent Developments
- 11.2.2.5. Financials (Based on Availability)
- 11.2.3 Flowchem
- 11.2.3.1. Overview
- 11.2.3.2. Products
- 11.2.3.3. SWOT Analysis
- 11.2.3.4. Recent Developments
- 11.2.3.5. Financials (Based on Availability)
- 11.2.4 Indian Oil Corp Ltd
- 11.2.4.1. Overview
- 11.2.4.2. Products
- 11.2.4.3. SWOT Analysis
- 11.2.4.4. Recent Developments
- 11.2.4.5. Financials (Based on Availability)
- 11.2.5 Innospec
- 11.2.5.1. Overview
- 11.2.5.2. Products
- 11.2.5.3. SWOT Analysis
- 11.2.5.4. Recent Developments
- 11.2.5.5. Financials (Based on Availability)
- 11.2.6 Jiangyin Huaheng Auxiliary Co Ltd
- 11.2.6.1. Overview
- 11.2.6.2. Products
- 11.2.6.3. SWOT Analysis
- 11.2.6.4. Recent Developments
- 11.2.6.5. Financials (Based on Availability)
- 11.2.7 LiquidPower Specialty Products Inc
- 11.2.7.1. Overview
- 11.2.7.2. Products
- 11.2.7.3. SWOT Analysis
- 11.2.7.4. Recent Developments
- 11.2.7.5. Financials (Based on Availability)
- 11.2.8 NuGenTec
- 11.2.8.1. Overview
- 11.2.8.2. Products
- 11.2.8.3. SWOT Analysis
- 11.2.8.4. Recent Developments
- 11.2.8.5. Financials (Based on Availability)
- 11.2.9 Oil Flux Americas
- 11.2.9.1. Overview
- 11.2.9.2. Products
- 11.2.9.3. SWOT Analysis
- 11.2.9.4. Recent Developments
- 11.2.9.5. Financials (Based on Availability)
- 11.2.10 The Zoranoc Oilfield Chemical*List Not Exhaustive
- 11.2.10.1. Overview
- 11.2.10.2. Products
- 11.2.10.3. SWOT Analysis
- 11.2.10.4. Recent Developments
- 11.2.10.5. Financials (Based on Availability)
- 11.2.1 Baker Hughes
List of Figures
- Figure 1: Global Drag Reducing Agents Market Revenue Breakdown (Million, %) by Region 2024 & 2032
- Figure 2: Asia Pacific Drag Reducing Agents Market Revenue (Million), by Application 2024 & 2032
- Figure 3: Asia Pacific Drag Reducing Agents Market Revenue Share (%), by Application 2024 & 2032
- Figure 4: Asia Pacific Drag Reducing Agents Market Revenue (Million), by Country 2024 & 2032
- Figure 5: Asia Pacific Drag Reducing Agents Market Revenue Share (%), by Country 2024 & 2032
- Figure 6: North America Drag Reducing Agents Market Revenue (Million), by Application 2024 & 2032
- Figure 7: North America Drag Reducing Agents Market Revenue Share (%), by Application 2024 & 2032
- Figure 8: North America Drag Reducing Agents Market Revenue (Million), by Country 2024 & 2032
- Figure 9: North America Drag Reducing Agents Market Revenue Share (%), by Country 2024 & 2032
- Figure 10: Europe Drag Reducing Agents Market Revenue (Million), by Application 2024 & 2032
- Figure 11: Europe Drag Reducing Agents Market Revenue Share (%), by Application 2024 & 2032
- Figure 12: Europe Drag Reducing Agents Market Revenue (Million), by Country 2024 & 2032
- Figure 13: Europe Drag Reducing Agents Market Revenue Share (%), by Country 2024 & 2032
- Figure 14: South America Drag Reducing Agents Market Revenue (Million), by Application 2024 & 2032
- Figure 15: South America Drag Reducing Agents Market Revenue Share (%), by Application 2024 & 2032
- Figure 16: South America Drag Reducing Agents Market Revenue (Million), by Country 2024 & 2032
- Figure 17: South America Drag Reducing Agents Market Revenue Share (%), by Country 2024 & 2032
- Figure 18: Middle East and Africa Drag Reducing Agents Market Revenue (Million), by Application 2024 & 2032
- Figure 19: Middle East and Africa Drag Reducing Agents Market Revenue Share (%), by Application 2024 & 2032
- Figure 20: Middle East and Africa Drag Reducing Agents Market Revenue (Million), by Country 2024 & 2032
- Figure 21: Middle East and Africa Drag Reducing Agents Market Revenue Share (%), by Country 2024 & 2032
List of Tables
- Table 1: Global Drag Reducing Agents Market Revenue Million Forecast, by Region 2019 & 2032
- Table 2: Global Drag Reducing Agents Market Revenue Million Forecast, by Application 2019 & 2032
- Table 3: Global Drag Reducing Agents Market Revenue Million Forecast, by Region 2019 & 2032
- Table 4: Global Drag Reducing Agents Market Revenue Million Forecast, by Application 2019 & 2032
- Table 5: Global Drag Reducing Agents Market Revenue Million Forecast, by Country 2019 & 2032
- Table 6: China Drag Reducing Agents Market Revenue (Million) Forecast, by Application 2019 & 2032
- Table 7: India Drag Reducing Agents Market Revenue (Million) Forecast, by Application 2019 & 2032
- Table 8: Japan Drag Reducing Agents Market Revenue (Million) Forecast, by Application 2019 & 2032
- Table 9: South Korea Drag Reducing Agents Market Revenue (Million) Forecast, by Application 2019 & 2032
- Table 10: Rest of Asia Pacific Drag Reducing Agents Market Revenue (Million) Forecast, by Application 2019 & 2032
- Table 11: Global Drag Reducing Agents Market Revenue Million Forecast, by Application 2019 & 2032
- Table 12: Global Drag Reducing Agents Market Revenue Million Forecast, by Country 2019 & 2032
- Table 13: United States Drag Reducing Agents Market Revenue (Million) Forecast, by Application 2019 & 2032
- Table 14: Canada Drag Reducing Agents Market Revenue (Million) Forecast, by Application 2019 & 2032
- Table 15: Mexico Drag Reducing Agents Market Revenue (Million) Forecast, by Application 2019 & 2032
- Table 16: Global Drag Reducing Agents Market Revenue Million Forecast, by Application 2019 & 2032
- Table 17: Global Drag Reducing Agents Market Revenue Million Forecast, by Country 2019 & 2032
- Table 18: Germany Drag Reducing Agents Market Revenue (Million) Forecast, by Application 2019 & 2032
- Table 19: United Kingdom Drag Reducing Agents Market Revenue (Million) Forecast, by Application 2019 & 2032
- Table 20: France Drag Reducing Agents Market Revenue (Million) Forecast, by Application 2019 & 2032
- Table 21: Italy Drag Reducing Agents Market Revenue (Million) Forecast, by Application 2019 & 2032
- Table 22: Rest of Europe Drag Reducing Agents Market Revenue (Million) Forecast, by Application 2019 & 2032
- Table 23: Global Drag Reducing Agents Market Revenue Million Forecast, by Application 2019 & 2032
- Table 24: Global Drag Reducing Agents Market Revenue Million Forecast, by Country 2019 & 2032
- Table 25: Brazil Drag Reducing Agents Market Revenue (Million) Forecast, by Application 2019 & 2032
- Table 26: Argentina Drag Reducing Agents Market Revenue (Million) Forecast, by Application 2019 & 2032
- Table 27: Rest of South America Drag Reducing Agents Market Revenue (Million) Forecast, by Application 2019 & 2032
- Table 28: Global Drag Reducing Agents Market Revenue Million Forecast, by Application 2019 & 2032
- Table 29: Global Drag Reducing Agents Market Revenue Million Forecast, by Country 2019 & 2032
- Table 30: South Africa Drag Reducing Agents Market Revenue (Million) Forecast, by Application 2019 & 2032
- Table 31: Saudi Arabia Drag Reducing Agents Market Revenue (Million) Forecast, by Application 2019 & 2032
- Table 32: Rest of Middle East and Africa Drag Reducing Agents Market Revenue (Million) Forecast, by Application 2019 & 2032
Frequently Asked Questions
1. What is the projected Compound Annual Growth Rate (CAGR) of the Drag Reducing Agents Market?
The projected CAGR is approximately > 5.00%.
2. Which companies are prominent players in the Drag Reducing Agents Market?
Key companies in the market include Baker Hughes, Dorf Ketal Chemicals India Pvt Ltd, Flowchem, Indian Oil Corp Ltd, Innospec, Jiangyin Huaheng Auxiliary Co Ltd, LiquidPower Specialty Products Inc, NuGenTec, Oil Flux Americas, The Zoranoc Oilfield Chemical*List Not Exhaustive.
3. What are the main segments of the Drag Reducing Agents Market?
The market segments include Application.
4. Can you provide details about the market size?
The market size is estimated to be USD XX Million as of 2022.
5. What are some drivers contributing to market growth?
Increasing Demand from Refineries; Other Drivers.
6. What are the notable trends driving market growth?
Crude Oil has a Substantial Market Share.
7. Are there any restraints impacting market growth?
Increasing Demand from Refineries; Other Drivers.
8. Can you provide examples of recent developments in the market?
August 2022 : Baker Hughes announced an agreement to acquire Quest Integrity a subsidiary of Team, Inc, in the development and delivery of technology-enabled asset inspection and reliability management solutions for the pipeline, refinery, petrochemical, and power generation industries. Baker Hughes pipeline inspection services identify, describe, locate, and size abnormalities in a pipeline's wall that may need the use of drag reducers to decrease frictional pressure drops in a pipeline or conduit during fluid flow.
9. What pricing options are available for accessing the report?
Pricing options include single-user, multi-user, and enterprise licenses priced at USD 4750, USD 5250, and USD 8750 respectively.
10. Is the market size provided in terms of value or volume?
The market size is provided in terms of value, measured in Million.
11. Are there any specific market keywords associated with the report?
Yes, the market keyword associated with the report is "Drag Reducing Agents Market," which aids in identifying and referencing the specific market segment covered.
12. How do I determine which pricing option suits my needs best?
The pricing options vary based on user requirements and access needs. Individual users may opt for single-user licenses, while businesses requiring broader access may choose multi-user or enterprise licenses for cost-effective access to the report.
13. Are there any additional resources or data provided in the Drag Reducing Agents Market report?
While the report offers comprehensive insights, it's advisable to review the specific contents or supplementary materials provided to ascertain if additional resources or data are available.
14. How can I stay updated on further developments or reports in the Drag Reducing Agents Market?
To stay informed about further developments, trends, and reports in the Drag Reducing Agents Market, consider subscribing to industry newsletters, following relevant companies and organizations, or regularly checking reputable industry news sources and publications.
Methodology
Step 1 - Identification of Relevant Samples Size from Population Database


Step 2 - Approaches for Defining Global Market Size (Value, Volume* & Price*)

Note*: In applicable scenarios
Step 3 - Data Sources
Primary Research
- Web Analytics
- Survey Reports
- Research Institute
- Latest Research Reports
- Opinion Leaders
Secondary Research
- Annual Reports
- White Paper
- Latest Press Release
- Industry Association
- Paid Database
- Investor Presentations

Step 4 - Data Triangulation
Involves using different sources of information in order to increase the validity of a study
These sources are likely to be stakeholders in a program - participants, other researchers, program staff, other community members, and so on.
Then we put all data in single framework & apply various statistical tools to find out the dynamic on the market.
During the analysis stage, feedback from the stakeholder groups would be compared to determine areas of agreement as well as areas of divergence


