

Key Insights
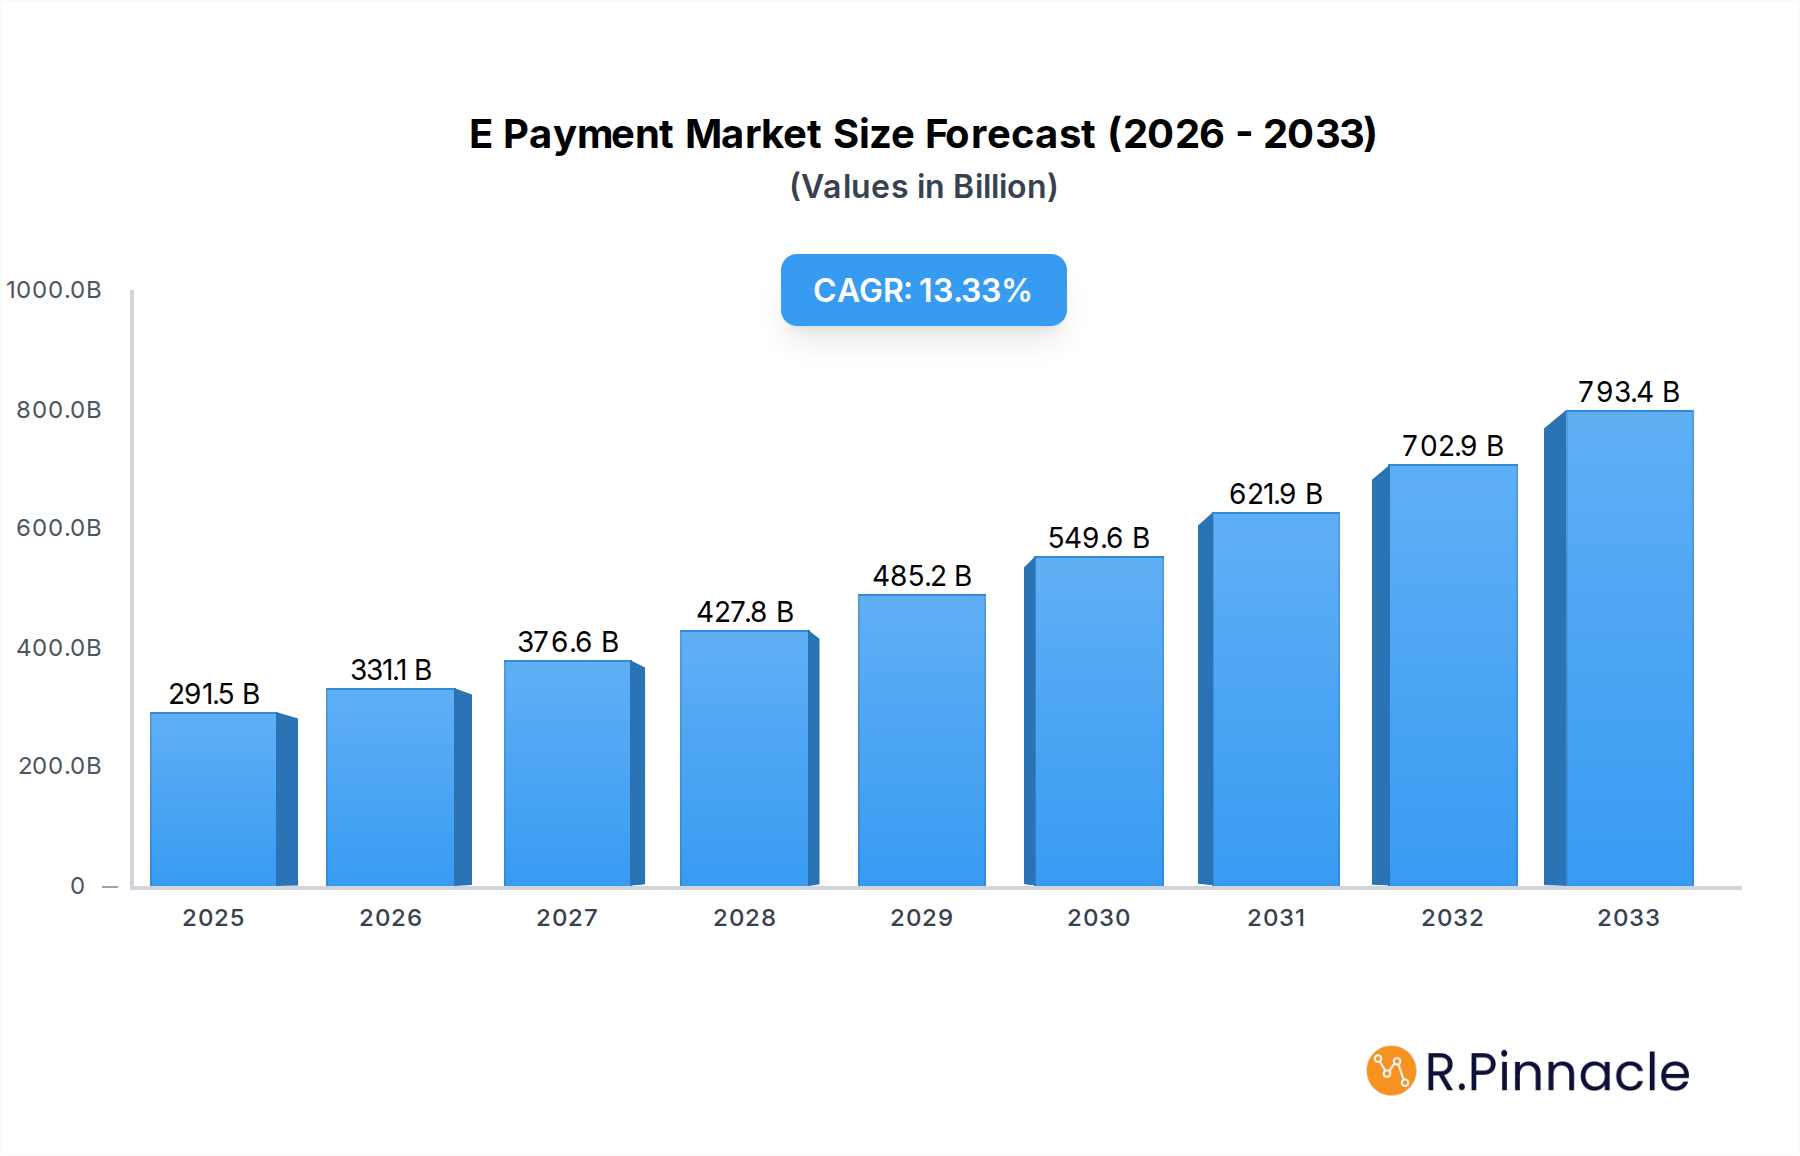
The global E-Payment market is poised for significant expansion, projected to reach USD 291.5 billion in 2025. This robust growth is fueled by an impressive CAGR of 13.59%, indicating a dynamic and rapidly evolving landscape. Several key drivers are propelling this surge. The increasing adoption of digital technologies across all sectors, coupled with a growing consumer preference for convenient and secure transaction methods, is a primary catalyst. The burgeoning e-commerce sector, amplified by the pandemic's acceleration of online shopping habits, continues to be a major contributor. Furthermore, the widespread availability of smartphones and improved internet penetration, especially in emerging economies, are democratizing access to digital payment solutions. Innovations in payment technology, such as contactless payments, mobile wallets, and the integration of AI for enhanced security and fraud detection, are also shaping a more sophisticated and user-friendly payment ecosystem.

E Payment Market Size (In Billion)
The market's trajectory is further influenced by a blend of cross-border and non-cross-border transactions, with significant opportunities arising from both. While BFSI, Healthcare, Energy and Electricity, Tourism and Transport, Retail, and Government/Public Sector represent key application segments, the sheer volume and increasing value of cross-border e-payments are becoming increasingly critical for global trade and remittances. Leading companies like Stripe, PayPal, and Ant Financial are at the forefront of this innovation, offering a diverse range of solutions that cater to businesses and individuals alike. While the market benefits from strong growth drivers, potential restraints could include evolving regulatory frameworks, data security concerns, and the need for continuous investment in robust cybersecurity infrastructure to maintain consumer trust and prevent financial fraud. Nevertheless, the overarching trend points towards a future dominated by digital, seamless, and secure electronic payments.
E Payment Company Market Share
This comprehensive E Payment market analysis delves into the transformative forces shaping global digital transactions. Spanning the historical period of 2019-2024 and projecting to 2033, with a base and estimated year of 2025, this report provides an in-depth understanding of market structure, dynamics, innovations, and future growth trajectories. We meticulously examine key players like Stripe, PayPal, Ant Financial, Brex, Marqeta, Plaid, and TransferWise, alongside emerging contenders such as Toss and Aeropay, within the burgeoning E Payment ecosystem.
E Payment Market Structure & Innovation Trends
The E Payment market exhibits a dynamic structure characterized by evolving concentration levels and a relentless pursuit of innovation. Key drivers include the increasing demand for seamless digital transactions, the proliferation of mobile devices, and the development of advanced payment technologies. Regulatory frameworks, such as PSD2 in Europe and evolving data privacy laws globally, significantly influence market entry and operational strategies. Product substitutes, including traditional payment methods and nascent decentralized finance solutions, continuously challenge the status quo. End-user demographics are shifting towards younger, tech-savvy populations who demand convenience and speed. Mergers and acquisitions (M&A) activity remains robust, with significant deal values in the billions, as established players seek to acquire innovative technologies and expand market reach. For instance, the M&A landscape has seen deals exceeding $50 billion in recent years. Market share distributions are constantly reconfigured by strategic partnerships and innovative product launches.
- Market Concentration: Moderate to high concentration in core segments, with increasing fragmentation in niche areas.
- Innovation Drivers: Real-time payments, AI-powered fraud detection, embedded finance, and the metaverse.
- Regulatory Frameworks: Evolving compliance demands around data security, KYC/AML, and cross-border regulations.
- Product Substitutes: Cash, checks, traditional bank transfers, and emerging cryptocurrencies.
- End-User Demographics: Growing adoption among Gen Z and Millennials, with increasing digital payment penetration in emerging economies.
- M&A Activities: Strategic acquisitions targeting fintech startups, payment infrastructure providers, and data analytics firms, with total deal values projected to reach $100 billion by 2033.
E Payment Market Dynamics & Trends
The E Payment market is experiencing unprecedented growth, fueled by a confluence of powerful market drivers and transformative technological disruptions. The overarching trend is the accelerated shift from physical to digital payment methods, a phenomenon significantly amplified by recent global events. This digital migration is directly linked to increased internet penetration and smartphone adoption worldwide, particularly in developing economies where mobile payments are often the primary access point to financial services. Consumer preferences are rapidly evolving, prioritizing convenience, speed, security, and personalized payment experiences. This is evident in the surging demand for contactless payments, one-click checkout solutions, and integrated payment options within e-commerce platforms and mobile applications.
Technological advancements are at the core of this market's dynamism. Innovations such as tokenization, biometrics, and advanced encryption are bolstering security and trust in digital transactions. The rise of Application Programming Interfaces (APIs) has enabled seamless integration of payment functionalities into a wider range of applications and services, fostering a more embedded finance ecosystem. Furthermore, the development of real-time payment networks and faster settlement systems is reducing transaction times and costs, making digital payments more attractive for both consumers and businesses. The competitive landscape is intensely dynamic, with a constant influx of new entrants and established players innovating to capture market share. Established giants like Stripe and PayPal are competing fiercely with agile fintech startups and regional champions such as Toss and Circle. The market penetration of digital payments is projected to exceed 70% globally by 2028, with a Compound Annual Growth Rate (CAGR) estimated at 15% during the forecast period. Key segments, such as cross-boundary payments, are witnessing substantial growth due to globalization and the expansion of e-commerce. The overall market size is expected to surpass $5 trillion by 2033, driven by these pervasive trends.
Dominant Regions & Segments in E Payment
The E Payment market's dominance is intricately linked to regional economic policies, digital infrastructure development, and evolving consumer behaviors. North America and Europe currently lead in terms of market size and penetration, driven by established financial institutions, robust technological ecosystems, and high disposable incomes. However, the Asia-Pacific region is emerging as a formidable force, propelled by rapid digitalization, a burgeoning middle class, and widespread mobile adoption, particularly in countries like China and India, where players like Ant Financial and Remitly are making significant inroads.
Within the application segments, the BFSI (Banking, Financial Services, and Insurance) sector remains the largest contributor, leveraging E Payment for a multitude of services including online banking, loan disbursements, and insurance premium collections. The Retail sector follows closely, with e-commerce and omnichannel strategies heavily reliant on efficient and secure digital payment gateways. The Tourism and Transport sector is also witnessing substantial growth, with online booking platforms and ride-sharing services driving demand for seamless payment solutions. While Healthcare and Energy and Electricity sectors are adopting E Payments at a growing pace for patient billing and utility payments respectively, their current contribution is relatively smaller. The Government/Public Sector is gradually embracing digital payment for tax collection and disbursement of social benefits, indicating future growth potential.
In terms of payment type, Non-Cross-Boundary payments, encompassing domestic transactions, constitute the larger share of the market currently due to their inherent simplicity and widespread acceptance. However, Cross-Boundary E Payments are experiencing a significantly higher growth rate, fueled by the expansion of global e-commerce, cross-border remittances, and international business transactions. Companies like Flywire and TransferWise are at the forefront of this expansion. The increasing ease of international trade and the growing number of digital nomads and expatriates are key drivers for the cross-boundary segment. The robust economic policies promoting digital trade and the investment in cross-border payment infrastructure are critical factors supporting the dominance of these regions and segments. The total market value for E Payments is projected to reach $5 trillion by 2033, with cross-boundary transactions expected to exhibit a CAGR of 18%.
E Payment Product Innovations
Recent product innovations in the E Payment market are centered on enhancing user experience, security, and functionality. Contactless payment technologies, including NFC and QR codes, are becoming ubiquitous. The integration of AI and machine learning is revolutionizing fraud detection and risk management, offering real-time protection to consumers and businesses. Embedded payment solutions, seamlessly integrated into non-financial applications, are simplifying transactions for users. Furthermore, advancements in open banking and API-driven platforms are enabling richer data sharing and personalized financial services. These innovations are not only improving convenience but also creating new revenue streams and competitive advantages for companies like Brex and Poynt.
Report Scope & Segmentation Analysis
This report segments the E Payment market based on Application and Type. Under Application, it covers BFSI, Healthcare, Energy and Electricity, Tourism and Transport, Retail, Government/Public Sector, and Other. Under Type, it differentiates between Cross-Boundary and Non-Cross-Boundary payments. The BFSI segment is projected to reach $1.5 trillion by 2033, driven by digital transformation initiatives. The Retail segment is expected to grow at a CAGR of 16%, exceeding $1.2 trillion. Cross-Boundary payments, with a projected CAGR of 18%, are anticipated to reach $2 trillion by 2033, as global e-commerce continues its upward trajectory. Non-Cross-Boundary payments are expected to hold a significant market share, valued at $3 trillion, with steady growth driven by domestic digital adoption.
Key Drivers of E Payment Growth
Several interconnected factors are propelling the E Payment market forward. Technological advancements such as real-time payment networks, blockchain, and AI-powered fraud detection are enhancing efficiency and security. Economic factors, including the increasing disposable incomes in emerging economies, the growth of e-commerce, and government initiatives promoting digital economies, are creating a fertile ground for adoption. Regulatory support for digital payments and open banking frameworks is further accelerating growth. The convenience and accessibility offered by mobile payments and digital wallets are also key drivers, catering to the evolving consumer preference for seamless transactions. For example, the widespread availability of smartphones in developing nations has unlocked massive potential for digital payment adoption, estimated to impact over 3 billion new users by 2030.
Challenges in the E Payment Sector
Despite the robust growth, the E Payment sector faces several significant challenges. Regulatory hurdles and compliance costs can be substantial, especially for cross-border transactions and in highly regulated industries like BFSI. Cybersecurity threats and data privacy concerns remain paramount, requiring continuous investment in advanced security measures to maintain consumer trust. Infrastructure limitations in certain regions, particularly in rural areas, can hinder widespread adoption. Intense competition from established players and new entrants necessitates constant innovation and competitive pricing strategies. Interoperability issues between different payment systems and platforms can also create friction for users. The cost of combating fraud alone is projected to exceed $100 billion annually by 2028.
Emerging Opportunities in E Payment
The E Payment market is rife with emerging opportunities. The metaverse and Web3 present entirely new avenues for digital transactions, including in-game purchases and virtual asset trading. The continued growth of embedded finance, where payment solutions are integrated into non-financial applications, offers significant potential for increased transaction volumes. Buy Now, Pay Later (BNPL) services are gaining immense traction, particularly among younger consumers. The expansion of cross-border remittance services through innovative fintech solutions is unlocking new markets and customer segments. Furthermore, the increasing focus on sustainability and ESG is driving demand for greener payment solutions and transparent financial reporting. The global BNPL market is projected to reach $2 trillion by 2030, showcasing a significant opportunity.
Leading Players in the E Payment Market
- Stripe
- PayPal
- Ant Financial
- Brex
- Marqeta
- Plaid
- Poynt
- Remitly
- TransferWise
- Bolt
- Flywire
- Forter
- Toast
- Tradeshift
- Circle
- Braintree
- Aeropay
- DailyPay
- Ripple
- Affirm
- DOXO
- Q2ebanking
- Toss
Key Developments in E Payment Industry
- 2023/09: Stripe launches new fraud prevention tools leveraging AI.
- 2023/10: PayPal expands its BNPL offerings to new markets.
- 2023/11: Ant Financial partners with a leading e-commerce platform in Southeast Asia.
- 2023/12: Brex announces significant funding round to expand its corporate card services.
- 2024/01: Marqeta enhances its card issuing platform with new customization features.
- 2024/02: Plaid introduces new data aggregation services for fintech startups.
- 2024/03: Flywire expands its cross-border payment solutions for the education sector.
- 2024/04: Ripple announces new partnerships for cross-border payment solutions.
- 2024/05: Affirm sees strong growth in its BNPL segment, exceeding $50 billion in transaction volume.
- 2024/06: Circle expands its stablecoin offerings for institutional investors.
Future Outlook for E Payment Market
The future outlook for the E Payment market is exceptionally bright, driven by ongoing digital transformation and evolving consumer behaviors. The continued innovation in areas like embedded finance, contactless payments, and decentralized finance will unlock new transaction models and revenue streams. The increasing adoption of real-time payment systems globally will further enhance efficiency and reduce friction in transactions. Emerging markets, with their rapidly expanding digital infrastructure and young, tech-savvy populations, represent a significant growth frontier. Strategic investments in cybersecurity and regulatory compliance will be crucial for sustained growth and maintaining consumer trust. The market is poised for continued expansion, with projections indicating it will surpass $5 trillion in value by 2033, offering substantial opportunities for all stakeholders.
E Payment Segmentation
-
1. Application
- 1.1. BFSI
- 1.2. Healthcare
- 1.3. Energy and Electricity
- 1.4. Tourism and Transport
- 1.5. Retail
- 1.6. Government/Public Sector
- 1.7. Other
-
2. Type
- 2.1. Cross-Boundary
- 2.2. Non-Cross-Boundary
E Payment Segmentation By Geography
-
1. North America
- 1.1. United States
- 1.2. Canada
- 1.3. Mexico
-
2. South America
- 2.1. Brazil
- 2.2. Argentina
- 2.3. Rest of South America
-
3. Europe
- 3.1. United Kingdom
- 3.2. Germany
- 3.3. France
- 3.4. Italy
- 3.5. Spain
- 3.6. Russia
- 3.7. Benelux
- 3.8. Nordics
- 3.9. Rest of Europe
-
4. Middle East & Africa
- 4.1. Turkey
- 4.2. Israel
- 4.3. GCC
- 4.4. North Africa
- 4.5. South Africa
- 4.6. Rest of Middle East & Africa
-
5. Asia Pacific
- 5.1. China
- 5.2. India
- 5.3. Japan
- 5.4. South Korea
- 5.5. ASEAN
- 5.6. Oceania
- 5.7. Rest of Asia Pacific
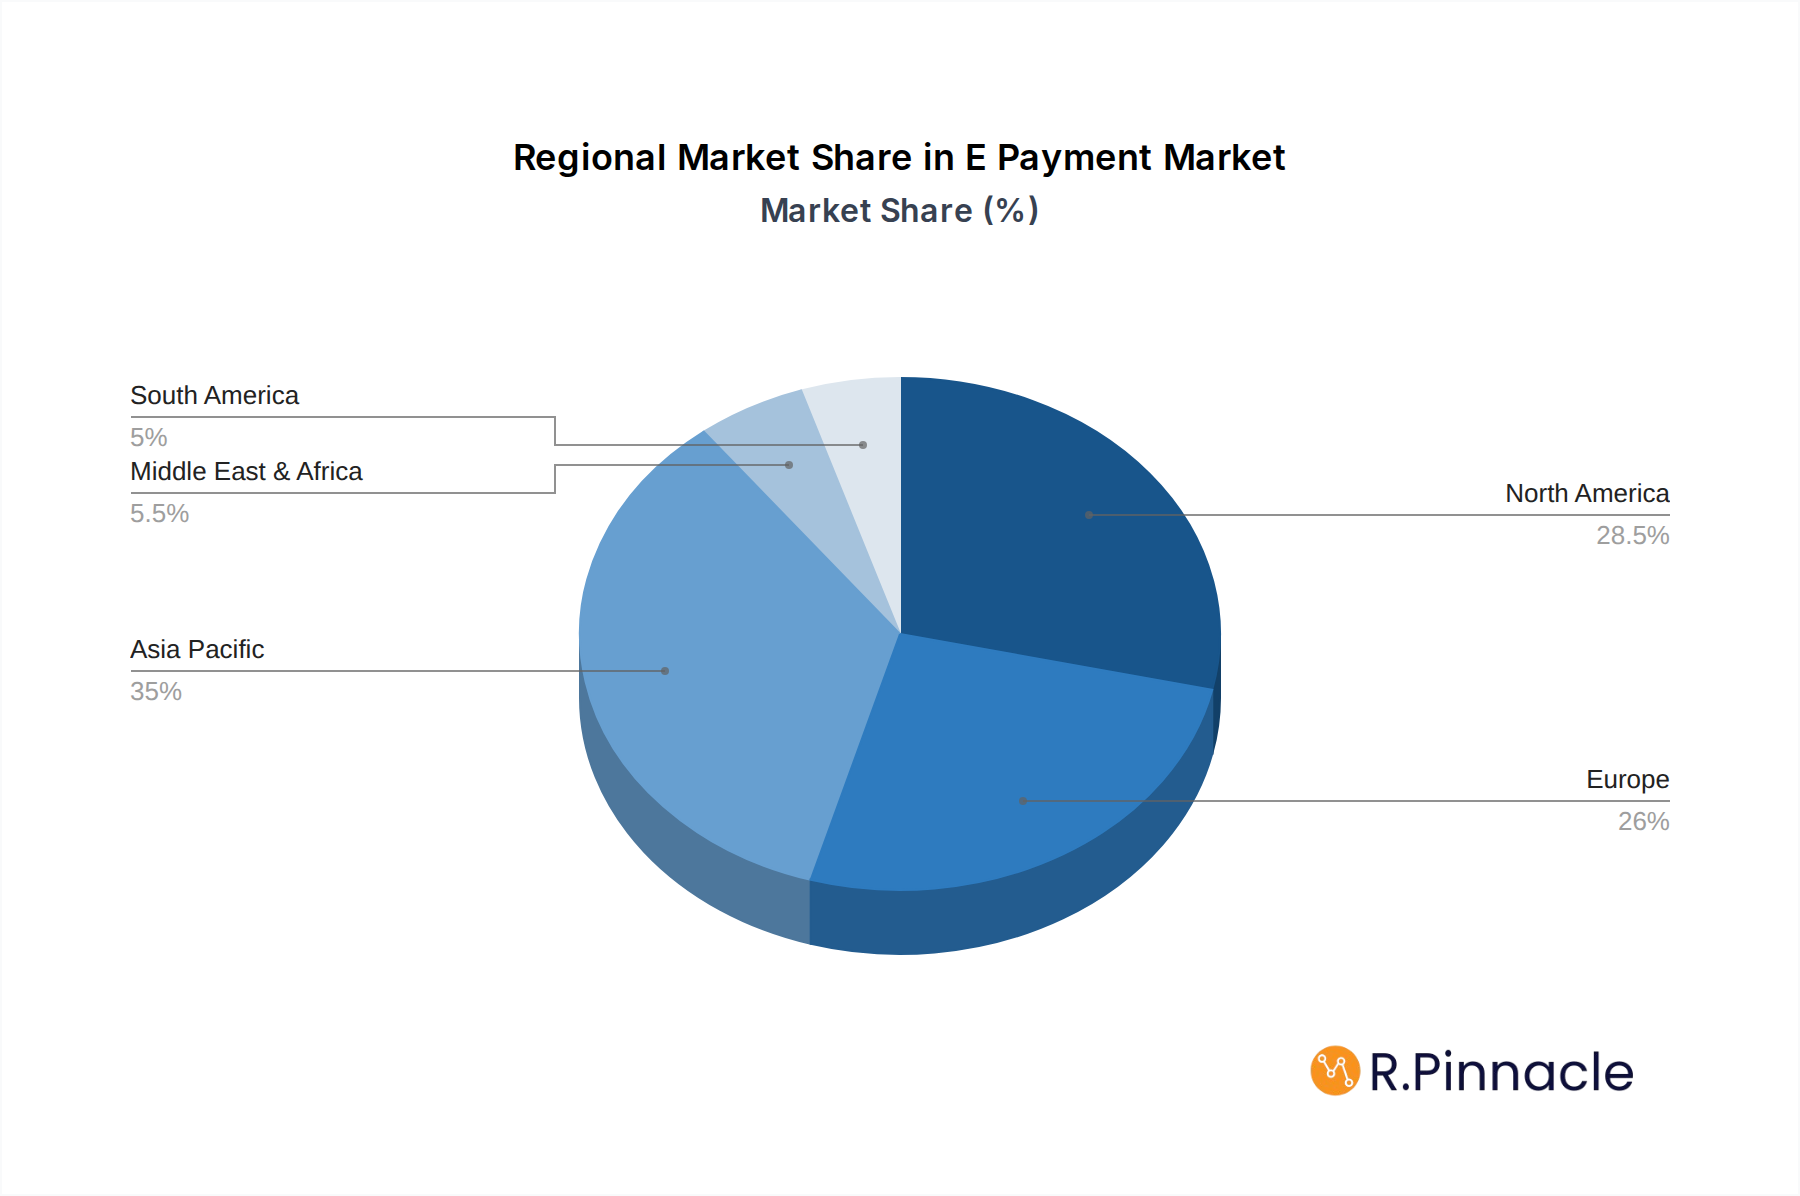
E Payment Regional Market Share
Geographic Coverage of E Payment
E Payment REPORT HIGHLIGHTS
| Aspects | Details |
|---|---|
| Study Period | 2020-2034 |
| Base Year | 2025 |
| Estimated Year | 2026 |
| Forecast Period | 2026-2034 |
| Historical Period | 2020-2025 |
| Growth Rate | CAGR of 13.59% from 2020-2034 |
| Segmentation |
|
Table of Contents
- 1. Introduction
- 1.1. Research Scope
- 1.2. Market Segmentation
- 1.3. Research Methodology
- 1.4. Definitions and Assumptions
- 2. Executive Summary
- 2.1. Introduction
- 3. Market Dynamics
- 3.1. Introduction
- 3.2. Market Drivers
- 3.3. Market Restrains
- 3.4. Market Trends
- 4. Market Factor Analysis
- 4.1. Porters Five Forces
- 4.2. Supply/Value Chain
- 4.3. PESTEL analysis
- 4.4. Market Entropy
- 4.5. Patent/Trademark Analysis
- 5. Global E Payment Analysis, Insights and Forecast, 2020-2032
- 5.1. Market Analysis, Insights and Forecast - by Application
- 5.1.1. BFSI
- 5.1.2. Healthcare
- 5.1.3. Energy and Electricity
- 5.1.4. Tourism and Transport
- 5.1.5. Retail
- 5.1.6. Government/Public Sector
- 5.1.7. Other
- 5.2. Market Analysis, Insights and Forecast - by Type
- 5.2.1. Cross-Boundary
- 5.2.2. Non-Cross-Boundary
- 5.3. Market Analysis, Insights and Forecast - by Region
- 5.3.1. North America
- 5.3.2. South America
- 5.3.3. Europe
- 5.3.4. Middle East & Africa
- 5.3.5. Asia Pacific
- 5.1. Market Analysis, Insights and Forecast - by Application
- 6. North America E Payment Analysis, Insights and Forecast, 2020-2032
- 6.1. Market Analysis, Insights and Forecast - by Application
- 6.1.1. BFSI
- 6.1.2. Healthcare
- 6.1.3. Energy and Electricity
- 6.1.4. Tourism and Transport
- 6.1.5. Retail
- 6.1.6. Government/Public Sector
- 6.1.7. Other
- 6.2. Market Analysis, Insights and Forecast - by Type
- 6.2.1. Cross-Boundary
- 6.2.2. Non-Cross-Boundary
- 6.1. Market Analysis, Insights and Forecast - by Application
- 7. South America E Payment Analysis, Insights and Forecast, 2020-2032
- 7.1. Market Analysis, Insights and Forecast - by Application
- 7.1.1. BFSI
- 7.1.2. Healthcare
- 7.1.3. Energy and Electricity
- 7.1.4. Tourism and Transport
- 7.1.5. Retail
- 7.1.6. Government/Public Sector
- 7.1.7. Other
- 7.2. Market Analysis, Insights and Forecast - by Type
- 7.2.1. Cross-Boundary
- 7.2.2. Non-Cross-Boundary
- 7.1. Market Analysis, Insights and Forecast - by Application
- 8. Europe E Payment Analysis, Insights and Forecast, 2020-2032
- 8.1. Market Analysis, Insights and Forecast - by Application
- 8.1.1. BFSI
- 8.1.2. Healthcare
- 8.1.3. Energy and Electricity
- 8.1.4. Tourism and Transport
- 8.1.5. Retail
- 8.1.6. Government/Public Sector
- 8.1.7. Other
- 8.2. Market Analysis, Insights and Forecast - by Type
- 8.2.1. Cross-Boundary
- 8.2.2. Non-Cross-Boundary
- 8.1. Market Analysis, Insights and Forecast - by Application
- 9. Middle East & Africa E Payment Analysis, Insights and Forecast, 2020-2032
- 9.1. Market Analysis, Insights and Forecast - by Application
- 9.1.1. BFSI
- 9.1.2. Healthcare
- 9.1.3. Energy and Electricity
- 9.1.4. Tourism and Transport
- 9.1.5. Retail
- 9.1.6. Government/Public Sector
- 9.1.7. Other
- 9.2. Market Analysis, Insights and Forecast - by Type
- 9.2.1. Cross-Boundary
- 9.2.2. Non-Cross-Boundary
- 9.1. Market Analysis, Insights and Forecast - by Application
- 10. Asia Pacific E Payment Analysis, Insights and Forecast, 2020-2032
- 10.1. Market Analysis, Insights and Forecast - by Application
- 10.1.1. BFSI
- 10.1.2. Healthcare
- 10.1.3. Energy and Electricity
- 10.1.4. Tourism and Transport
- 10.1.5. Retail
- 10.1.6. Government/Public Sector
- 10.1.7. Other
- 10.2. Market Analysis, Insights and Forecast - by Type
- 10.2.1. Cross-Boundary
- 10.2.2. Non-Cross-Boundary
- 10.1. Market Analysis, Insights and Forecast - by Application
- 11. Competitive Analysis
- 11.1. Global Market Share Analysis 2025
- 11.2. Company Profiles
- 11.2.1 Bolt
- 11.2.1.1. Overview
- 11.2.1.2. Products
- 11.2.1.3. SWOT Analysis
- 11.2.1.4. Recent Developments
- 11.2.1.5. Financials (Based on Availability)
- 11.2.2 Brex
- 11.2.2.1. Overview
- 11.2.2.2. Products
- 11.2.2.3. SWOT Analysis
- 11.2.2.4. Recent Developments
- 11.2.2.5. Financials (Based on Availability)
- 11.2.3 Flywire
- 11.2.3.1. Overview
- 11.2.3.2. Products
- 11.2.3.3. SWOT Analysis
- 11.2.3.4. Recent Developments
- 11.2.3.5. Financials (Based on Availability)
- 11.2.4 Forter
- 11.2.4.1. Overview
- 11.2.4.2. Products
- 11.2.4.3. SWOT Analysis
- 11.2.4.4. Recent Developments
- 11.2.4.5. Financials (Based on Availability)
- 11.2.5 Marqeta
- 11.2.5.1. Overview
- 11.2.5.2. Products
- 11.2.5.3. SWOT Analysis
- 11.2.5.4. Recent Developments
- 11.2.5.5. Financials (Based on Availability)
- 11.2.6 Plaid
- 11.2.6.1. Overview
- 11.2.6.2. Products
- 11.2.6.3. SWOT Analysis
- 11.2.6.4. Recent Developments
- 11.2.6.5. Financials (Based on Availability)
- 11.2.7 Poynt
- 11.2.7.1. Overview
- 11.2.7.2. Products
- 11.2.7.3. SWOT Analysis
- 11.2.7.4. Recent Developments
- 11.2.7.5. Financials (Based on Availability)
- 11.2.8 Remitly
- 11.2.8.1. Overview
- 11.2.8.2. Products
- 11.2.8.3. SWOT Analysis
- 11.2.8.4. Recent Developments
- 11.2.8.5. Financials (Based on Availability)
- 11.2.9 Stripe
- 11.2.9.1. Overview
- 11.2.9.2. Products
- 11.2.9.3. SWOT Analysis
- 11.2.9.4. Recent Developments
- 11.2.9.5. Financials (Based on Availability)
- 11.2.10 Toast
- 11.2.10.1. Overview
- 11.2.10.2. Products
- 11.2.10.3. SWOT Analysis
- 11.2.10.4. Recent Developments
- 11.2.10.5. Financials (Based on Availability)
- 11.2.11 Tradeshift
- 11.2.11.1. Overview
- 11.2.11.2. Products
- 11.2.11.3. SWOT Analysis
- 11.2.11.4. Recent Developments
- 11.2.11.5. Financials (Based on Availability)
- 11.2.12 TransferWise
- 11.2.12.1. Overview
- 11.2.12.2. Products
- 11.2.12.3. SWOT Analysis
- 11.2.12.4. Recent Developments
- 11.2.12.5. Financials (Based on Availability)
- 11.2.13 Ant Financial
- 11.2.13.1. Overview
- 11.2.13.2. Products
- 11.2.13.3. SWOT Analysis
- 11.2.13.4. Recent Developments
- 11.2.13.5. Financials (Based on Availability)
- 11.2.14 Circle
- 11.2.14.1. Overview
- 11.2.14.2. Products
- 11.2.14.3. SWOT Analysis
- 11.2.14.4. Recent Developments
- 11.2.14.5. Financials (Based on Availability)
- 11.2.15 Braintree
- 11.2.15.1. Overview
- 11.2.15.2. Products
- 11.2.15.3. SWOT Analysis
- 11.2.15.4. Recent Developments
- 11.2.15.5. Financials (Based on Availability)
- 11.2.16 Aeropay
- 11.2.16.1. Overview
- 11.2.16.2. Products
- 11.2.16.3. SWOT Analysis
- 11.2.16.4. Recent Developments
- 11.2.16.5. Financials (Based on Availability)
- 11.2.17 DailyPay
- 11.2.17.1. Overview
- 11.2.17.2. Products
- 11.2.17.3. SWOT Analysis
- 11.2.17.4. Recent Developments
- 11.2.17.5. Financials (Based on Availability)
- 11.2.18 PayPal
- 11.2.18.1. Overview
- 11.2.18.2. Products
- 11.2.18.3. SWOT Analysis
- 11.2.18.4. Recent Developments
- 11.2.18.5. Financials (Based on Availability)
- 11.2.19 Ripple
- 11.2.19.1. Overview
- 11.2.19.2. Products
- 11.2.19.3. SWOT Analysis
- 11.2.19.4. Recent Developments
- 11.2.19.5. Financials (Based on Availability)
- 11.2.20 Affirm
- 11.2.20.1. Overview
- 11.2.20.2. Products
- 11.2.20.3. SWOT Analysis
- 11.2.20.4. Recent Developments
- 11.2.20.5. Financials (Based on Availability)
- 11.2.21 DOXO
- 11.2.21.1. Overview
- 11.2.21.2. Products
- 11.2.21.3. SWOT Analysis
- 11.2.21.4. Recent Developments
- 11.2.21.5. Financials (Based on Availability)
- 11.2.22 Q2ebanking
- 11.2.22.1. Overview
- 11.2.22.2. Products
- 11.2.22.3. SWOT Analysis
- 11.2.22.4. Recent Developments
- 11.2.22.5. Financials (Based on Availability)
- 11.2.23 Toss
- 11.2.23.1. Overview
- 11.2.23.2. Products
- 11.2.23.3. SWOT Analysis
- 11.2.23.4. Recent Developments
- 11.2.23.5. Financials (Based on Availability)
- 11.2.1 Bolt
List of Figures
- Figure 1: Global E Payment Revenue Breakdown (undefined, %) by Region 2025 & 2033
- Figure 2: North America E Payment Revenue (undefined), by Application 2025 & 2033
- Figure 3: North America E Payment Revenue Share (%), by Application 2025 & 2033
- Figure 4: North America E Payment Revenue (undefined), by Type 2025 & 2033
- Figure 5: North America E Payment Revenue Share (%), by Type 2025 & 2033
- Figure 6: North America E Payment Revenue (undefined), by Country 2025 & 2033
- Figure 7: North America E Payment Revenue Share (%), by Country 2025 & 2033
- Figure 8: South America E Payment Revenue (undefined), by Application 2025 & 2033
- Figure 9: South America E Payment Revenue Share (%), by Application 2025 & 2033
- Figure 10: South America E Payment Revenue (undefined), by Type 2025 & 2033
- Figure 11: South America E Payment Revenue Share (%), by Type 2025 & 2033
- Figure 12: South America E Payment Revenue (undefined), by Country 2025 & 2033
- Figure 13: South America E Payment Revenue Share (%), by Country 2025 & 2033
- Figure 14: Europe E Payment Revenue (undefined), by Application 2025 & 2033
- Figure 15: Europe E Payment Revenue Share (%), by Application 2025 & 2033
- Figure 16: Europe E Payment Revenue (undefined), by Type 2025 & 2033
- Figure 17: Europe E Payment Revenue Share (%), by Type 2025 & 2033
- Figure 18: Europe E Payment Revenue (undefined), by Country 2025 & 2033
- Figure 19: Europe E Payment Revenue Share (%), by Country 2025 & 2033
- Figure 20: Middle East & Africa E Payment Revenue (undefined), by Application 2025 & 2033
- Figure 21: Middle East & Africa E Payment Revenue Share (%), by Application 2025 & 2033
- Figure 22: Middle East & Africa E Payment Revenue (undefined), by Type 2025 & 2033
- Figure 23: Middle East & Africa E Payment Revenue Share (%), by Type 2025 & 2033
- Figure 24: Middle East & Africa E Payment Revenue (undefined), by Country 2025 & 2033
- Figure 25: Middle East & Africa E Payment Revenue Share (%), by Country 2025 & 2033
- Figure 26: Asia Pacific E Payment Revenue (undefined), by Application 2025 & 2033
- Figure 27: Asia Pacific E Payment Revenue Share (%), by Application 2025 & 2033
- Figure 28: Asia Pacific E Payment Revenue (undefined), by Type 2025 & 2033
- Figure 29: Asia Pacific E Payment Revenue Share (%), by Type 2025 & 2033
- Figure 30: Asia Pacific E Payment Revenue (undefined), by Country 2025 & 2033
- Figure 31: Asia Pacific E Payment Revenue Share (%), by Country 2025 & 2033
List of Tables
- Table 1: Global E Payment Revenue undefined Forecast, by Application 2020 & 2033
- Table 2: Global E Payment Revenue undefined Forecast, by Type 2020 & 2033
- Table 3: Global E Payment Revenue undefined Forecast, by Region 2020 & 2033
- Table 4: Global E Payment Revenue undefined Forecast, by Application 2020 & 2033
- Table 5: Global E Payment Revenue undefined Forecast, by Type 2020 & 2033
- Table 6: Global E Payment Revenue undefined Forecast, by Country 2020 & 2033
- Table 7: United States E Payment Revenue (undefined) Forecast, by Application 2020 & 2033
- Table 8: Canada E Payment Revenue (undefined) Forecast, by Application 2020 & 2033
- Table 9: Mexico E Payment Revenue (undefined) Forecast, by Application 2020 & 2033
- Table 10: Global E Payment Revenue undefined Forecast, by Application 2020 & 2033
- Table 11: Global E Payment Revenue undefined Forecast, by Type 2020 & 2033
- Table 12: Global E Payment Revenue undefined Forecast, by Country 2020 & 2033
- Table 13: Brazil E Payment Revenue (undefined) Forecast, by Application 2020 & 2033
- Table 14: Argentina E Payment Revenue (undefined) Forecast, by Application 2020 & 2033
- Table 15: Rest of South America E Payment Revenue (undefined) Forecast, by Application 2020 & 2033
- Table 16: Global E Payment Revenue undefined Forecast, by Application 2020 & 2033
- Table 17: Global E Payment Revenue undefined Forecast, by Type 2020 & 2033
- Table 18: Global E Payment Revenue undefined Forecast, by Country 2020 & 2033
- Table 19: United Kingdom E Payment Revenue (undefined) Forecast, by Application 2020 & 2033
- Table 20: Germany E Payment Revenue (undefined) Forecast, by Application 2020 & 2033
- Table 21: France E Payment Revenue (undefined) Forecast, by Application 2020 & 2033
- Table 22: Italy E Payment Revenue (undefined) Forecast, by Application 2020 & 2033
- Table 23: Spain E Payment Revenue (undefined) Forecast, by Application 2020 & 2033
- Table 24: Russia E Payment Revenue (undefined) Forecast, by Application 2020 & 2033
- Table 25: Benelux E Payment Revenue (undefined) Forecast, by Application 2020 & 2033
- Table 26: Nordics E Payment Revenue (undefined) Forecast, by Application 2020 & 2033
- Table 27: Rest of Europe E Payment Revenue (undefined) Forecast, by Application 2020 & 2033
- Table 28: Global E Payment Revenue undefined Forecast, by Application 2020 & 2033
- Table 29: Global E Payment Revenue undefined Forecast, by Type 2020 & 2033
- Table 30: Global E Payment Revenue undefined Forecast, by Country 2020 & 2033
- Table 31: Turkey E Payment Revenue (undefined) Forecast, by Application 2020 & 2033
- Table 32: Israel E Payment Revenue (undefined) Forecast, by Application 2020 & 2033
- Table 33: GCC E Payment Revenue (undefined) Forecast, by Application 2020 & 2033
- Table 34: North Africa E Payment Revenue (undefined) Forecast, by Application 2020 & 2033
- Table 35: South Africa E Payment Revenue (undefined) Forecast, by Application 2020 & 2033
- Table 36: Rest of Middle East & Africa E Payment Revenue (undefined) Forecast, by Application 2020 & 2033
- Table 37: Global E Payment Revenue undefined Forecast, by Application 2020 & 2033
- Table 38: Global E Payment Revenue undefined Forecast, by Type 2020 & 2033
- Table 39: Global E Payment Revenue undefined Forecast, by Country 2020 & 2033
- Table 40: China E Payment Revenue (undefined) Forecast, by Application 2020 & 2033
- Table 41: India E Payment Revenue (undefined) Forecast, by Application 2020 & 2033
- Table 42: Japan E Payment Revenue (undefined) Forecast, by Application 2020 & 2033
- Table 43: South Korea E Payment Revenue (undefined) Forecast, by Application 2020 & 2033
- Table 44: ASEAN E Payment Revenue (undefined) Forecast, by Application 2020 & 2033
- Table 45: Oceania E Payment Revenue (undefined) Forecast, by Application 2020 & 2033
- Table 46: Rest of Asia Pacific E Payment Revenue (undefined) Forecast, by Application 2020 & 2033
Frequently Asked Questions
1. What is the projected Compound Annual Growth Rate (CAGR) of the E Payment?
The projected CAGR is approximately 13.59%.
2. Which companies are prominent players in the E Payment?
Key companies in the market include Bolt, Brex, Flywire, Forter, Marqeta, Plaid, Poynt, Remitly, Stripe, Toast, Tradeshift, TransferWise, Ant Financial, Circle, Braintree, Aeropay, DailyPay, PayPal, Ripple, Affirm, DOXO, Q2ebanking, Toss.
3. What are the main segments of the E Payment?
The market segments include Application, Type.
4. Can you provide details about the market size?
The market size is estimated to be USD XXX N/A as of 2022.
5. What are some drivers contributing to market growth?
N/A
6. What are the notable trends driving market growth?
N/A
7. Are there any restraints impacting market growth?
N/A
8. Can you provide examples of recent developments in the market?
N/A
9. What pricing options are available for accessing the report?
Pricing options include single-user, multi-user, and enterprise licenses priced at USD 3950.00, USD 5925.00, and USD 7900.00 respectively.
10. Is the market size provided in terms of value or volume?
The market size is provided in terms of value, measured in N/A.
11. Are there any specific market keywords associated with the report?
Yes, the market keyword associated with the report is "E Payment," which aids in identifying and referencing the specific market segment covered.
12. How do I determine which pricing option suits my needs best?
The pricing options vary based on user requirements and access needs. Individual users may opt for single-user licenses, while businesses requiring broader access may choose multi-user or enterprise licenses for cost-effective access to the report.
13. Are there any additional resources or data provided in the E Payment report?
While the report offers comprehensive insights, it's advisable to review the specific contents or supplementary materials provided to ascertain if additional resources or data are available.
14. How can I stay updated on further developments or reports in the E Payment?
To stay informed about further developments, trends, and reports in the E Payment, consider subscribing to industry newsletters, following relevant companies and organizations, or regularly checking reputable industry news sources and publications.
Methodology
Step 1 - Identification of Relevant Samples Size from Population Database


Step 2 - Approaches for Defining Global Market Size (Value, Volume* & Price*)

Note*: In applicable scenarios
Step 3 - Data Sources
Primary Research
- Web Analytics
- Survey Reports
- Research Institute
- Latest Research Reports
- Opinion Leaders
Secondary Research
- Annual Reports
- White Paper
- Latest Press Release
- Industry Association
- Paid Database
- Investor Presentations

Step 4 - Data Triangulation
Involves using different sources of information in order to increase the validity of a study
These sources are likely to be stakeholders in a program - participants, other researchers, program staff, other community members, and so on.
Then we put all data in single framework & apply various statistical tools to find out the dynamic on the market.
During the analysis stage, feedback from the stakeholder groups would be compared to determine areas of agreement as well as areas of divergence