
Key Insights
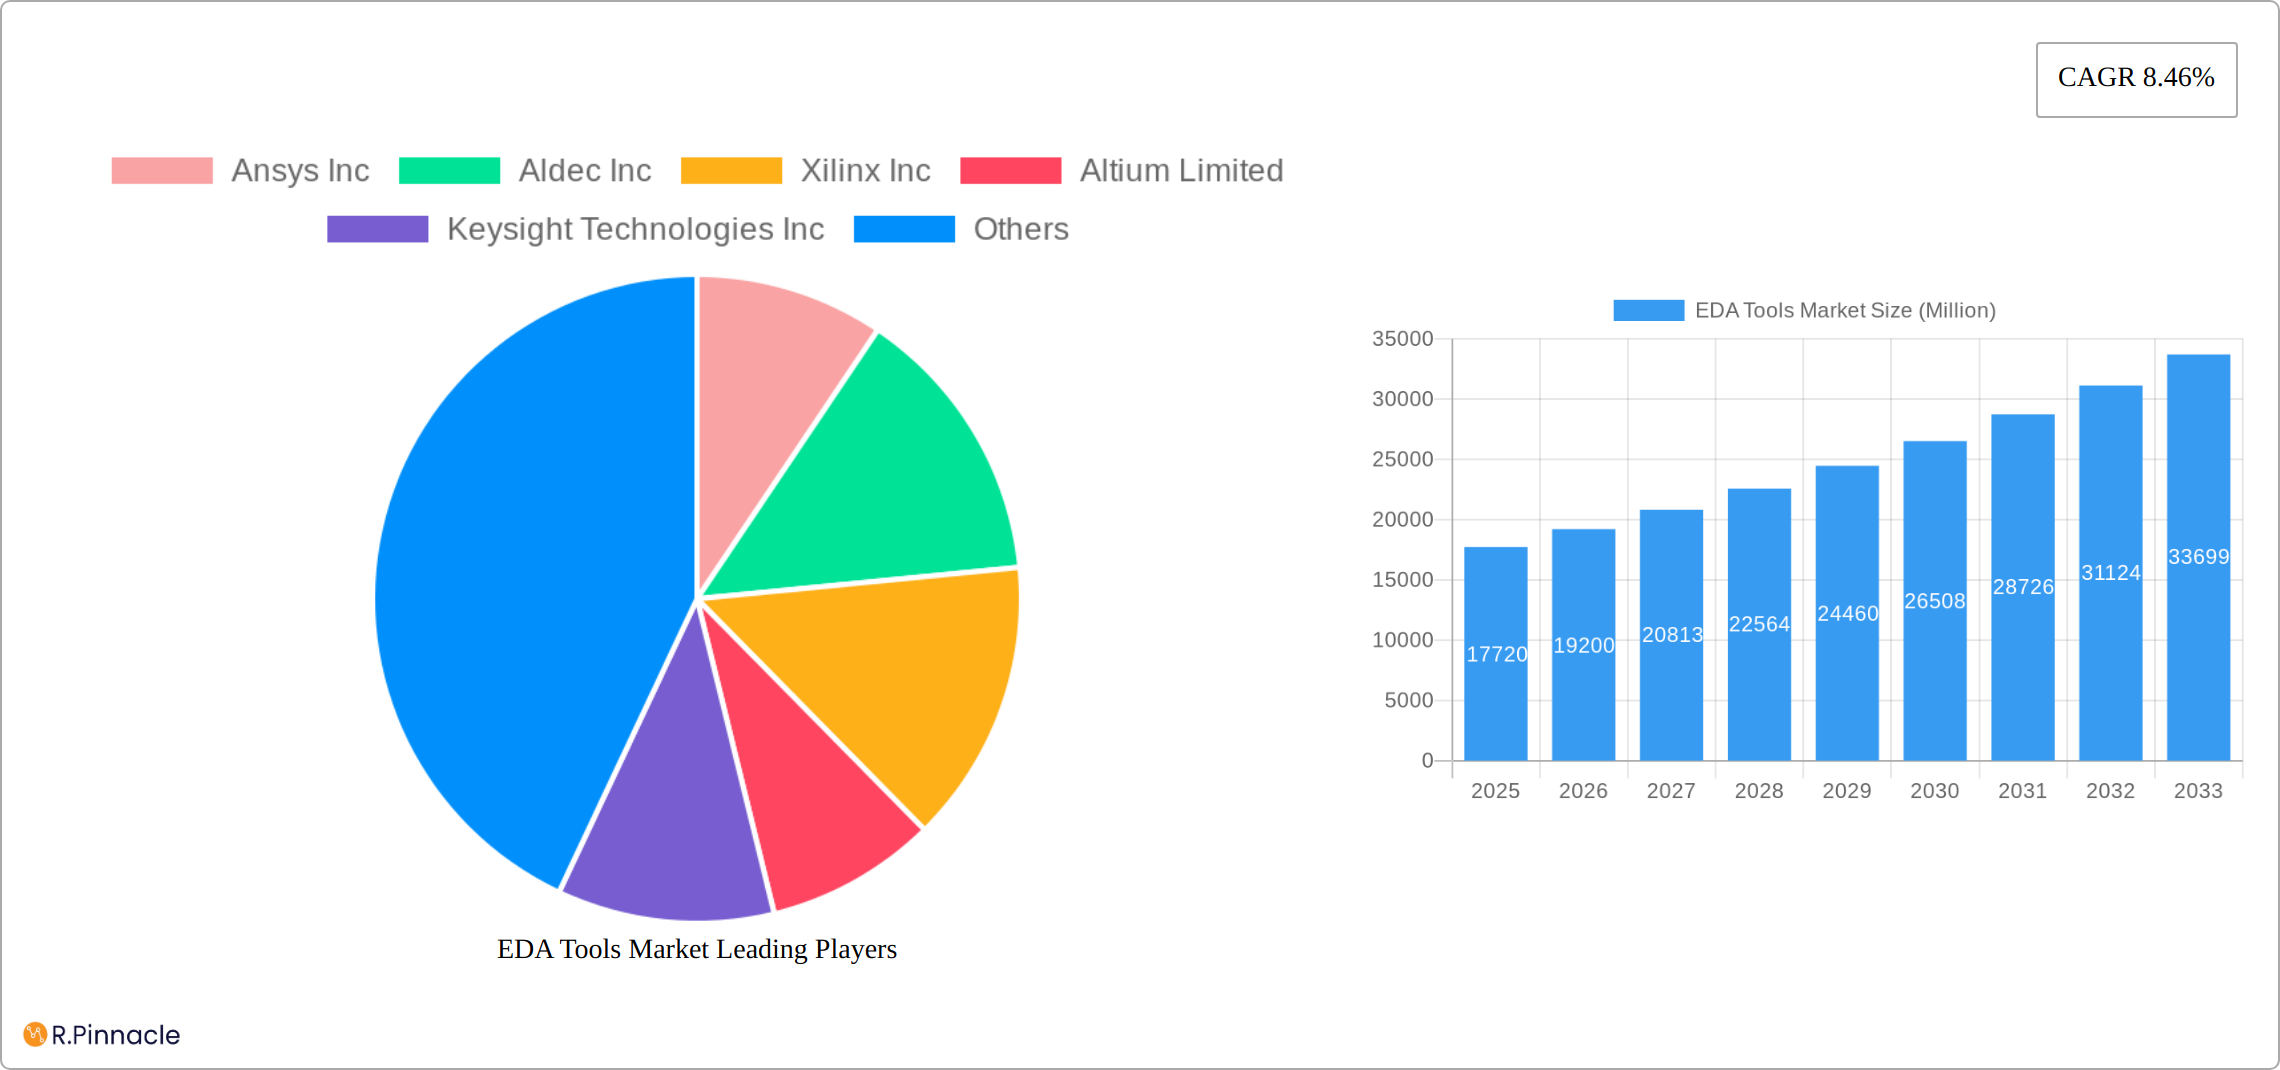
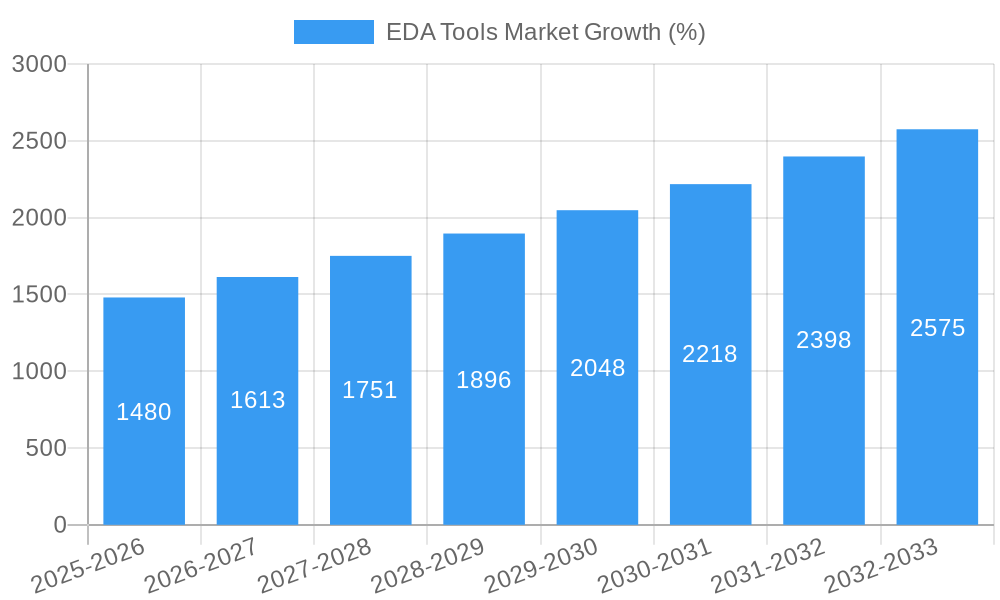
The Electronic Design Automation (EDA) tools market is experiencing robust growth, projected to reach a market size of $17.72 billion in 2025, expanding at a Compound Annual Growth Rate (CAGR) of 8.46%. This expansion is fueled by several key drivers. The increasing complexity of integrated circuits (ICs) necessitates sophisticated EDA tools for efficient design and verification. Furthermore, the burgeoning demand for advanced technologies like 5G, artificial intelligence (AI), and the Internet of Things (IoT) is driving the adoption of EDA tools across various sectors. The automotive industry, for instance, is witnessing significant growth due to the increasing integration of electronics in vehicles, leading to higher demand for PCB and MCM design tools. Similarly, the communication sector's need for faster and more efficient networks is driving the adoption of CAE and IC physical design tools. Growth is also spurred by the rising adoption of cloud-based EDA solutions, offering improved scalability and collaboration among design teams.
However, the market faces certain restraints. High initial investment costs for advanced EDA software can be a barrier to entry for smaller companies. Furthermore, the continuous evolution of semiconductor technology requires constant updates and upgrades to EDA tools, which can contribute to ongoing expenses. Despite these challenges, the long-term outlook for the EDA tools market remains positive, driven by sustained technological advancements and a broadening range of applications across diverse industries. The market segmentation reveals strong growth across all application areas, with communication, consumer electronics, and automotive sectors leading the demand. North America currently holds a significant market share, but the Asia-Pacific region is expected to witness substantial growth driven by increasing semiconductor manufacturing and technological advancements within the region. The competitive landscape is characterized by a mix of established players and emerging companies, fostering innovation and competition within the market.
EDA Tools Market: A Comprehensive Report (2019-2033)
This in-depth report provides a comprehensive analysis of the EDA Tools market, offering valuable insights for industry professionals, investors, and strategic decision-makers. Covering the period from 2019 to 2033, with a focus on 2025, this report meticulously examines market dynamics, competitive landscapes, and future growth potential. The report leverages extensive research and data analysis to provide actionable intelligence for navigating this rapidly evolving market. The market is valued at xx Million in 2025 and is projected to reach xx Million by 2033, exhibiting a CAGR of xx%.
EDA Tools Market Structure & Innovation Trends
The EDA tools market is characterized by a moderately concentrated structure, with a few major players holding significant market share. However, the presence of numerous smaller, specialized firms fosters innovation and competition. Market share data for 2025 reveals that Synopsys Inc. holds approximately xx% of the market, followed by Cadence Design Systems Inc. with approximately xx%, and Ansys Inc. with approximately xx%. The remaining market share is distributed among other key players including Aldec Inc, Xilinx Inc, Altium Limited, Keysight Technologies Inc, Mentor Graphic Corporation (Siemens PLM Software), Lauterbach GmbH, Agnisys Inc, and Zuken Ltd.
Innovation is driven by the increasing complexity of integrated circuits (ICs), the demand for faster design cycles, and the emergence of new technologies like 5G, AI, and quantum computing. Regulatory frameworks, particularly those related to data privacy and security, are increasingly influencing the development and adoption of EDA tools. Product substitutes, such as custom-designed hardware solutions, are limited due to the specialized nature of EDA tools. End-user demographics include semiconductor manufacturers, electronics design houses, and research institutions globally.
Mergers and acquisitions (M&A) activities are significant in shaping the market landscape. Notable deals include:
- July 2022: Cadence Design Systems, Inc.'s acquisition of Future Facilities, significantly expanding its capabilities in CFD and multiphysics system analysis. The deal value was xx Million.
- May 2021: Siemens Digital Industries Software's acquisition of Fractal Technologies, enhancing its IC verification offerings. The deal value was xx Million.
- May 2021: Keysight Technologies Inc.'s acquisition of Quantum Benchmark, strengthening its position in quantum computing software. The deal value was xx Million.
These M&A activities highlight the consolidation trend within the industry and the strategic importance of expanding capabilities and technological expertise. Overall, the market structure is dynamic, reflecting ongoing innovation and strategic partnerships.
EDA Tools Market Dynamics & Trends
The EDA tools market is experiencing robust growth, driven by several key factors. The increasing demand for advanced electronic devices across diverse sectors, including communication, consumer electronics, automotive, and industrial applications, fuels the need for sophisticated design tools. Technological advancements, such as the development of artificial intelligence (AI)-powered EDA tools, are accelerating design automation and efficiency. Furthermore, the growing adoption of cloud-based EDA solutions enhances accessibility and collaboration among design teams. Consumer preferences for faster, more energy-efficient, and feature-rich electronic devices exert significant pressure on manufacturers to shorten design cycles and enhance product quality—EDA tools play a critical role in achieving these goals. The competitive dynamics are characterized by fierce competition among established players and the emergence of new entrants offering innovative solutions. The market is experiencing a shift towards software-centric solutions. The current market value is estimated at xx Million in 2025, and the forecast suggests substantial growth in the coming years, with a projected CAGR of xx% during 2025-2033. Market penetration is particularly high in developed regions like North America and Europe, but it is steadily increasing in developing economies. The rising complexity of semiconductor designs, along with advancements in areas such as artificial intelligence and machine learning (AI/ML), drives the demand for more advanced EDA solutions.
Dominant Regions & Segments in EDA Tools Market
North America currently holds the largest share of the EDA tools market, driven by a strong presence of major EDA vendors, extensive research and development activities, and high adoption rates in various industries. Asia-Pacific is projected to experience the fastest growth rate, fueled by rapid technological advancements, expanding electronics manufacturing capabilities, and significant investments in the semiconductor industry.
Key Drivers:
- North America: Strong semiconductor industry, high R&D spending, early adoption of advanced technologies.
- Europe: Established electronics manufacturing base, presence of several key players, robust government support for technology innovation.
- Asia-Pacific: Rapid growth of electronics manufacturing, substantial investments in R&D, increasing demand from emerging economies.
Dominant Segments:
- Type: IC Physical Design and Verification is currently the largest segment, driven by the increasing complexity of integrated circuits. The Computer-aided Engineering (CAE) segment also contributes significantly, followed by Printed Circuit Board and Multi-chip Module (PCB and MCM). The Semiconductor Intellectual Property (SIP) and Services segments are also experiencing growth.
- Application: The Communication and Consumer Electronics sectors are the major consumers of EDA tools, given the massive scale of product innovation in these sectors. The Automotive and Industrial applications are witnessing faster growth rates driven by electrification trends and automation.
The dominance of these segments is driven by the high volume of IC designs, the complexity of modern electronics systems, and the critical need for efficient and reliable design processes. The growth of each segment is closely tied to industry trends like the increased adoption of advanced technologies and the global expansion of electronic manufacturing.
EDA Tools Market Product Innovations
Recent product innovations include the integration of AI and machine learning algorithms to improve design automation, optimization, and verification capabilities. Cloud-based EDA platforms are gaining traction, enabling collaboration and accessibility. New tools are emerging to support the design of advanced semiconductor technologies, such as quantum computing and 3D integrated circuits. These innovations offer significant competitive advantages by shortening design cycles, reducing costs, and enhancing product quality. The market is witnessing a shift toward more sophisticated tools offering high accuracy, efficiency, and integration capabilities. This focus on advanced functionalities enhances the competitiveness of EDA providers and provides greater value to end-users.
Report Scope & Segmentation Analysis
This report covers the global EDA tools market, segmented by type (Computer-aided Engineering (CAE), IC Physical Design and Verification, Printed Circuit Board and Multi-chip Module (PCB and MCM), Semiconductor Intellectual Property (SIP), Services) and application (Communication, Consumer Electronics, Automotive, Industrial, Other Applications). Each segment is analyzed in terms of its market size, growth rate, and competitive landscape. For example, the IC Physical Design and Verification segment is projected to witness a substantial growth due to increased complexity of semiconductor designs. The Services segment is anticipated to grow steadily due to growing need for design and verification support. Competitive dynamics within each segment vary, with some characterized by intense competition among established players and others exhibiting a more fragmented structure with opportunities for new entrants.
Key Drivers of EDA Tools Market Growth
The key drivers of the EDA tools market growth include increasing demand for advanced electronic devices across various industries, the growing complexity of integrated circuits, and the need for efficient design automation. Advancements in technologies such as AI and machine learning are enhancing the capabilities of EDA tools, leading to increased adoption. Government initiatives and investments in research and development also play a crucial role in promoting the growth of the market. The shift towards software-defined electronics and cloud-based solutions is also contributing to market expansion.
Challenges in the EDA Tools Market Sector
The EDA tools market faces several challenges, including the high cost of software licenses, the need for specialized skills and expertise, and the complexity of integrating various tools within the design flow. Supply chain disruptions and geopolitical uncertainties also pose significant challenges. Intense competition from established players and the emergence of new entrants creates pressures on pricing and profitability. These challenges necessitate strategic investments in R&D, skilled workforce development, and flexible supply chain management to mitigate these risks. The increasing complexity of electronic systems also leads to longer design cycles and higher validation costs.
Emerging Opportunities in EDA Tools Market
Emerging opportunities lie in the development of EDA tools for emerging technologies, such as quantum computing, neuromorphic computing, and advanced packaging technologies. The growing demand for efficient and sustainable electronics is driving the need for EDA tools that support power optimization and reduced environmental impact. Expansion into new geographic markets, especially in developing economies, presents significant growth potential. The development of cloud-based EDA platforms and the integration of AI and ML algorithms will open new opportunities for innovation.
Leading Players in the EDA Tools Market Market
- Ansys Inc
- Aldec Inc
- Xilinx Inc
- Altium Limited
- Keysight Technologies Inc
- Mentor Graphic Corporation (Siemens PLM Software)
- Synopsys Inc
- Cadence Design Systems Inc
- Lauterbach GmbH
- Agnisys Inc
- Zuken Ltd
Key Developments in EDA Tools Market Industry
- July 2022: Cadence Design Systems, Inc. acquires Future Facilities, enhancing its capabilities in CFD and multiphysics system analysis.
- April 2022: Keysight Technologies, Inc. joins the Si2 TITAN advisory council, contributing expertise in radio frequency and microwave applications.
- May 2021: Siemens Digital Industries Software acquires Fractal Technologies, improving its IC validation offerings.
- May 2021: Keysight Technologies Inc. acquires Quantum Benchmark, expanding its capabilities in quantum computing software.
These acquisitions demonstrate the ongoing consolidation and technological advancements within the EDA tools industry.
Future Outlook for EDA Tools Market Market
The future outlook for the EDA tools market is positive, driven by sustained growth in the electronics industry, technological advancements, and increased demand for advanced design capabilities. The growing adoption of cloud-based solutions, the integration of AI and machine learning, and the expansion into new applications, such as quantum computing and neuromorphic computing, will further propel market growth. Strategic partnerships and collaborations among EDA vendors, semiconductor manufacturers, and research institutions will play a crucial role in shaping the future of the industry. The focus on efficient design flows and faster time-to-market will drive demand for innovative EDA tools and services.
EDA Tools Market Segmentation
-
1. Type
- 1.1. Computer-aided Engineering (CAE)
- 1.2. IC Physical Design and Verification
- 1.3. Printed
- 1.4. Semiconductor Intellectual Property (SIP)
- 1.5. Services
-
2. Application
- 2.1. Communication
- 2.2. Consumer Electronics
- 2.3. Automotive
- 2.4. Industrial
- 2.5. Other Applications
-
3. End-user
- 3.1. Semiconductor manufacturers
- 3.2. Electronics manufacturers
- 3.3. Design houses
- 3.4. Research institutions
EDA Tools Market Segmentation By Geography
- 1. North America
- 2. Europe
- 3. Asia Pacific
- 4. Rest of the World

EDA Tools Market REPORT HIGHLIGHTS
| Aspects | Details |
|---|---|
| Study Period | 2019-2033 |
| Base Year | 2024 |
| Estimated Year | 2025 |
| Forecast Period | 2025-2033 |
| Historical Period | 2019-2024 |
| Growth Rate | CAGR of 8.46% from 2019-2033 |
| Segmentation |
|
Table of Contents
- 1. Introduction
- 1.1. Research Scope
- 1.2. Market Segmentation
- 1.3. Research Methodology
- 1.4. Definitions and Assumptions
- 2. Executive Summary
- 2.1. Introduction
- 3. Market Dynamics
- 3.1. Introduction
- 3.2. Market Drivers
- 3.2.1 Booming Automotive
- 3.2.2 IoT
- 3.2.3 and AI Sectors; Upcoming Trend of EDA Toolsets Equipped with Machine Learning Capabilities
- 3.3. Market Restrains
- 3.3.1. Moore's Law about to be Proven Faulty
- 3.4. Market Trends
- 3.4.1. IC Physical Design and Verification Segment to Grow Significantly
- 4. Market Factor Analysis
- 4.1. Porters Five Forces
- 4.2. Supply/Value Chain
- 4.3. PESTEL analysis
- 4.4. Market Entropy
- 4.5. Patent/Trademark Analysis
- 5. Global EDA Tools Market Analysis, Insights and Forecast, 2019-2031
- 5.1. Market Analysis, Insights and Forecast - by Type
- 5.1.1. Computer-aided Engineering (CAE)
- 5.1.2. IC Physical Design and Verification
- 5.1.3. Printed
- 5.1.4. Semiconductor Intellectual Property (SIP)
- 5.1.5. Services
- 5.2. Market Analysis, Insights and Forecast - by Application
- 5.2.1. Communication
- 5.2.2. Consumer Electronics
- 5.2.3. Automotive
- 5.2.4. Industrial
- 5.2.5. Other Applications
- 5.3. Market Analysis, Insights and Forecast - by End-user
- 5.3.1. Semiconductor manufacturers
- 5.3.2. Electronics manufacturers
- 5.3.3. Design houses
- 5.3.4. Research institutions
- 5.4. Market Analysis, Insights and Forecast - by Region
- 5.4.1. North America
- 5.4.2. Europe
- 5.4.3. Asia Pacific
- 5.4.4. Rest of the World
- 5.1. Market Analysis, Insights and Forecast - by Type
- 6. North America EDA Tools Market Analysis, Insights and Forecast, 2019-2031
- 6.1. Market Analysis, Insights and Forecast - by Type
- 6.1.1. Computer-aided Engineering (CAE)
- 6.1.2. IC Physical Design and Verification
- 6.1.3. Printed
- 6.1.4. Semiconductor Intellectual Property (SIP)
- 6.1.5. Services
- 6.2. Market Analysis, Insights and Forecast - by Application
- 6.2.1. Communication
- 6.2.2. Consumer Electronics
- 6.2.3. Automotive
- 6.2.4. Industrial
- 6.2.5. Other Applications
- 6.3. Market Analysis, Insights and Forecast - by End-user
- 6.3.1. Semiconductor manufacturers
- 6.3.2. Electronics manufacturers
- 6.3.3. Design houses
- 6.3.4. Research institutions
- 6.1. Market Analysis, Insights and Forecast - by Type
- 7. Europe EDA Tools Market Analysis, Insights and Forecast, 2019-2031
- 7.1. Market Analysis, Insights and Forecast - by Type
- 7.1.1. Computer-aided Engineering (CAE)
- 7.1.2. IC Physical Design and Verification
- 7.1.3. Printed
- 7.1.4. Semiconductor Intellectual Property (SIP)
- 7.1.5. Services
- 7.2. Market Analysis, Insights and Forecast - by Application
- 7.2.1. Communication
- 7.2.2. Consumer Electronics
- 7.2.3. Automotive
- 7.2.4. Industrial
- 7.2.5. Other Applications
- 7.3. Market Analysis, Insights and Forecast - by End-user
- 7.3.1. Semiconductor manufacturers
- 7.3.2. Electronics manufacturers
- 7.3.3. Design houses
- 7.3.4. Research institutions
- 7.1. Market Analysis, Insights and Forecast - by Type
- 8. Asia Pacific EDA Tools Market Analysis, Insights and Forecast, 2019-2031
- 8.1. Market Analysis, Insights and Forecast - by Type
- 8.1.1. Computer-aided Engineering (CAE)
- 8.1.2. IC Physical Design and Verification
- 8.1.3. Printed
- 8.1.4. Semiconductor Intellectual Property (SIP)
- 8.1.5. Services
- 8.2. Market Analysis, Insights and Forecast - by Application
- 8.2.1. Communication
- 8.2.2. Consumer Electronics
- 8.2.3. Automotive
- 8.2.4. Industrial
- 8.2.5. Other Applications
- 8.3. Market Analysis, Insights and Forecast - by End-user
- 8.3.1. Semiconductor manufacturers
- 8.3.2. Electronics manufacturers
- 8.3.3. Design houses
- 8.3.4. Research institutions
- 8.1. Market Analysis, Insights and Forecast - by Type
- 9. Rest of the World EDA Tools Market Analysis, Insights and Forecast, 2019-2031
- 9.1. Market Analysis, Insights and Forecast - by Type
- 9.1.1. Computer-aided Engineering (CAE)
- 9.1.2. IC Physical Design and Verification
- 9.1.3. Printed
- 9.1.4. Semiconductor Intellectual Property (SIP)
- 9.1.5. Services
- 9.2. Market Analysis, Insights and Forecast - by Application
- 9.2.1. Communication
- 9.2.2. Consumer Electronics
- 9.2.3. Automotive
- 9.2.4. Industrial
- 9.2.5. Other Applications
- 9.3. Market Analysis, Insights and Forecast - by End-user
- 9.3.1. Semiconductor manufacturers
- 9.3.2. Electronics manufacturers
- 9.3.3. Design houses
- 9.3.4. Research institutions
- 9.1. Market Analysis, Insights and Forecast - by Type
- 10. North America EDA Tools Market Analysis, Insights and Forecast, 2019-2031
- 10.1. Market Analysis, Insights and Forecast - By Country/Sub-region
- 10.1.1 United States
- 10.1.2 Canada
- 10.1.3 Mexico
- 11. Europe EDA Tools Market Analysis, Insights and Forecast, 2019-2031
- 11.1. Market Analysis, Insights and Forecast - By Country/Sub-region
- 11.1.1 Germany
- 11.1.2 United Kingdom
- 11.1.3 France
- 11.1.4 Spain
- 11.1.5 Italy
- 11.1.6 Spain
- 11.1.7 Belgium
- 11.1.8 Netherland
- 11.1.9 Nordics
- 11.1.10 Rest of Europe
- 12. Asia Pacific EDA Tools Market Analysis, Insights and Forecast, 2019-2031
- 12.1. Market Analysis, Insights and Forecast - By Country/Sub-region
- 12.1.1 China
- 12.1.2 Japan
- 12.1.3 India
- 12.1.4 South Korea
- 12.1.5 Southeast Asia
- 12.1.6 Australia
- 12.1.7 Indonesia
- 12.1.8 Phillipes
- 12.1.9 Singapore
- 12.1.10 Thailandc
- 12.1.11 Rest of Asia Pacific
- 13. South America EDA Tools Market Analysis, Insights and Forecast, 2019-2031
- 13.1. Market Analysis, Insights and Forecast - By Country/Sub-region
- 13.1.1 Brazil
- 13.1.2 Argentina
- 13.1.3 Peru
- 13.1.4 Chile
- 13.1.5 Colombia
- 13.1.6 Ecuador
- 13.1.7 Venezuela
- 13.1.8 Rest of South America
- 14. North America EDA Tools Market Analysis, Insights and Forecast, 2019-2031
- 14.1. Market Analysis, Insights and Forecast - By Country/Sub-region
- 14.1.1 United States
- 14.1.2 Canada
- 14.1.3 Mexico
- 15. MEA EDA Tools Market Analysis, Insights and Forecast, 2019-2031
- 15.1. Market Analysis, Insights and Forecast - By Country/Sub-region
- 15.1.1 United Arab Emirates
- 15.1.2 Saudi Arabia
- 15.1.3 South Africa
- 15.1.4 Rest of Middle East and Africa
- 16. Competitive Analysis
- 16.1. Global Market Share Analysis 2024
- 16.2. Company Profiles
- 16.2.1 Ansys Inc
- 16.2.1.1. Overview
- 16.2.1.2. Products
- 16.2.1.3. SWOT Analysis
- 16.2.1.4. Recent Developments
- 16.2.1.5. Financials (Based on Availability)
- 16.2.2 Aldec Inc
- 16.2.2.1. Overview
- 16.2.2.2. Products
- 16.2.2.3. SWOT Analysis
- 16.2.2.4. Recent Developments
- 16.2.2.5. Financials (Based on Availability)
- 16.2.3 Xilinx Inc
- 16.2.3.1. Overview
- 16.2.3.2. Products
- 16.2.3.3. SWOT Analysis
- 16.2.3.4. Recent Developments
- 16.2.3.5. Financials (Based on Availability)
- 16.2.4 Altium Limited
- 16.2.4.1. Overview
- 16.2.4.2. Products
- 16.2.4.3. SWOT Analysis
- 16.2.4.4. Recent Developments
- 16.2.4.5. Financials (Based on Availability)
- 16.2.5 Keysight Technologies Inc
- 16.2.5.1. Overview
- 16.2.5.2. Products
- 16.2.5.3. SWOT Analysis
- 16.2.5.4. Recent Developments
- 16.2.5.5. Financials (Based on Availability)
- 16.2.6 Mentor Graphic Corporation (Siemens PLM Software)
- 16.2.6.1. Overview
- 16.2.6.2. Products
- 16.2.6.3. SWOT Analysis
- 16.2.6.4. Recent Developments
- 16.2.6.5. Financials (Based on Availability)
- 16.2.7 Synopsys Inc
- 16.2.7.1. Overview
- 16.2.7.2. Products
- 16.2.7.3. SWOT Analysis
- 16.2.7.4. Recent Developments
- 16.2.7.5. Financials (Based on Availability)
- 16.2.8 Cadence Design Systems Inc
- 16.2.8.1. Overview
- 16.2.8.2. Products
- 16.2.8.3. SWOT Analysis
- 16.2.8.4. Recent Developments
- 16.2.8.5. Financials (Based on Availability)
- 16.2.9 Lauterbach GmbH
- 16.2.9.1. Overview
- 16.2.9.2. Products
- 16.2.9.3. SWOT Analysis
- 16.2.9.4. Recent Developments
- 16.2.9.5. Financials (Based on Availability)
- 16.2.10 Agnisys Inc
- 16.2.10.1. Overview
- 16.2.10.2. Products
- 16.2.10.3. SWOT Analysis
- 16.2.10.4. Recent Developments
- 16.2.10.5. Financials (Based on Availability)
- 16.2.11 Zuken Ltd
- 16.2.11.1. Overview
- 16.2.11.2. Products
- 16.2.11.3. SWOT Analysis
- 16.2.11.4. Recent Developments
- 16.2.11.5. Financials (Based on Availability)
- 16.2.1 Ansys Inc
List of Figures
- Figure 1: Global EDA Tools Market Revenue Breakdown (Million, %) by Region 2024 & 2032
- Figure 2: Global EDA Tools Market Volume Breakdown (K Unit, %) by Region 2024 & 2032
- Figure 3: North America EDA Tools Market Revenue (Million), by Country 2024 & 2032
- Figure 4: North America EDA Tools Market Volume (K Unit), by Country 2024 & 2032
- Figure 5: North America EDA Tools Market Revenue Share (%), by Country 2024 & 2032
- Figure 6: North America EDA Tools Market Volume Share (%), by Country 2024 & 2032
- Figure 7: Europe EDA Tools Market Revenue (Million), by Country 2024 & 2032
- Figure 8: Europe EDA Tools Market Volume (K Unit), by Country 2024 & 2032
- Figure 9: Europe EDA Tools Market Revenue Share (%), by Country 2024 & 2032
- Figure 10: Europe EDA Tools Market Volume Share (%), by Country 2024 & 2032
- Figure 11: Asia Pacific EDA Tools Market Revenue (Million), by Country 2024 & 2032
- Figure 12: Asia Pacific EDA Tools Market Volume (K Unit), by Country 2024 & 2032
- Figure 13: Asia Pacific EDA Tools Market Revenue Share (%), by Country 2024 & 2032
- Figure 14: Asia Pacific EDA Tools Market Volume Share (%), by Country 2024 & 2032
- Figure 15: South America EDA Tools Market Revenue (Million), by Country 2024 & 2032
- Figure 16: South America EDA Tools Market Volume (K Unit), by Country 2024 & 2032
- Figure 17: South America EDA Tools Market Revenue Share (%), by Country 2024 & 2032
- Figure 18: South America EDA Tools Market Volume Share (%), by Country 2024 & 2032
- Figure 19: North America EDA Tools Market Revenue (Million), by Country 2024 & 2032
- Figure 20: North America EDA Tools Market Volume (K Unit), by Country 2024 & 2032
- Figure 21: North America EDA Tools Market Revenue Share (%), by Country 2024 & 2032
- Figure 22: North America EDA Tools Market Volume Share (%), by Country 2024 & 2032
- Figure 23: MEA EDA Tools Market Revenue (Million), by Country 2024 & 2032
- Figure 24: MEA EDA Tools Market Volume (K Unit), by Country 2024 & 2032
- Figure 25: MEA EDA Tools Market Revenue Share (%), by Country 2024 & 2032
- Figure 26: MEA EDA Tools Market Volume Share (%), by Country 2024 & 2032
- Figure 27: North America EDA Tools Market Revenue (Million), by Type 2024 & 2032
- Figure 28: North America EDA Tools Market Volume (K Unit), by Type 2024 & 2032
- Figure 29: North America EDA Tools Market Revenue Share (%), by Type 2024 & 2032
- Figure 30: North America EDA Tools Market Volume Share (%), by Type 2024 & 2032
- Figure 31: North America EDA Tools Market Revenue (Million), by Application 2024 & 2032
- Figure 32: North America EDA Tools Market Volume (K Unit), by Application 2024 & 2032
- Figure 33: North America EDA Tools Market Revenue Share (%), by Application 2024 & 2032
- Figure 34: North America EDA Tools Market Volume Share (%), by Application 2024 & 2032
- Figure 35: North America EDA Tools Market Revenue (Million), by End-user 2024 & 2032
- Figure 36: North America EDA Tools Market Volume (K Unit), by End-user 2024 & 2032
- Figure 37: North America EDA Tools Market Revenue Share (%), by End-user 2024 & 2032
- Figure 38: North America EDA Tools Market Volume Share (%), by End-user 2024 & 2032
- Figure 39: North America EDA Tools Market Revenue (Million), by Country 2024 & 2032
- Figure 40: North America EDA Tools Market Volume (K Unit), by Country 2024 & 2032
- Figure 41: North America EDA Tools Market Revenue Share (%), by Country 2024 & 2032
- Figure 42: North America EDA Tools Market Volume Share (%), by Country 2024 & 2032
- Figure 43: Europe EDA Tools Market Revenue (Million), by Type 2024 & 2032
- Figure 44: Europe EDA Tools Market Volume (K Unit), by Type 2024 & 2032
- Figure 45: Europe EDA Tools Market Revenue Share (%), by Type 2024 & 2032
- Figure 46: Europe EDA Tools Market Volume Share (%), by Type 2024 & 2032
- Figure 47: Europe EDA Tools Market Revenue (Million), by Application 2024 & 2032
- Figure 48: Europe EDA Tools Market Volume (K Unit), by Application 2024 & 2032
- Figure 49: Europe EDA Tools Market Revenue Share (%), by Application 2024 & 2032
- Figure 50: Europe EDA Tools Market Volume Share (%), by Application 2024 & 2032
- Figure 51: Europe EDA Tools Market Revenue (Million), by End-user 2024 & 2032
- Figure 52: Europe EDA Tools Market Volume (K Unit), by End-user 2024 & 2032
- Figure 53: Europe EDA Tools Market Revenue Share (%), by End-user 2024 & 2032
- Figure 54: Europe EDA Tools Market Volume Share (%), by End-user 2024 & 2032
- Figure 55: Europe EDA Tools Market Revenue (Million), by Country 2024 & 2032
- Figure 56: Europe EDA Tools Market Volume (K Unit), by Country 2024 & 2032
- Figure 57: Europe EDA Tools Market Revenue Share (%), by Country 2024 & 2032
- Figure 58: Europe EDA Tools Market Volume Share (%), by Country 2024 & 2032
- Figure 59: Asia Pacific EDA Tools Market Revenue (Million), by Type 2024 & 2032
- Figure 60: Asia Pacific EDA Tools Market Volume (K Unit), by Type 2024 & 2032
- Figure 61: Asia Pacific EDA Tools Market Revenue Share (%), by Type 2024 & 2032
- Figure 62: Asia Pacific EDA Tools Market Volume Share (%), by Type 2024 & 2032
- Figure 63: Asia Pacific EDA Tools Market Revenue (Million), by Application 2024 & 2032
- Figure 64: Asia Pacific EDA Tools Market Volume (K Unit), by Application 2024 & 2032
- Figure 65: Asia Pacific EDA Tools Market Revenue Share (%), by Application 2024 & 2032
- Figure 66: Asia Pacific EDA Tools Market Volume Share (%), by Application 2024 & 2032
- Figure 67: Asia Pacific EDA Tools Market Revenue (Million), by End-user 2024 & 2032
- Figure 68: Asia Pacific EDA Tools Market Volume (K Unit), by End-user 2024 & 2032
- Figure 69: Asia Pacific EDA Tools Market Revenue Share (%), by End-user 2024 & 2032
- Figure 70: Asia Pacific EDA Tools Market Volume Share (%), by End-user 2024 & 2032
- Figure 71: Asia Pacific EDA Tools Market Revenue (Million), by Country 2024 & 2032
- Figure 72: Asia Pacific EDA Tools Market Volume (K Unit), by Country 2024 & 2032
- Figure 73: Asia Pacific EDA Tools Market Revenue Share (%), by Country 2024 & 2032
- Figure 74: Asia Pacific EDA Tools Market Volume Share (%), by Country 2024 & 2032
- Figure 75: Rest of the World EDA Tools Market Revenue (Million), by Type 2024 & 2032
- Figure 76: Rest of the World EDA Tools Market Volume (K Unit), by Type 2024 & 2032
- Figure 77: Rest of the World EDA Tools Market Revenue Share (%), by Type 2024 & 2032
- Figure 78: Rest of the World EDA Tools Market Volume Share (%), by Type 2024 & 2032
- Figure 79: Rest of the World EDA Tools Market Revenue (Million), by Application 2024 & 2032
- Figure 80: Rest of the World EDA Tools Market Volume (K Unit), by Application 2024 & 2032
- Figure 81: Rest of the World EDA Tools Market Revenue Share (%), by Application 2024 & 2032
- Figure 82: Rest of the World EDA Tools Market Volume Share (%), by Application 2024 & 2032
- Figure 83: Rest of the World EDA Tools Market Revenue (Million), by End-user 2024 & 2032
- Figure 84: Rest of the World EDA Tools Market Volume (K Unit), by End-user 2024 & 2032
- Figure 85: Rest of the World EDA Tools Market Revenue Share (%), by End-user 2024 & 2032
- Figure 86: Rest of the World EDA Tools Market Volume Share (%), by End-user 2024 & 2032
- Figure 87: Rest of the World EDA Tools Market Revenue (Million), by Country 2024 & 2032
- Figure 88: Rest of the World EDA Tools Market Volume (K Unit), by Country 2024 & 2032
- Figure 89: Rest of the World EDA Tools Market Revenue Share (%), by Country 2024 & 2032
- Figure 90: Rest of the World EDA Tools Market Volume Share (%), by Country 2024 & 2032
List of Tables
- Table 1: Global EDA Tools Market Revenue Million Forecast, by Region 2019 & 2032
- Table 2: Global EDA Tools Market Volume K Unit Forecast, by Region 2019 & 2032
- Table 3: Global EDA Tools Market Revenue Million Forecast, by Type 2019 & 2032
- Table 4: Global EDA Tools Market Volume K Unit Forecast, by Type 2019 & 2032
- Table 5: Global EDA Tools Market Revenue Million Forecast, by Application 2019 & 2032
- Table 6: Global EDA Tools Market Volume K Unit Forecast, by Application 2019 & 2032
- Table 7: Global EDA Tools Market Revenue Million Forecast, by End-user 2019 & 2032
- Table 8: Global EDA Tools Market Volume K Unit Forecast, by End-user 2019 & 2032
- Table 9: Global EDA Tools Market Revenue Million Forecast, by Region 2019 & 2032
- Table 10: Global EDA Tools Market Volume K Unit Forecast, by Region 2019 & 2032
- Table 11: Global EDA Tools Market Revenue Million Forecast, by Country 2019 & 2032
- Table 12: Global EDA Tools Market Volume K Unit Forecast, by Country 2019 & 2032
- Table 13: United States EDA Tools Market Revenue (Million) Forecast, by Application 2019 & 2032
- Table 14: United States EDA Tools Market Volume (K Unit) Forecast, by Application 2019 & 2032
- Table 15: Canada EDA Tools Market Revenue (Million) Forecast, by Application 2019 & 2032
- Table 16: Canada EDA Tools Market Volume (K Unit) Forecast, by Application 2019 & 2032
- Table 17: Mexico EDA Tools Market Revenue (Million) Forecast, by Application 2019 & 2032
- Table 18: Mexico EDA Tools Market Volume (K Unit) Forecast, by Application 2019 & 2032
- Table 19: Global EDA Tools Market Revenue Million Forecast, by Country 2019 & 2032
- Table 20: Global EDA Tools Market Volume K Unit Forecast, by Country 2019 & 2032
- Table 21: Germany EDA Tools Market Revenue (Million) Forecast, by Application 2019 & 2032
- Table 22: Germany EDA Tools Market Volume (K Unit) Forecast, by Application 2019 & 2032
- Table 23: United Kingdom EDA Tools Market Revenue (Million) Forecast, by Application 2019 & 2032
- Table 24: United Kingdom EDA Tools Market Volume (K Unit) Forecast, by Application 2019 & 2032
- Table 25: France EDA Tools Market Revenue (Million) Forecast, by Application 2019 & 2032
- Table 26: France EDA Tools Market Volume (K Unit) Forecast, by Application 2019 & 2032
- Table 27: Spain EDA Tools Market Revenue (Million) Forecast, by Application 2019 & 2032
- Table 28: Spain EDA Tools Market Volume (K Unit) Forecast, by Application 2019 & 2032
- Table 29: Italy EDA Tools Market Revenue (Million) Forecast, by Application 2019 & 2032
- Table 30: Italy EDA Tools Market Volume (K Unit) Forecast, by Application 2019 & 2032
- Table 31: Spain EDA Tools Market Revenue (Million) Forecast, by Application 2019 & 2032
- Table 32: Spain EDA Tools Market Volume (K Unit) Forecast, by Application 2019 & 2032
- Table 33: Belgium EDA Tools Market Revenue (Million) Forecast, by Application 2019 & 2032
- Table 34: Belgium EDA Tools Market Volume (K Unit) Forecast, by Application 2019 & 2032
- Table 35: Netherland EDA Tools Market Revenue (Million) Forecast, by Application 2019 & 2032
- Table 36: Netherland EDA Tools Market Volume (K Unit) Forecast, by Application 2019 & 2032
- Table 37: Nordics EDA Tools Market Revenue (Million) Forecast, by Application 2019 & 2032
- Table 38: Nordics EDA Tools Market Volume (K Unit) Forecast, by Application 2019 & 2032
- Table 39: Rest of Europe EDA Tools Market Revenue (Million) Forecast, by Application 2019 & 2032
- Table 40: Rest of Europe EDA Tools Market Volume (K Unit) Forecast, by Application 2019 & 2032
- Table 41: Global EDA Tools Market Revenue Million Forecast, by Country 2019 & 2032
- Table 42: Global EDA Tools Market Volume K Unit Forecast, by Country 2019 & 2032
- Table 43: China EDA Tools Market Revenue (Million) Forecast, by Application 2019 & 2032
- Table 44: China EDA Tools Market Volume (K Unit) Forecast, by Application 2019 & 2032
- Table 45: Japan EDA Tools Market Revenue (Million) Forecast, by Application 2019 & 2032
- Table 46: Japan EDA Tools Market Volume (K Unit) Forecast, by Application 2019 & 2032
- Table 47: India EDA Tools Market Revenue (Million) Forecast, by Application 2019 & 2032
- Table 48: India EDA Tools Market Volume (K Unit) Forecast, by Application 2019 & 2032
- Table 49: South Korea EDA Tools Market Revenue (Million) Forecast, by Application 2019 & 2032
- Table 50: South Korea EDA Tools Market Volume (K Unit) Forecast, by Application 2019 & 2032
- Table 51: Southeast Asia EDA Tools Market Revenue (Million) Forecast, by Application 2019 & 2032
- Table 52: Southeast Asia EDA Tools Market Volume (K Unit) Forecast, by Application 2019 & 2032
- Table 53: Australia EDA Tools Market Revenue (Million) Forecast, by Application 2019 & 2032
- Table 54: Australia EDA Tools Market Volume (K Unit) Forecast, by Application 2019 & 2032
- Table 55: Indonesia EDA Tools Market Revenue (Million) Forecast, by Application 2019 & 2032
- Table 56: Indonesia EDA Tools Market Volume (K Unit) Forecast, by Application 2019 & 2032
- Table 57: Phillipes EDA Tools Market Revenue (Million) Forecast, by Application 2019 & 2032
- Table 58: Phillipes EDA Tools Market Volume (K Unit) Forecast, by Application 2019 & 2032
- Table 59: Singapore EDA Tools Market Revenue (Million) Forecast, by Application 2019 & 2032
- Table 60: Singapore EDA Tools Market Volume (K Unit) Forecast, by Application 2019 & 2032
- Table 61: Thailandc EDA Tools Market Revenue (Million) Forecast, by Application 2019 & 2032
- Table 62: Thailandc EDA Tools Market Volume (K Unit) Forecast, by Application 2019 & 2032
- Table 63: Rest of Asia Pacific EDA Tools Market Revenue (Million) Forecast, by Application 2019 & 2032
- Table 64: Rest of Asia Pacific EDA Tools Market Volume (K Unit) Forecast, by Application 2019 & 2032
- Table 65: Global EDA Tools Market Revenue Million Forecast, by Country 2019 & 2032
- Table 66: Global EDA Tools Market Volume K Unit Forecast, by Country 2019 & 2032
- Table 67: Brazil EDA Tools Market Revenue (Million) Forecast, by Application 2019 & 2032
- Table 68: Brazil EDA Tools Market Volume (K Unit) Forecast, by Application 2019 & 2032
- Table 69: Argentina EDA Tools Market Revenue (Million) Forecast, by Application 2019 & 2032
- Table 70: Argentina EDA Tools Market Volume (K Unit) Forecast, by Application 2019 & 2032
- Table 71: Peru EDA Tools Market Revenue (Million) Forecast, by Application 2019 & 2032
- Table 72: Peru EDA Tools Market Volume (K Unit) Forecast, by Application 2019 & 2032
- Table 73: Chile EDA Tools Market Revenue (Million) Forecast, by Application 2019 & 2032
- Table 74: Chile EDA Tools Market Volume (K Unit) Forecast, by Application 2019 & 2032
- Table 75: Colombia EDA Tools Market Revenue (Million) Forecast, by Application 2019 & 2032
- Table 76: Colombia EDA Tools Market Volume (K Unit) Forecast, by Application 2019 & 2032
- Table 77: Ecuador EDA Tools Market Revenue (Million) Forecast, by Application 2019 & 2032
- Table 78: Ecuador EDA Tools Market Volume (K Unit) Forecast, by Application 2019 & 2032
- Table 79: Venezuela EDA Tools Market Revenue (Million) Forecast, by Application 2019 & 2032
- Table 80: Venezuela EDA Tools Market Volume (K Unit) Forecast, by Application 2019 & 2032
- Table 81: Rest of South America EDA Tools Market Revenue (Million) Forecast, by Application 2019 & 2032
- Table 82: Rest of South America EDA Tools Market Volume (K Unit) Forecast, by Application 2019 & 2032
- Table 83: Global EDA Tools Market Revenue Million Forecast, by Country 2019 & 2032
- Table 84: Global EDA Tools Market Volume K Unit Forecast, by Country 2019 & 2032
- Table 85: United States EDA Tools Market Revenue (Million) Forecast, by Application 2019 & 2032
- Table 86: United States EDA Tools Market Volume (K Unit) Forecast, by Application 2019 & 2032
- Table 87: Canada EDA Tools Market Revenue (Million) Forecast, by Application 2019 & 2032
- Table 88: Canada EDA Tools Market Volume (K Unit) Forecast, by Application 2019 & 2032
- Table 89: Mexico EDA Tools Market Revenue (Million) Forecast, by Application 2019 & 2032
- Table 90: Mexico EDA Tools Market Volume (K Unit) Forecast, by Application 2019 & 2032
- Table 91: Global EDA Tools Market Revenue Million Forecast, by Country 2019 & 2032
- Table 92: Global EDA Tools Market Volume K Unit Forecast, by Country 2019 & 2032
- Table 93: United Arab Emirates EDA Tools Market Revenue (Million) Forecast, by Application 2019 & 2032
- Table 94: United Arab Emirates EDA Tools Market Volume (K Unit) Forecast, by Application 2019 & 2032
- Table 95: Saudi Arabia EDA Tools Market Revenue (Million) Forecast, by Application 2019 & 2032
- Table 96: Saudi Arabia EDA Tools Market Volume (K Unit) Forecast, by Application 2019 & 2032
- Table 97: South Africa EDA Tools Market Revenue (Million) Forecast, by Application 2019 & 2032
- Table 98: South Africa EDA Tools Market Volume (K Unit) Forecast, by Application 2019 & 2032
- Table 99: Rest of Middle East and Africa EDA Tools Market Revenue (Million) Forecast, by Application 2019 & 2032
- Table 100: Rest of Middle East and Africa EDA Tools Market Volume (K Unit) Forecast, by Application 2019 & 2032
- Table 101: Global EDA Tools Market Revenue Million Forecast, by Type 2019 & 2032
- Table 102: Global EDA Tools Market Volume K Unit Forecast, by Type 2019 & 2032
- Table 103: Global EDA Tools Market Revenue Million Forecast, by Application 2019 & 2032
- Table 104: Global EDA Tools Market Volume K Unit Forecast, by Application 2019 & 2032
- Table 105: Global EDA Tools Market Revenue Million Forecast, by End-user 2019 & 2032
- Table 106: Global EDA Tools Market Volume K Unit Forecast, by End-user 2019 & 2032
- Table 107: Global EDA Tools Market Revenue Million Forecast, by Country 2019 & 2032
- Table 108: Global EDA Tools Market Volume K Unit Forecast, by Country 2019 & 2032
- Table 109: Global EDA Tools Market Revenue Million Forecast, by Type 2019 & 2032
- Table 110: Global EDA Tools Market Volume K Unit Forecast, by Type 2019 & 2032
- Table 111: Global EDA Tools Market Revenue Million Forecast, by Application 2019 & 2032
- Table 112: Global EDA Tools Market Volume K Unit Forecast, by Application 2019 & 2032
- Table 113: Global EDA Tools Market Revenue Million Forecast, by End-user 2019 & 2032
- Table 114: Global EDA Tools Market Volume K Unit Forecast, by End-user 2019 & 2032
- Table 115: Global EDA Tools Market Revenue Million Forecast, by Country 2019 & 2032
- Table 116: Global EDA Tools Market Volume K Unit Forecast, by Country 2019 & 2032
- Table 117: Global EDA Tools Market Revenue Million Forecast, by Type 2019 & 2032
- Table 118: Global EDA Tools Market Volume K Unit Forecast, by Type 2019 & 2032
- Table 119: Global EDA Tools Market Revenue Million Forecast, by Application 2019 & 2032
- Table 120: Global EDA Tools Market Volume K Unit Forecast, by Application 2019 & 2032
- Table 121: Global EDA Tools Market Revenue Million Forecast, by End-user 2019 & 2032
- Table 122: Global EDA Tools Market Volume K Unit Forecast, by End-user 2019 & 2032
- Table 123: Global EDA Tools Market Revenue Million Forecast, by Country 2019 & 2032
- Table 124: Global EDA Tools Market Volume K Unit Forecast, by Country 2019 & 2032
- Table 125: Global EDA Tools Market Revenue Million Forecast, by Type 2019 & 2032
- Table 126: Global EDA Tools Market Volume K Unit Forecast, by Type 2019 & 2032
- Table 127: Global EDA Tools Market Revenue Million Forecast, by Application 2019 & 2032
- Table 128: Global EDA Tools Market Volume K Unit Forecast, by Application 2019 & 2032
- Table 129: Global EDA Tools Market Revenue Million Forecast, by End-user 2019 & 2032
- Table 130: Global EDA Tools Market Volume K Unit Forecast, by End-user 2019 & 2032
- Table 131: Global EDA Tools Market Revenue Million Forecast, by Country 2019 & 2032
- Table 132: Global EDA Tools Market Volume K Unit Forecast, by Country 2019 & 2032
Frequently Asked Questions
1. What is the projected Compound Annual Growth Rate (CAGR) of the EDA Tools Market?
The projected CAGR is approximately 8.46%.
2. Which companies are prominent players in the EDA Tools Market?
Key companies in the market include Ansys Inc, Aldec Inc, Xilinx Inc, Altium Limited, Keysight Technologies Inc, Mentor Graphic Corporation (Siemens PLM Software), Synopsys Inc, Cadence Design Systems Inc, Lauterbach GmbH, Agnisys Inc, Zuken Ltd.
3. What are the main segments of the EDA Tools Market?
The market segments include Type, Application, End-user .
4. Can you provide details about the market size?
The market size is estimated to be USD 17.72 Million as of 2022.
5. What are some drivers contributing to market growth?
Booming Automotive. IoT. and AI Sectors; Upcoming Trend of EDA Toolsets Equipped with Machine Learning Capabilities.
6. What are the notable trends driving market growth?
IC Physical Design and Verification Segment to Grow Significantly.
7. Are there any restraints impacting market growth?
Moore's Law about to be Proven Faulty.
8. Can you provide examples of recent developments in the market?
July 2022 - Future Facilities' acquisition by Cadence Design Systems, Inc. has been finalized, the company announced. The inclusion of Future Facilities technologies and experience bolsters Cadence's approach to intelligent system design and expands its capabilities in computational fluid dynamics (CFD) and multiphysics system analysis. Leading technology companies can make wise business decisions about data center design, operations, and lifecycle management and lessen their carbon footprint thanks to Future Facilities' electronics cooling analysis and energy performance optimization solutions for data center design and operation using physics-based 3D digital twins.
9. What pricing options are available for accessing the report?
Pricing options include single-user, multi-user, and enterprise licenses priced at USD 4750, USD 5250, and USD 8750 respectively.
10. Is the market size provided in terms of value or volume?
The market size is provided in terms of value, measured in Million and volume, measured in K Unit.
11. Are there any specific market keywords associated with the report?
Yes, the market keyword associated with the report is "EDA Tools Market," which aids in identifying and referencing the specific market segment covered.
12. How do I determine which pricing option suits my needs best?
The pricing options vary based on user requirements and access needs. Individual users may opt for single-user licenses, while businesses requiring broader access may choose multi-user or enterprise licenses for cost-effective access to the report.
13. Are there any additional resources or data provided in the EDA Tools Market report?
While the report offers comprehensive insights, it's advisable to review the specific contents or supplementary materials provided to ascertain if additional resources or data are available.
14. How can I stay updated on further developments or reports in the EDA Tools Market?
To stay informed about further developments, trends, and reports in the EDA Tools Market, consider subscribing to industry newsletters, following relevant companies and organizations, or regularly checking reputable industry news sources and publications.
Methodology
Step 1 - Identification of Relevant Samples Size from Population Database


Step 2 - Approaches for Defining Global Market Size (Value, Volume* & Price*)

Note*: In applicable scenarios
Step 3 - Data Sources
Primary Research
- Web Analytics
- Survey Reports
- Research Institute
- Latest Research Reports
- Opinion Leaders
Secondary Research
- Annual Reports
- White Paper
- Latest Press Release
- Industry Association
- Paid Database
- Investor Presentations

Step 4 - Data Triangulation
Involves using different sources of information in order to increase the validity of a study
These sources are likely to be stakeholders in a program - participants, other researchers, program staff, other community members, and so on.
Then we put all data in single framework & apply various statistical tools to find out the dynamic on the market.
During the analysis stage, feedback from the stakeholder groups would be compared to determine areas of agreement as well as areas of divergence


