
Key Insights
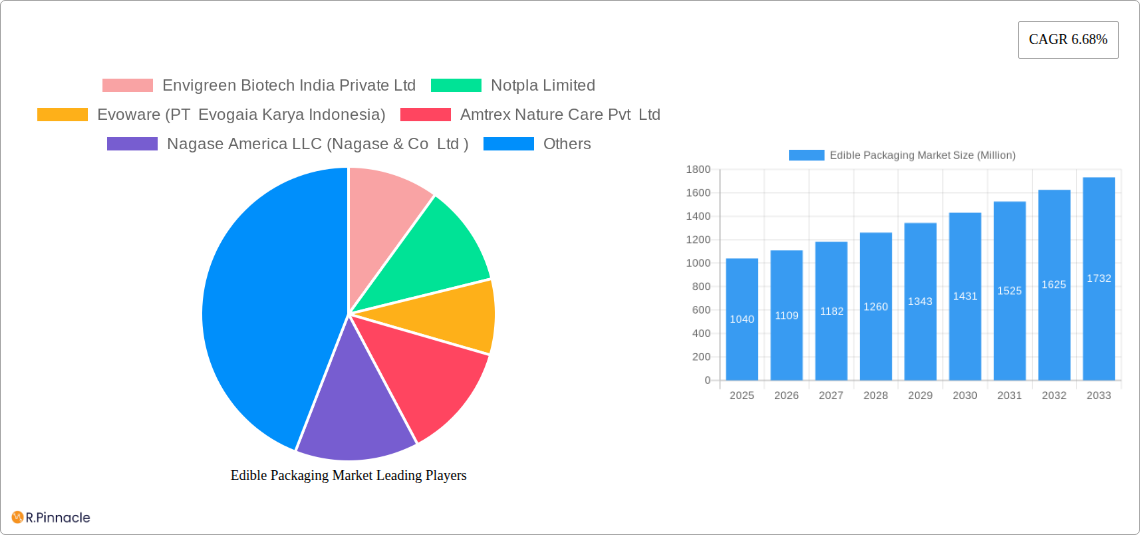
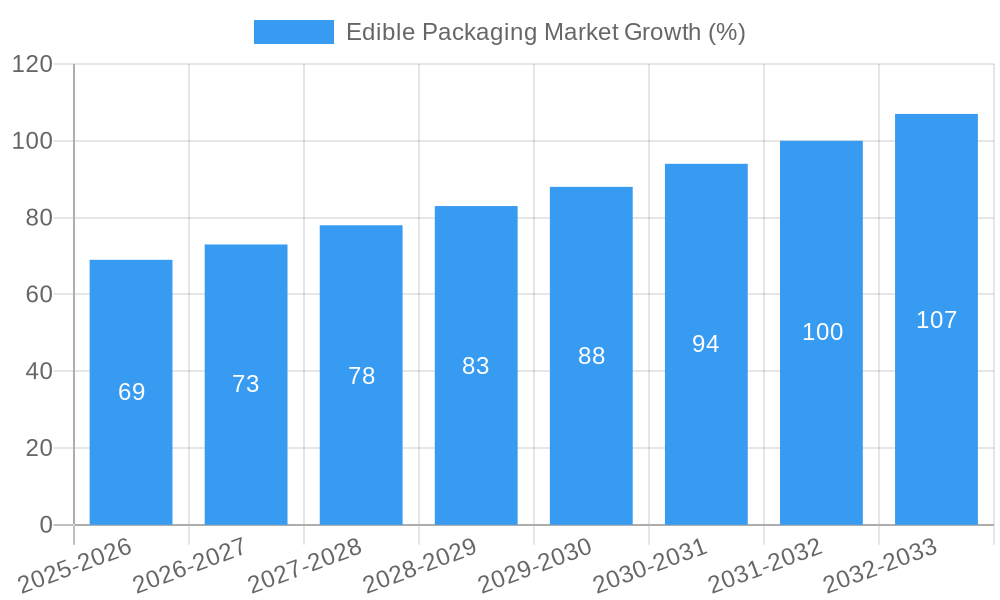
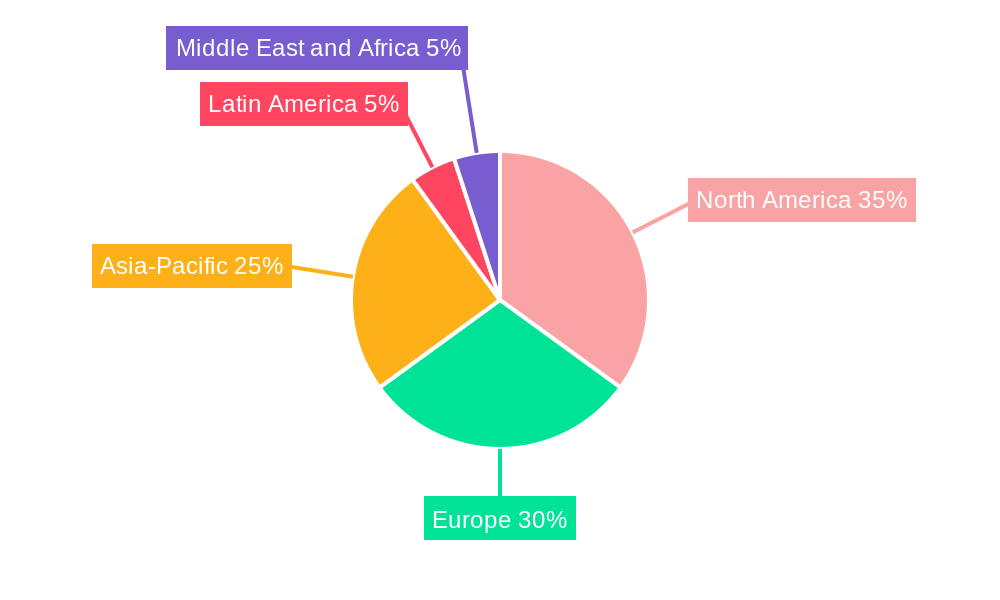
The global edible packaging market, valued at $1.04 billion in 2025, is projected to experience robust growth, driven by increasing consumer demand for sustainable and eco-friendly alternatives to traditional packaging materials. The market's Compound Annual Growth Rate (CAGR) of 6.68% from 2025 to 2033 indicates a significant expansion, fueled by several key factors. Growing concerns about plastic pollution and its environmental impact are pushing consumers and businesses toward biodegradable and compostable packaging solutions. The food and beverage industry, a major driver of this market, is actively adopting edible films and coatings to enhance product shelf life, reduce waste, and improve the overall consumer experience. Furthermore, advancements in material science are leading to the development of innovative edible packaging materials with enhanced functionalities, such as improved barrier properties and extended shelf life. The pharmaceutical industry is also exploring edible packaging for its potential to improve drug delivery systems and patient compliance. Market segmentation reveals strong growth across various regions, with North America and Europe currently holding significant market share due to high consumer awareness and stringent environmental regulations. However, Asia-Pacific is expected to witness substantial growth in the coming years driven by increasing disposable incomes and rising environmental concerns. The utilization of diverse raw materials, including proteins, polysaccharides, and lipids derived from both plant and animal sources, provides a foundation for further innovation and market expansion. Competitive landscape analysis suggests a mix of established players and emerging companies, fostering innovation and ensuring a diverse product portfolio.
The market segmentation offers further insight into specific growth areas. The food and beverage segment is expected to dominate due to the significant volume of packaged goods. Within regional segments, North America and Europe are likely to maintain a leading position due to higher consumer awareness and stricter regulations on non-biodegradable packaging. However, the Asia-Pacific region presents significant growth potential given its expanding population and rising consumer demand for sustainable products. The plant-based source segment within the edible packaging market is expected to lead due to factors including cost-effectiveness and consumer preference for plant-derived materials. The protein-based raw materials segment, with its potential for superior barrier properties, is also projected to see strong growth. Companies like Envigreen Biotech India Private Ltd, Notpla Limited, and Evoware are at the forefront of innovation, driving product diversification and market expansion through continuous R&D and strategic partnerships. The forecast period, 2025-2033, is anticipated to witness significant technological advancements and increased regulatory support, shaping the future of edible packaging and its widespread adoption across various industries.
Edible Packaging Market Report: 2019-2033 Forecast
This comprehensive report provides a detailed analysis of the global Edible Packaging Market, offering invaluable insights for industry professionals, investors, and strategic decision-makers. Covering the period from 2019 to 2033, with a focus on 2025, this report unveils market trends, growth drivers, challenges, and future opportunities within this rapidly evolving sector. The report leverages extensive market research and data analysis to provide actionable intelligence for navigating the complexities of the edible packaging landscape.
Edible Packaging Market Structure & Innovation Trends
This section analyzes the competitive landscape of the edible packaging market, examining market concentration, innovation drivers, regulatory frameworks, and M&A activities. The market is characterized by a mix of established players and emerging companies, with varying levels of market share. While precise market share data for each company requires further in-depth research, the report presents an estimated distribution amongst key players, highlighting the competitive intensity. The report also explores the impact of mergers and acquisitions (M&A) on market consolidation, providing analysis of significant deal values (estimated at xx Million) in the recent past.
- Market Concentration: Moderately fragmented, with a few dominant players and numerous smaller niche players.
- Innovation Drivers: Growing consumer demand for sustainable packaging, advancements in bio-material technology, stringent regulations against conventional packaging.
- Regulatory Frameworks: Varying regulations across regions concerning food safety and environmental impact, creating both challenges and opportunities.
- Product Substitutes: Competition from traditional packaging materials, biodegradable alternatives, and compostable packaging.
- End-User Demographics: Increasing consumer awareness of environmental issues drives demand for eco-friendly edible packaging in specific segments.
- M&A Activities: A moderate level of M&A activity observed, with deal values ranging from xx Million to xx Million for significant transactions. This suggests ongoing consolidation and expansion of market players.
Edible Packaging Market Dynamics & Trends
The edible packaging market is witnessing significant growth, driven by escalating consumer preference for sustainable and eco-friendly packaging solutions. The report estimates a Compound Annual Growth Rate (CAGR) of xx% during the forecast period (2025-2033). The market penetration of edible packaging is still relatively low, presenting substantial opportunities for growth. Several factors are contributing to this expansion:
- Increasing consumer awareness about environmental sustainability and the impact of plastic waste.
- Stringent government regulations aimed at reducing plastic usage and promoting eco-friendly alternatives.
- Technological advancements leading to the development of more efficient and cost-effective edible packaging solutions.
- Rise in demand from food and beverage industries seeking innovative and sustainable packaging options.
- Growing adoption of edible films and coatings in the pharmaceutical industry for enhanced drug delivery and protection. The market penetration of edible packaging in the pharmaceutical sector is expected to increase at a CAGR of xx% during the forecast period.
Dominant Regions & Segments in Edible Packaging Market
The edible packaging market exhibits diverse regional and segmental growth patterns. While precise market size estimations for each region and segment are detailed within the full report, certain trends are evident.
By End-User Industry: The food and beverage sector dominates the market, driven by high demand for ready-to-eat meals and snacks. The pharmaceutical industry shows promising growth, although currently holding a smaller market share compared to food and beverage.
By Region: North America and Europe currently lead the market in terms of adoption and innovation. Asia-Pacific is projected to experience rapid growth during the forecast period, driven by increasing population and rising disposable incomes.
By Source: Plant-based edible packaging solutions are currently dominating the market, reflecting both consumer preference and raw material availability.
By Raw Material: Polysaccharides are the most widely used raw material due to their abundant availability and suitable properties.
- Key Drivers (North America): Strong regulatory frameworks promoting sustainable packaging, high consumer awareness of environmental issues, robust R&D activities.
- Key Drivers (Europe): Stringent environmental regulations, high demand for eco-friendly products, established infrastructure supporting innovation.
- Key Drivers (Asia-Pacific): Rapidly growing food and beverage industry, increasing population, rising disposable incomes, government support for sustainable packaging initiatives.
Edible Packaging Market Product Innovations
Recent years have witnessed remarkable innovation in edible packaging materials and technologies. This includes the development of novel bio-based materials, improved coating techniques, and advanced packaging designs optimized for specific applications. Edible films with enhanced barrier properties against moisture, oxygen, and UV light are gaining prominence. These innovations cater to specific demands such as extended shelf life and improved product preservation. Furthermore, the integration of edible inks and sensors for enhanced product traceability and quality control is on the rise.
Report Scope & Segmentation Analysis
This report comprehensively segments the edible packaging market based on end-user industry (food, beverage, pharmaceutical), region (North America, Europe, Asia-Pacific, Latin America, Middle East & Africa), source (plant, animal), and raw material (protein, polysaccharides, lipids, other). Each segment's market size, growth projections, and competitive dynamics are thoroughly analyzed, providing a granular understanding of market opportunities. (Specific market size figures and growth projections are detailed within the full report for each segment).
Key Drivers of Edible Packaging Market Growth
The growth of the edible packaging market is primarily propelled by several crucial factors: the rising global demand for sustainable and eco-friendly packaging solutions, stringent governmental regulations aimed at curtailing plastic waste, and continuous advancements in bio-material technology. These factors collectively contribute to the increasing adoption of edible packaging across various industries. Moreover, the growing awareness among consumers about the environmental impact of traditional packaging materials is driving the market's expansion.
Challenges in the Edible Packaging Market Sector
Despite significant market potential, the edible packaging industry faces several challenges. These include the relatively high cost of production compared to traditional packaging, limitations in barrier properties for certain applications, and the need for improved shelf-life extension capabilities. Furthermore, maintaining the desired sensory attributes of the edible packaging while ensuring food safety remains a key challenge. Regulatory hurdles and standardization complexities across different regions also pose significant obstacles for market expansion.
Emerging Opportunities in Edible Packaging Market
The edible packaging market offers numerous promising opportunities. These include the development of novel bio-based materials with enhanced functionalities, exploring new applications in various industries (e.g., cosmetics, pharmaceuticals), and catering to specific consumer demands like personalization and customized packaging solutions. Further expansion is anticipated in emerging economies with growing consumer populations and increasing disposable incomes.
Leading Players in the Edible Packaging Market Market
- Envigreen Biotech India Private Ltd
- Notpla Limited
- Evoware (PT Evogaia Karya Indonesia)
- Amtrex Nature Care Pvt Ltd
- Nagase America LLC (Nagase & Co Ltd )
- TSUKIOKA FILM PHARMA CO LTD
- ECOLOTEC LIMITED
- Devro PLC (Saria Nederland BV)
- Tipa Corp Ltd
- JRF Technology LLC
- Glanbia Plc
Key Developments in Edible Packaging Market Industry
- 2022 Q4: Notpla Limited launches a new seaweed-based packaging solution for food delivery.
- 2023 Q1: Envigreen Biotech India Private Ltd. secures funding for expansion of its edible film production facility.
- 2023 Q2: A significant merger between two key players in the edible packaging industry leads to increased market consolidation. (Further details on specific mergers and acquisitions, dates, and values are provided within the full report).
Future Outlook for Edible Packaging Market Market
The future of the edible packaging market looks promising. Continued technological innovation, growing consumer demand for sustainable alternatives, and supportive government regulations are expected to drive substantial market expansion. The development of cost-effective and highly functional edible packaging solutions will further enhance market growth and penetration across various applications and industries, paving the way for a significant reduction in environmentally harmful packaging materials.
Edible Packaging Market Segmentation
-
1. Source
- 1.1. Plant
- 1.2. Animal
-
2. Raw Material
- 2.1. Protein
- 2.2. Polysaccharides
- 2.3. Lipids
- 2.4. Other Raw Materials
-
3. End-User Industry
- 3.1. Food
- 3.2. Bevergae
- 3.3. Pharmaceutical
Edible Packaging Market Segmentation By Geography
-
1. North America
- 1.1. United States
- 1.2. Canada
- 1.3. Mexico
-
2. South America
- 2.1. Brazil
- 2.2. Argentina
- 2.3. Rest of South America
-
3. Europe
- 3.1. United Kingdom
- 3.2. Germany
- 3.3. France
- 3.4. Italy
- 3.5. Spain
- 3.6. Russia
- 3.7. Benelux
- 3.8. Nordics
- 3.9. Rest of Europe
-
4. Middle East & Africa
- 4.1. Turkey
- 4.2. Israel
- 4.3. GCC
- 4.4. North Africa
- 4.5. South Africa
- 4.6. Rest of Middle East & Africa
-
5. Asia Pacific
- 5.1. China
- 5.2. India
- 5.3. Japan
- 5.4. South Korea
- 5.5. ASEAN
- 5.6. Oceania
- 5.7. Rest of Asia Pacific
Edible Packaging Market REPORT HIGHLIGHTS
| Aspects | Details |
|---|---|
| Study Period | 2019-2033 |
| Base Year | 2024 |
| Estimated Year | 2025 |
| Forecast Period | 2025-2033 |
| Historical Period | 2019-2024 |
| Growth Rate | CAGR of 6.68% from 2019-2033 |
| Segmentation |
|
Table of Contents
- 1. Introduction
- 1.1. Research Scope
- 1.2. Market Segmentation
- 1.3. Research Methodology
- 1.4. Definitions and Assumptions
- 2. Executive Summary
- 2.1. Introduction
- 3. Market Dynamics
- 3.1. Introduction
- 3.2. Market Drivers
- 3.2.1. Need to Eliminate Type Waste Cycle and Increase Shelf-Life of the Product; Ban on Single-Use-Plastic and Growing Sustainability Concern
- 3.3. Market Restrains
- 3.3.1. High Cost of Production
- 3.4. Market Trends
- 3.4.1. The Increasing Demand for Sustainable Solutions and the Need for Extended Product Shelf-Life are helping drive market growth
- 4. Market Factor Analysis
- 4.1. Porters Five Forces
- 4.2. Supply/Value Chain
- 4.3. PESTEL analysis
- 4.4. Market Entropy
- 4.5. Patent/Trademark Analysis
- 5. Global Edible Packaging Market Analysis, Insights and Forecast, 2019-2031
- 5.1. Market Analysis, Insights and Forecast - by Source
- 5.1.1. Plant
- 5.1.2. Animal
- 5.2. Market Analysis, Insights and Forecast - by Raw Material
- 5.2.1. Protein
- 5.2.2. Polysaccharides
- 5.2.3. Lipids
- 5.2.4. Other Raw Materials
- 5.3. Market Analysis, Insights and Forecast - by End-User Industry
- 5.3.1. Food
- 5.3.2. Bevergae
- 5.3.3. Pharmaceutical
- 5.4. Market Analysis, Insights and Forecast - by Region
- 5.4.1. North America
- 5.4.2. South America
- 5.4.3. Europe
- 5.4.4. Middle East & Africa
- 5.4.5. Asia Pacific
- 5.1. Market Analysis, Insights and Forecast - by Source
- 6. North America Edible Packaging Market Analysis, Insights and Forecast, 2019-2031
- 6.1. Market Analysis, Insights and Forecast - by Source
- 6.1.1. Plant
- 6.1.2. Animal
- 6.2. Market Analysis, Insights and Forecast - by Raw Material
- 6.2.1. Protein
- 6.2.2. Polysaccharides
- 6.2.3. Lipids
- 6.2.4. Other Raw Materials
- 6.3. Market Analysis, Insights and Forecast - by End-User Industry
- 6.3.1. Food
- 6.3.2. Bevergae
- 6.3.3. Pharmaceutical
- 6.1. Market Analysis, Insights and Forecast - by Source
- 7. South America Edible Packaging Market Analysis, Insights and Forecast, 2019-2031
- 7.1. Market Analysis, Insights and Forecast - by Source
- 7.1.1. Plant
- 7.1.2. Animal
- 7.2. Market Analysis, Insights and Forecast - by Raw Material
- 7.2.1. Protein
- 7.2.2. Polysaccharides
- 7.2.3. Lipids
- 7.2.4. Other Raw Materials
- 7.3. Market Analysis, Insights and Forecast - by End-User Industry
- 7.3.1. Food
- 7.3.2. Bevergae
- 7.3.3. Pharmaceutical
- 7.1. Market Analysis, Insights and Forecast - by Source
- 8. Europe Edible Packaging Market Analysis, Insights and Forecast, 2019-2031
- 8.1. Market Analysis, Insights and Forecast - by Source
- 8.1.1. Plant
- 8.1.2. Animal
- 8.2. Market Analysis, Insights and Forecast - by Raw Material
- 8.2.1. Protein
- 8.2.2. Polysaccharides
- 8.2.3. Lipids
- 8.2.4. Other Raw Materials
- 8.3. Market Analysis, Insights and Forecast - by End-User Industry
- 8.3.1. Food
- 8.3.2. Bevergae
- 8.3.3. Pharmaceutical
- 8.1. Market Analysis, Insights and Forecast - by Source
- 9. Middle East & Africa Edible Packaging Market Analysis, Insights and Forecast, 2019-2031
- 9.1. Market Analysis, Insights and Forecast - by Source
- 9.1.1. Plant
- 9.1.2. Animal
- 9.2. Market Analysis, Insights and Forecast - by Raw Material
- 9.2.1. Protein
- 9.2.2. Polysaccharides
- 9.2.3. Lipids
- 9.2.4. Other Raw Materials
- 9.3. Market Analysis, Insights and Forecast - by End-User Industry
- 9.3.1. Food
- 9.3.2. Bevergae
- 9.3.3. Pharmaceutical
- 9.1. Market Analysis, Insights and Forecast - by Source
- 10. Asia Pacific Edible Packaging Market Analysis, Insights and Forecast, 2019-2031
- 10.1. Market Analysis, Insights and Forecast - by Source
- 10.1.1. Plant
- 10.1.2. Animal
- 10.2. Market Analysis, Insights and Forecast - by Raw Material
- 10.2.1. Protein
- 10.2.2. Polysaccharides
- 10.2.3. Lipids
- 10.2.4. Other Raw Materials
- 10.3. Market Analysis, Insights and Forecast - by End-User Industry
- 10.3.1. Food
- 10.3.2. Bevergae
- 10.3.3. Pharmaceutical
- 10.1. Market Analysis, Insights and Forecast - by Source
- 11. Competitive Analysis
- 11.1. Global Market Share Analysis 2024
- 11.2. Company Profiles
- 11.2.1 Envigreen Biotech India Private Ltd
- 11.2.1.1. Overview
- 11.2.1.2. Products
- 11.2.1.3. SWOT Analysis
- 11.2.1.4. Recent Developments
- 11.2.1.5. Financials (Based on Availability)
- 11.2.2 Notpla Limited
- 11.2.2.1. Overview
- 11.2.2.2. Products
- 11.2.2.3. SWOT Analysis
- 11.2.2.4. Recent Developments
- 11.2.2.5. Financials (Based on Availability)
- 11.2.3 Evoware (PT Evogaia Karya Indonesia)
- 11.2.3.1. Overview
- 11.2.3.2. Products
- 11.2.3.3. SWOT Analysis
- 11.2.3.4. Recent Developments
- 11.2.3.5. Financials (Based on Availability)
- 11.2.4 Amtrex Nature Care Pvt Ltd
- 11.2.4.1. Overview
- 11.2.4.2. Products
- 11.2.4.3. SWOT Analysis
- 11.2.4.4. Recent Developments
- 11.2.4.5. Financials (Based on Availability)
- 11.2.5 Nagase America LLC (Nagase & Co Ltd )
- 11.2.5.1. Overview
- 11.2.5.2. Products
- 11.2.5.3. SWOT Analysis
- 11.2.5.4. Recent Developments
- 11.2.5.5. Financials (Based on Availability)
- 11.2.6 TSUKIOKA FILM PHARMA CO LTD
- 11.2.6.1. Overview
- 11.2.6.2. Products
- 11.2.6.3. SWOT Analysis
- 11.2.6.4. Recent Developments
- 11.2.6.5. Financials (Based on Availability)
- 11.2.7 ECOLOTEC LIMITED
- 11.2.7.1. Overview
- 11.2.7.2. Products
- 11.2.7.3. SWOT Analysis
- 11.2.7.4. Recent Developments
- 11.2.7.5. Financials (Based on Availability)
- 11.2.8 Devro PLC (Saria Nederland BV)
- 11.2.8.1. Overview
- 11.2.8.2. Products
- 11.2.8.3. SWOT Analysis
- 11.2.8.4. Recent Developments
- 11.2.8.5. Financials (Based on Availability)
- 11.2.9 Tipa Corp Ltd
- 11.2.9.1. Overview
- 11.2.9.2. Products
- 11.2.9.3. SWOT Analysis
- 11.2.9.4. Recent Developments
- 11.2.9.5. Financials (Based on Availability)
- 11.2.10 JRF Technology LLC
- 11.2.10.1. Overview
- 11.2.10.2. Products
- 11.2.10.3. SWOT Analysis
- 11.2.10.4. Recent Developments
- 11.2.10.5. Financials (Based on Availability)
- 11.2.11 Glanbia Plc
- 11.2.11.1. Overview
- 11.2.11.2. Products
- 11.2.11.3. SWOT Analysis
- 11.2.11.4. Recent Developments
- 11.2.11.5. Financials (Based on Availability)
- 11.2.1 Envigreen Biotech India Private Ltd
List of Figures
- Figure 1: Global Edible Packaging Market Revenue Breakdown (Million, %) by Region 2024 & 2032
- Figure 2: Global Edible Packaging Market Volume Breakdown (K Tons, %) by Region 2024 & 2032
- Figure 3: North America Edible Packaging Market Revenue (Million), by Source 2024 & 2032
- Figure 4: North America Edible Packaging Market Volume (K Tons), by Source 2024 & 2032
- Figure 5: North America Edible Packaging Market Revenue Share (%), by Source 2024 & 2032
- Figure 6: North America Edible Packaging Market Volume Share (%), by Source 2024 & 2032
- Figure 7: North America Edible Packaging Market Revenue (Million), by Raw Material 2024 & 2032
- Figure 8: North America Edible Packaging Market Volume (K Tons), by Raw Material 2024 & 2032
- Figure 9: North America Edible Packaging Market Revenue Share (%), by Raw Material 2024 & 2032
- Figure 10: North America Edible Packaging Market Volume Share (%), by Raw Material 2024 & 2032
- Figure 11: North America Edible Packaging Market Revenue (Million), by End-User Industry 2024 & 2032
- Figure 12: North America Edible Packaging Market Volume (K Tons), by End-User Industry 2024 & 2032
- Figure 13: North America Edible Packaging Market Revenue Share (%), by End-User Industry 2024 & 2032
- Figure 14: North America Edible Packaging Market Volume Share (%), by End-User Industry 2024 & 2032
- Figure 15: North America Edible Packaging Market Revenue (Million), by Country 2024 & 2032
- Figure 16: North America Edible Packaging Market Volume (K Tons), by Country 2024 & 2032
- Figure 17: North America Edible Packaging Market Revenue Share (%), by Country 2024 & 2032
- Figure 18: North America Edible Packaging Market Volume Share (%), by Country 2024 & 2032
- Figure 19: South America Edible Packaging Market Revenue (Million), by Source 2024 & 2032
- Figure 20: South America Edible Packaging Market Volume (K Tons), by Source 2024 & 2032
- Figure 21: South America Edible Packaging Market Revenue Share (%), by Source 2024 & 2032
- Figure 22: South America Edible Packaging Market Volume Share (%), by Source 2024 & 2032
- Figure 23: South America Edible Packaging Market Revenue (Million), by Raw Material 2024 & 2032
- Figure 24: South America Edible Packaging Market Volume (K Tons), by Raw Material 2024 & 2032
- Figure 25: South America Edible Packaging Market Revenue Share (%), by Raw Material 2024 & 2032
- Figure 26: South America Edible Packaging Market Volume Share (%), by Raw Material 2024 & 2032
- Figure 27: South America Edible Packaging Market Revenue (Million), by End-User Industry 2024 & 2032
- Figure 28: South America Edible Packaging Market Volume (K Tons), by End-User Industry 2024 & 2032
- Figure 29: South America Edible Packaging Market Revenue Share (%), by End-User Industry 2024 & 2032
- Figure 30: South America Edible Packaging Market Volume Share (%), by End-User Industry 2024 & 2032
- Figure 31: South America Edible Packaging Market Revenue (Million), by Country 2024 & 2032
- Figure 32: South America Edible Packaging Market Volume (K Tons), by Country 2024 & 2032
- Figure 33: South America Edible Packaging Market Revenue Share (%), by Country 2024 & 2032
- Figure 34: South America Edible Packaging Market Volume Share (%), by Country 2024 & 2032
- Figure 35: Europe Edible Packaging Market Revenue (Million), by Source 2024 & 2032
- Figure 36: Europe Edible Packaging Market Volume (K Tons), by Source 2024 & 2032
- Figure 37: Europe Edible Packaging Market Revenue Share (%), by Source 2024 & 2032
- Figure 38: Europe Edible Packaging Market Volume Share (%), by Source 2024 & 2032
- Figure 39: Europe Edible Packaging Market Revenue (Million), by Raw Material 2024 & 2032
- Figure 40: Europe Edible Packaging Market Volume (K Tons), by Raw Material 2024 & 2032
- Figure 41: Europe Edible Packaging Market Revenue Share (%), by Raw Material 2024 & 2032
- Figure 42: Europe Edible Packaging Market Volume Share (%), by Raw Material 2024 & 2032
- Figure 43: Europe Edible Packaging Market Revenue (Million), by End-User Industry 2024 & 2032
- Figure 44: Europe Edible Packaging Market Volume (K Tons), by End-User Industry 2024 & 2032
- Figure 45: Europe Edible Packaging Market Revenue Share (%), by End-User Industry 2024 & 2032
- Figure 46: Europe Edible Packaging Market Volume Share (%), by End-User Industry 2024 & 2032
- Figure 47: Europe Edible Packaging Market Revenue (Million), by Country 2024 & 2032
- Figure 48: Europe Edible Packaging Market Volume (K Tons), by Country 2024 & 2032
- Figure 49: Europe Edible Packaging Market Revenue Share (%), by Country 2024 & 2032
- Figure 50: Europe Edible Packaging Market Volume Share (%), by Country 2024 & 2032
- Figure 51: Middle East & Africa Edible Packaging Market Revenue (Million), by Source 2024 & 2032
- Figure 52: Middle East & Africa Edible Packaging Market Volume (K Tons), by Source 2024 & 2032
- Figure 53: Middle East & Africa Edible Packaging Market Revenue Share (%), by Source 2024 & 2032
- Figure 54: Middle East & Africa Edible Packaging Market Volume Share (%), by Source 2024 & 2032
- Figure 55: Middle East & Africa Edible Packaging Market Revenue (Million), by Raw Material 2024 & 2032
- Figure 56: Middle East & Africa Edible Packaging Market Volume (K Tons), by Raw Material 2024 & 2032
- Figure 57: Middle East & Africa Edible Packaging Market Revenue Share (%), by Raw Material 2024 & 2032
- Figure 58: Middle East & Africa Edible Packaging Market Volume Share (%), by Raw Material 2024 & 2032
- Figure 59: Middle East & Africa Edible Packaging Market Revenue (Million), by End-User Industry 2024 & 2032
- Figure 60: Middle East & Africa Edible Packaging Market Volume (K Tons), by End-User Industry 2024 & 2032
- Figure 61: Middle East & Africa Edible Packaging Market Revenue Share (%), by End-User Industry 2024 & 2032
- Figure 62: Middle East & Africa Edible Packaging Market Volume Share (%), by End-User Industry 2024 & 2032
- Figure 63: Middle East & Africa Edible Packaging Market Revenue (Million), by Country 2024 & 2032
- Figure 64: Middle East & Africa Edible Packaging Market Volume (K Tons), by Country 2024 & 2032
- Figure 65: Middle East & Africa Edible Packaging Market Revenue Share (%), by Country 2024 & 2032
- Figure 66: Middle East & Africa Edible Packaging Market Volume Share (%), by Country 2024 & 2032
- Figure 67: Asia Pacific Edible Packaging Market Revenue (Million), by Source 2024 & 2032
- Figure 68: Asia Pacific Edible Packaging Market Volume (K Tons), by Source 2024 & 2032
- Figure 69: Asia Pacific Edible Packaging Market Revenue Share (%), by Source 2024 & 2032
- Figure 70: Asia Pacific Edible Packaging Market Volume Share (%), by Source 2024 & 2032
- Figure 71: Asia Pacific Edible Packaging Market Revenue (Million), by Raw Material 2024 & 2032
- Figure 72: Asia Pacific Edible Packaging Market Volume (K Tons), by Raw Material 2024 & 2032
- Figure 73: Asia Pacific Edible Packaging Market Revenue Share (%), by Raw Material 2024 & 2032
- Figure 74: Asia Pacific Edible Packaging Market Volume Share (%), by Raw Material 2024 & 2032
- Figure 75: Asia Pacific Edible Packaging Market Revenue (Million), by End-User Industry 2024 & 2032
- Figure 76: Asia Pacific Edible Packaging Market Volume (K Tons), by End-User Industry 2024 & 2032
- Figure 77: Asia Pacific Edible Packaging Market Revenue Share (%), by End-User Industry 2024 & 2032
- Figure 78: Asia Pacific Edible Packaging Market Volume Share (%), by End-User Industry 2024 & 2032
- Figure 79: Asia Pacific Edible Packaging Market Revenue (Million), by Country 2024 & 2032
- Figure 80: Asia Pacific Edible Packaging Market Volume (K Tons), by Country 2024 & 2032
- Figure 81: Asia Pacific Edible Packaging Market Revenue Share (%), by Country 2024 & 2032
- Figure 82: Asia Pacific Edible Packaging Market Volume Share (%), by Country 2024 & 2032
List of Tables
- Table 1: Global Edible Packaging Market Revenue Million Forecast, by Region 2019 & 2032
- Table 2: Global Edible Packaging Market Volume K Tons Forecast, by Region 2019 & 2032
- Table 3: Global Edible Packaging Market Revenue Million Forecast, by Source 2019 & 2032
- Table 4: Global Edible Packaging Market Volume K Tons Forecast, by Source 2019 & 2032
- Table 5: Global Edible Packaging Market Revenue Million Forecast, by Raw Material 2019 & 2032
- Table 6: Global Edible Packaging Market Volume K Tons Forecast, by Raw Material 2019 & 2032
- Table 7: Global Edible Packaging Market Revenue Million Forecast, by End-User Industry 2019 & 2032
- Table 8: Global Edible Packaging Market Volume K Tons Forecast, by End-User Industry 2019 & 2032
- Table 9: Global Edible Packaging Market Revenue Million Forecast, by Region 2019 & 2032
- Table 10: Global Edible Packaging Market Volume K Tons Forecast, by Region 2019 & 2032
- Table 11: Global Edible Packaging Market Revenue Million Forecast, by Source 2019 & 2032
- Table 12: Global Edible Packaging Market Volume K Tons Forecast, by Source 2019 & 2032
- Table 13: Global Edible Packaging Market Revenue Million Forecast, by Raw Material 2019 & 2032
- Table 14: Global Edible Packaging Market Volume K Tons Forecast, by Raw Material 2019 & 2032
- Table 15: Global Edible Packaging Market Revenue Million Forecast, by End-User Industry 2019 & 2032
- Table 16: Global Edible Packaging Market Volume K Tons Forecast, by End-User Industry 2019 & 2032
- Table 17: Global Edible Packaging Market Revenue Million Forecast, by Country 2019 & 2032
- Table 18: Global Edible Packaging Market Volume K Tons Forecast, by Country 2019 & 2032
- Table 19: United States Edible Packaging Market Revenue (Million) Forecast, by Application 2019 & 2032
- Table 20: United States Edible Packaging Market Volume (K Tons) Forecast, by Application 2019 & 2032
- Table 21: Canada Edible Packaging Market Revenue (Million) Forecast, by Application 2019 & 2032
- Table 22: Canada Edible Packaging Market Volume (K Tons) Forecast, by Application 2019 & 2032
- Table 23: Mexico Edible Packaging Market Revenue (Million) Forecast, by Application 2019 & 2032
- Table 24: Mexico Edible Packaging Market Volume (K Tons) Forecast, by Application 2019 & 2032
- Table 25: Global Edible Packaging Market Revenue Million Forecast, by Source 2019 & 2032
- Table 26: Global Edible Packaging Market Volume K Tons Forecast, by Source 2019 & 2032
- Table 27: Global Edible Packaging Market Revenue Million Forecast, by Raw Material 2019 & 2032
- Table 28: Global Edible Packaging Market Volume K Tons Forecast, by Raw Material 2019 & 2032
- Table 29: Global Edible Packaging Market Revenue Million Forecast, by End-User Industry 2019 & 2032
- Table 30: Global Edible Packaging Market Volume K Tons Forecast, by End-User Industry 2019 & 2032
- Table 31: Global Edible Packaging Market Revenue Million Forecast, by Country 2019 & 2032
- Table 32: Global Edible Packaging Market Volume K Tons Forecast, by Country 2019 & 2032
- Table 33: Brazil Edible Packaging Market Revenue (Million) Forecast, by Application 2019 & 2032
- Table 34: Brazil Edible Packaging Market Volume (K Tons) Forecast, by Application 2019 & 2032
- Table 35: Argentina Edible Packaging Market Revenue (Million) Forecast, by Application 2019 & 2032
- Table 36: Argentina Edible Packaging Market Volume (K Tons) Forecast, by Application 2019 & 2032
- Table 37: Rest of South America Edible Packaging Market Revenue (Million) Forecast, by Application 2019 & 2032
- Table 38: Rest of South America Edible Packaging Market Volume (K Tons) Forecast, by Application 2019 & 2032
- Table 39: Global Edible Packaging Market Revenue Million Forecast, by Source 2019 & 2032
- Table 40: Global Edible Packaging Market Volume K Tons Forecast, by Source 2019 & 2032
- Table 41: Global Edible Packaging Market Revenue Million Forecast, by Raw Material 2019 & 2032
- Table 42: Global Edible Packaging Market Volume K Tons Forecast, by Raw Material 2019 & 2032
- Table 43: Global Edible Packaging Market Revenue Million Forecast, by End-User Industry 2019 & 2032
- Table 44: Global Edible Packaging Market Volume K Tons Forecast, by End-User Industry 2019 & 2032
- Table 45: Global Edible Packaging Market Revenue Million Forecast, by Country 2019 & 2032
- Table 46: Global Edible Packaging Market Volume K Tons Forecast, by Country 2019 & 2032
- Table 47: United Kingdom Edible Packaging Market Revenue (Million) Forecast, by Application 2019 & 2032
- Table 48: United Kingdom Edible Packaging Market Volume (K Tons) Forecast, by Application 2019 & 2032
- Table 49: Germany Edible Packaging Market Revenue (Million) Forecast, by Application 2019 & 2032
- Table 50: Germany Edible Packaging Market Volume (K Tons) Forecast, by Application 2019 & 2032
- Table 51: France Edible Packaging Market Revenue (Million) Forecast, by Application 2019 & 2032
- Table 52: France Edible Packaging Market Volume (K Tons) Forecast, by Application 2019 & 2032
- Table 53: Italy Edible Packaging Market Revenue (Million) Forecast, by Application 2019 & 2032
- Table 54: Italy Edible Packaging Market Volume (K Tons) Forecast, by Application 2019 & 2032
- Table 55: Spain Edible Packaging Market Revenue (Million) Forecast, by Application 2019 & 2032
- Table 56: Spain Edible Packaging Market Volume (K Tons) Forecast, by Application 2019 & 2032
- Table 57: Russia Edible Packaging Market Revenue (Million) Forecast, by Application 2019 & 2032
- Table 58: Russia Edible Packaging Market Volume (K Tons) Forecast, by Application 2019 & 2032
- Table 59: Benelux Edible Packaging Market Revenue (Million) Forecast, by Application 2019 & 2032
- Table 60: Benelux Edible Packaging Market Volume (K Tons) Forecast, by Application 2019 & 2032
- Table 61: Nordics Edible Packaging Market Revenue (Million) Forecast, by Application 2019 & 2032
- Table 62: Nordics Edible Packaging Market Volume (K Tons) Forecast, by Application 2019 & 2032
- Table 63: Rest of Europe Edible Packaging Market Revenue (Million) Forecast, by Application 2019 & 2032
- Table 64: Rest of Europe Edible Packaging Market Volume (K Tons) Forecast, by Application 2019 & 2032
- Table 65: Global Edible Packaging Market Revenue Million Forecast, by Source 2019 & 2032
- Table 66: Global Edible Packaging Market Volume K Tons Forecast, by Source 2019 & 2032
- Table 67: Global Edible Packaging Market Revenue Million Forecast, by Raw Material 2019 & 2032
- Table 68: Global Edible Packaging Market Volume K Tons Forecast, by Raw Material 2019 & 2032
- Table 69: Global Edible Packaging Market Revenue Million Forecast, by End-User Industry 2019 & 2032
- Table 70: Global Edible Packaging Market Volume K Tons Forecast, by End-User Industry 2019 & 2032
- Table 71: Global Edible Packaging Market Revenue Million Forecast, by Country 2019 & 2032
- Table 72: Global Edible Packaging Market Volume K Tons Forecast, by Country 2019 & 2032
- Table 73: Turkey Edible Packaging Market Revenue (Million) Forecast, by Application 2019 & 2032
- Table 74: Turkey Edible Packaging Market Volume (K Tons) Forecast, by Application 2019 & 2032
- Table 75: Israel Edible Packaging Market Revenue (Million) Forecast, by Application 2019 & 2032
- Table 76: Israel Edible Packaging Market Volume (K Tons) Forecast, by Application 2019 & 2032
- Table 77: GCC Edible Packaging Market Revenue (Million) Forecast, by Application 2019 & 2032
- Table 78: GCC Edible Packaging Market Volume (K Tons) Forecast, by Application 2019 & 2032
- Table 79: North Africa Edible Packaging Market Revenue (Million) Forecast, by Application 2019 & 2032
- Table 80: North Africa Edible Packaging Market Volume (K Tons) Forecast, by Application 2019 & 2032
- Table 81: South Africa Edible Packaging Market Revenue (Million) Forecast, by Application 2019 & 2032
- Table 82: South Africa Edible Packaging Market Volume (K Tons) Forecast, by Application 2019 & 2032
- Table 83: Rest of Middle East & Africa Edible Packaging Market Revenue (Million) Forecast, by Application 2019 & 2032
- Table 84: Rest of Middle East & Africa Edible Packaging Market Volume (K Tons) Forecast, by Application 2019 & 2032
- Table 85: Global Edible Packaging Market Revenue Million Forecast, by Source 2019 & 2032
- Table 86: Global Edible Packaging Market Volume K Tons Forecast, by Source 2019 & 2032
- Table 87: Global Edible Packaging Market Revenue Million Forecast, by Raw Material 2019 & 2032
- Table 88: Global Edible Packaging Market Volume K Tons Forecast, by Raw Material 2019 & 2032
- Table 89: Global Edible Packaging Market Revenue Million Forecast, by End-User Industry 2019 & 2032
- Table 90: Global Edible Packaging Market Volume K Tons Forecast, by End-User Industry 2019 & 2032
- Table 91: Global Edible Packaging Market Revenue Million Forecast, by Country 2019 & 2032
- Table 92: Global Edible Packaging Market Volume K Tons Forecast, by Country 2019 & 2032
- Table 93: China Edible Packaging Market Revenue (Million) Forecast, by Application 2019 & 2032
- Table 94: China Edible Packaging Market Volume (K Tons) Forecast, by Application 2019 & 2032
- Table 95: India Edible Packaging Market Revenue (Million) Forecast, by Application 2019 & 2032
- Table 96: India Edible Packaging Market Volume (K Tons) Forecast, by Application 2019 & 2032
- Table 97: Japan Edible Packaging Market Revenue (Million) Forecast, by Application 2019 & 2032
- Table 98: Japan Edible Packaging Market Volume (K Tons) Forecast, by Application 2019 & 2032
- Table 99: South Korea Edible Packaging Market Revenue (Million) Forecast, by Application 2019 & 2032
- Table 100: South Korea Edible Packaging Market Volume (K Tons) Forecast, by Application 2019 & 2032
- Table 101: ASEAN Edible Packaging Market Revenue (Million) Forecast, by Application 2019 & 2032
- Table 102: ASEAN Edible Packaging Market Volume (K Tons) Forecast, by Application 2019 & 2032
- Table 103: Oceania Edible Packaging Market Revenue (Million) Forecast, by Application 2019 & 2032
- Table 104: Oceania Edible Packaging Market Volume (K Tons) Forecast, by Application 2019 & 2032
- Table 105: Rest of Asia Pacific Edible Packaging Market Revenue (Million) Forecast, by Application 2019 & 2032
- Table 106: Rest of Asia Pacific Edible Packaging Market Volume (K Tons) Forecast, by Application 2019 & 2032
Frequently Asked Questions
1. What is the projected Compound Annual Growth Rate (CAGR) of the Edible Packaging Market?
The projected CAGR is approximately 6.68%.
2. Which companies are prominent players in the Edible Packaging Market?
Key companies in the market include Envigreen Biotech India Private Ltd, Notpla Limited, Evoware (PT Evogaia Karya Indonesia), Amtrex Nature Care Pvt Ltd, Nagase America LLC (Nagase & Co Ltd ), TSUKIOKA FILM PHARMA CO LTD, ECOLOTEC LIMITED, Devro PLC (Saria Nederland BV), Tipa Corp Ltd, JRF Technology LLC, Glanbia Plc.
3. What are the main segments of the Edible Packaging Market?
The market segments include Source, Raw Material, End-User Industry.
4. Can you provide details about the market size?
The market size is estimated to be USD 1.04 Million as of 2022.
5. What are some drivers contributing to market growth?
Need to Eliminate Type Waste Cycle and Increase Shelf-Life of the Product; Ban on Single-Use-Plastic and Growing Sustainability Concern.
6. What are the notable trends driving market growth?
The Increasing Demand for Sustainable Solutions and the Need for Extended Product Shelf-Life are helping drive market growth.
7. Are there any restraints impacting market growth?
High Cost of Production.
8. Can you provide examples of recent developments in the market?
N/A
9. What pricing options are available for accessing the report?
Pricing options include single-user, multi-user, and enterprise licenses priced at USD 4750, USD 5250, and USD 8750 respectively.
10. Is the market size provided in terms of value or volume?
The market size is provided in terms of value, measured in Million and volume, measured in K Tons.
11. Are there any specific market keywords associated with the report?
Yes, the market keyword associated with the report is "Edible Packaging Market," which aids in identifying and referencing the specific market segment covered.
12. How do I determine which pricing option suits my needs best?
The pricing options vary based on user requirements and access needs. Individual users may opt for single-user licenses, while businesses requiring broader access may choose multi-user or enterprise licenses for cost-effective access to the report.
13. Are there any additional resources or data provided in the Edible Packaging Market report?
While the report offers comprehensive insights, it's advisable to review the specific contents or supplementary materials provided to ascertain if additional resources or data are available.
14. How can I stay updated on further developments or reports in the Edible Packaging Market?
To stay informed about further developments, trends, and reports in the Edible Packaging Market, consider subscribing to industry newsletters, following relevant companies and organizations, or regularly checking reputable industry news sources and publications.
Methodology
Step 1 - Identification of Relevant Samples Size from Population Database


Step 2 - Approaches for Defining Global Market Size (Value, Volume* & Price*)

Note*: In applicable scenarios
Step 3 - Data Sources
Primary Research
- Web Analytics
- Survey Reports
- Research Institute
- Latest Research Reports
- Opinion Leaders
Secondary Research
- Annual Reports
- White Paper
- Latest Press Release
- Industry Association
- Paid Database
- Investor Presentations

Step 4 - Data Triangulation
Involves using different sources of information in order to increase the validity of a study
These sources are likely to be stakeholders in a program - participants, other researchers, program staff, other community members, and so on.
Then we put all data in single framework & apply various statistical tools to find out the dynamic on the market.
During the analysis stage, feedback from the stakeholder groups would be compared to determine areas of agreement as well as areas of divergence


