

Key Insights
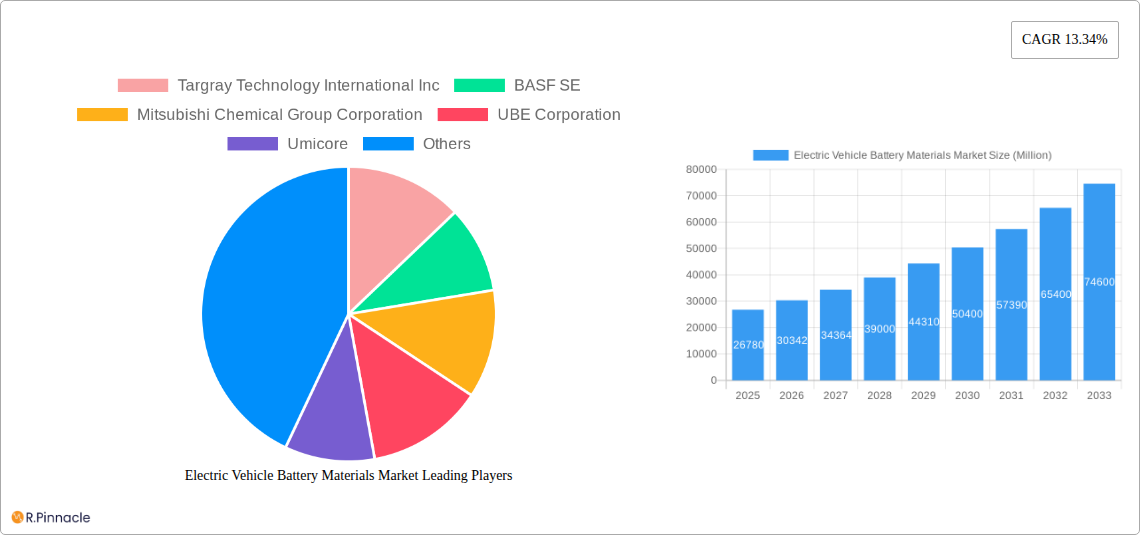
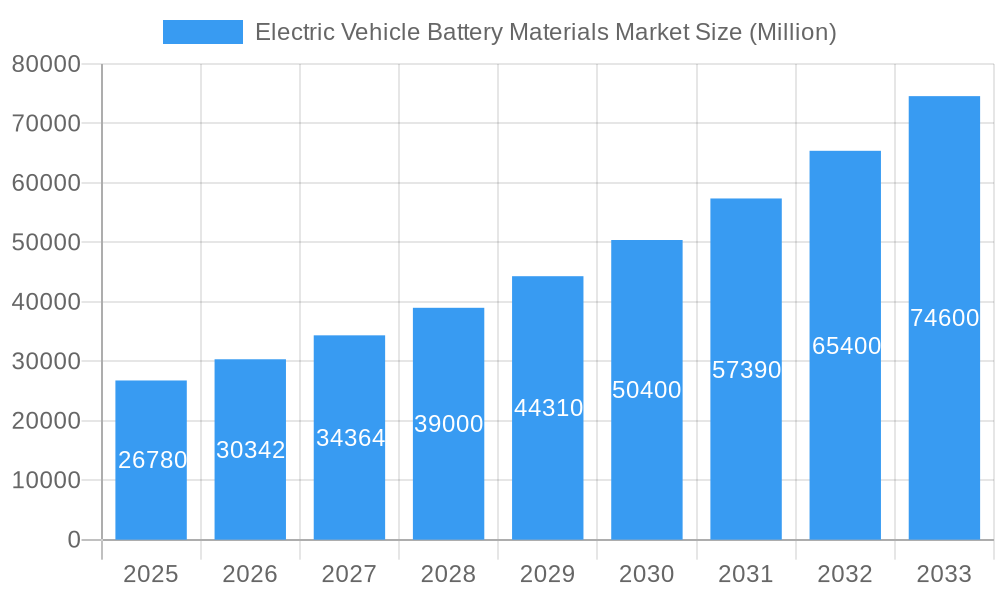
The Electric Vehicle (EV) Battery Materials market is experiencing robust growth, projected to reach \$26.78 billion in 2025 and maintain a Compound Annual Growth Rate (CAGR) of 13.34% from 2025 to 2033. This expansion is fueled by the surging global demand for electric vehicles driven by environmental concerns, government regulations promoting EV adoption, and advancements in battery technology leading to improved energy density and lifespan. Key drivers include the increasing affordability of EVs, expanding charging infrastructure, and the growing awareness of climate change. Furthermore, ongoing research and development efforts are focused on exploring alternative battery chemistries beyond lithium-ion, such as solid-state batteries, which offer potential improvements in safety and performance, further stimulating market growth. Major players like Targray Technology International Inc, BASF SE, and Mitsubishi Chemical Group Corporation are actively investing in research, development, and strategic partnerships to capitalize on this expanding market.
Electric Vehicle Battery Materials Market Market Size (In Billion)
However, several restraints could impact the market's trajectory. Supply chain disruptions, particularly concerning the availability of critical raw materials like lithium, cobalt, and nickel, pose a significant challenge. Fluctuations in raw material prices, geopolitical instability affecting sourcing regions, and the complexity of battery recycling and waste management present further obstacles. Despite these limitations, the long-term outlook remains positive, driven by consistent technological advancements, supportive government policies, and the undeniable shift towards sustainable transportation solutions. Market segmentation, while not explicitly provided, is likely based on material type (lithium, cobalt, nickel, graphite, etc.), battery chemistry (lithium-ion, solid-state, etc.), and geographic region. The market's future growth will heavily rely on overcoming the supply chain vulnerabilities and further developing sustainable and cost-effective battery technologies.
Electric Vehicle Battery Materials Market Company Market Share
Electric Vehicle Battery Materials Market: A Comprehensive Report (2019-2033)
This in-depth report provides a comprehensive analysis of the Electric Vehicle (EV) Battery Materials market, offering invaluable insights for industry professionals, investors, and stakeholders. With a study period spanning 2019-2033, a base year of 2025, and a forecast period of 2025-2033, this report leverages rigorous data analysis to illuminate current market dynamics and predict future trends. The market is expected to reach xx Million by 2033, exhibiting a CAGR of xx% during the forecast period.
Electric Vehicle Battery Materials Market Structure & Innovation Trends
This section delves into the competitive landscape of the EV battery materials market, analyzing market concentration, innovation drivers, regulatory influences, and market dynamics. The market exhibits a moderately concentrated structure, with key players holding significant market share. For instance, BASF SE and Sumitomo Chemical Co Ltd are major players holding xx% and xx% of the market share respectively (2024 estimates). The report analyzes the impact of mergers and acquisitions (M&A) activities, with an estimated xx Million USD in M&A deal value recorded in 2024.
- Market Concentration: Moderately concentrated, with a few dominant players.
- Innovation Drivers: Demand for high-energy-density batteries, stringent emission regulations, and government incentives.
- Regulatory Frameworks: Government policies supporting EV adoption significantly impact market growth.
- Product Substitutes: Research into alternative battery technologies presents potential challenges.
- End-User Demographics: Growing adoption of EVs across various segments (passenger vehicles, commercial vehicles).
- M&A Activities: Significant M&A activity observed, driving consolidation within the market.
Electric Vehicle Battery Materials Market Dynamics & Trends
This section explores the driving forces shaping the EV battery materials market. Key growth drivers include the burgeoning global demand for electric vehicles, fueled by increasing environmental concerns and government regulations aimed at reducing carbon emissions. Technological advancements, such as the development of solid-state batteries and improved battery chemistries, are significantly impacting market growth. Consumer preferences are shifting towards electric vehicles, further accelerating market expansion. The competitive dynamics are intense, with companies investing heavily in R&D to gain a competitive edge.
Dominant Regions & Segments in Electric Vehicle Battery Materials Market
The report identifies [Region Name] as the leading region, driven by factors such as supportive government policies, robust infrastructure for EV manufacturing, and a large consumer base.
- Key Drivers in [Region Name]:
- Favorable government incentives and subsidies for EV adoption.
- Well-established supply chain for battery materials.
- Growing consumer demand for electric vehicles.
- Significant investments in battery research and development.
The analysis further segments the market by battery material type (e.g., lithium-ion, solid-state), cathode material, anode material, electrolyte, and separator. Each segment's growth trajectory is analyzed in detail.
Electric Vehicle Battery Materials Market Product Innovations
Recent innovations include the 24M ImpervioTM battery separator (January 2024), enhancing battery safety for both lithium-ion and lithium-metal batteries. MIT's development of a novel lithium-ion battery with an organic material-based cathode (January 2024) represents a significant advancement, potentially reducing reliance on cobalt and nickel. These innovations are expected to significantly impact market dynamics and drive future growth.
Report Scope & Segmentation Analysis
The report provides a detailed segmentation analysis of the EV battery materials market. This includes segmentation by battery type (lithium-ion, solid-state, etc.), cathode material (NCM, LFP, etc.), anode material (graphite, silicon, etc.), electrolyte type, and separator material. Growth projections, market sizes, and competitive dynamics are analyzed for each segment. The market is further segmented by region (North America, Europe, Asia-Pacific, etc.) considering regional growth potential.
Key Drivers of Electric Vehicle Battery Materials Market Growth
The market’s growth is propelled by several key factors: the increasing adoption of electric vehicles globally due to environmental concerns and government regulations; technological advancements resulting in improved battery performance and longevity; and substantial investments in research and development of innovative battery technologies and materials.
Challenges in the Electric Vehicle Battery Materials Market Sector
Challenges include supply chain disruptions impacting the availability of raw materials; price volatility of key raw materials; and the need for significant investments in infrastructure for battery material production and recycling. Regulatory hurdles and geopolitical factors also present obstacles to market growth. These issues can impact production costs and availability.
Emerging Opportunities in Electric Vehicle Battery Materials Market
Emerging opportunities include the growth of the solid-state battery market, advancements in battery recycling technologies, and the exploration of new battery chemistries to enhance performance and reduce reliance on critical raw materials. The expansion into new geographical markets and the increasing adoption of EVs in various sectors present significant opportunities for growth.
Leading Players in the Electric Vehicle Battery Materials Market Market
- Targray Technology International Inc
- BASF SE
- Mitsubishi Chemical Group Corporation
- UBE Corporation
- Umicore
- Sumitomo Chemical Co Ltd
- Nichia Corporation
- ENTEK International LLC
- Arkema SA
- Kureha Corporation
- List Not Exhaustive
Key Developments in Electric Vehicle Battery Materials Market Industry
- January 2024: 24M introduced the 24M ImpervioTM battery separator, significantly enhancing battery safety.
- January 2024: MIT researchers developed a novel lithium-ion battery with an organic material-based cathode, potentially revolutionizing battery technology.
Future Outlook for Electric Vehicle Battery Materials Market Market
The future outlook for the EV battery materials market is extremely positive, driven by continued growth in EV adoption, technological advancements, and supportive government policies. Strategic investments in R&D, sustainable sourcing of raw materials, and expansion into new markets will be crucial for success in this dynamic sector. The market is poised for significant expansion, presenting substantial opportunities for both established players and new entrants.
Electric Vehicle Battery Materials Market Segmentation
-
1. Battery Type
- 1.1. Lithium-ion
- 1.2. Lead-acid
- 1.3. Other Battery Types
-
2. Material
- 2.1. Anode
- 2.2. Cathode
- 2.3. Separator
- 2.4. Electrolyte
- 2.5. Other Materials
Electric Vehicle Battery Materials Market Segmentation By Geography
-
1. North America
- 1.1. United States
- 1.2. Canada
- 1.3. Rest of North America
-
2. Europe
- 2.1. Germany
- 2.2. France
- 2.3. United Kingdom
- 2.4. Italy
- 2.5. Spain
- 2.6. NORDIC
- 2.7. Russia
- 2.8. Turkey
- 2.9. Rest of Europe
-
3. Asia Pacific
- 3.1. China
- 3.2. India
- 3.3. Australia
- 3.4. Japan
- 3.5. South Korea
- 3.6. Malaysia
- 3.7. Thailand
- 3.8. Indonesia
- 3.9. Vietnam
- 3.10. Rest of Asia Pacific
-
4. Middle East and Africa
- 4.1. Saudi Arabia
- 4.2. United Arab Emirates
- 4.3. Nigeria
- 4.4. Egypt
- 4.5. Qatar
- 4.6. South Africa
- 4.7. Rest of Middle East and Africa
-
5. South America
- 5.1. Brazil
- 5.2. Argentina
- 5.3. Colombia
- 5.4. Rest of South America
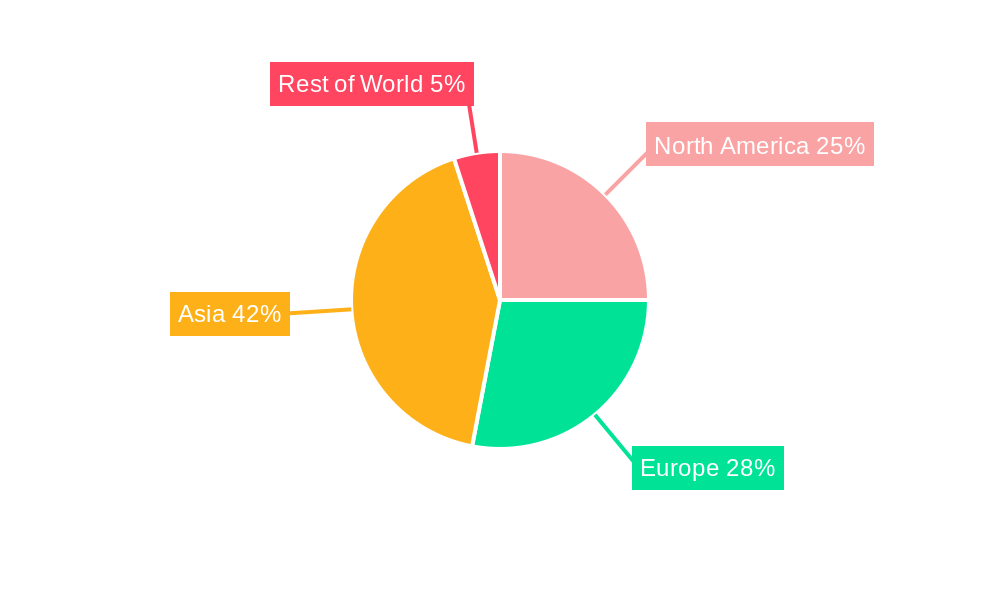
Electric Vehicle Battery Materials Market Regional Market Share
Geographic Coverage of Electric Vehicle Battery Materials Market
Electric Vehicle Battery Materials Market REPORT HIGHLIGHTS
| Aspects | Details |
|---|---|
| Study Period | 2020-2034 |
| Base Year | 2025 |
| Estimated Year | 2026 |
| Forecast Period | 2026-2034 |
| Historical Period | 2020-2025 |
| Growth Rate | CAGR of 13.34% from 2020-2034 |
| Segmentation |
|
Table of Contents
- 1. Introduction
- 1.1. Research Scope
- 1.2. Market Segmentation
- 1.3. Research Objective
- 1.4. Definitions and Assumptions
- 2. Executive Summary
- 2.1. Market Snapshot
- 3. Market Dynamics
- 3.1. Market Drivers
- 3.2. Market Restrains
- 3.3. Market Trends
- 3.4. Market Opportunities
- 4. Market Factor Analysis
- 4.1. Porters Five Forces
- 4.1.1. Bargaining Power of Suppliers
- 4.1.2. Bargaining Power of Buyers
- 4.1.3. Threat of New Entrants
- 4.1.4. Threat of Substitutes
- 4.1.5. Competitive Rivalry
- 4.2. PESTEL analysis
- 4.3. BCG Analysis
- 4.3.1. Stars (High Growth, High Market Share)
- 4.3.2. Cash Cows (Low Growth, High Market Share)
- 4.3.3. Question Mark (High Growth, Low Market Share)
- 4.3.4. Dogs (Low Growth, Low Market Share)
- 4.4. Ansoff Matrix Analysis
- 4.5. Supply Chain Analysis
- 4.6. Regulatory Landscape
- 4.7. Current Market Potential and Opportunity Assessment (TAM–SAM–SOM Framework)
- 4.8. PRI Analyst Note
- 4.1. Porters Five Forces
- 5. Market Analysis, Insights and Forecast 2021-2033
- 5.1. Market Analysis, Insights and Forecast - by Battery Type
- 5.1.1. Lithium-ion
- 5.1.2. Lead-acid
- 5.1.3. Other Battery Types
- 5.2. Market Analysis, Insights and Forecast - by Material
- 5.2.1. Anode
- 5.2.2. Cathode
- 5.2.3. Separator
- 5.2.4. Electrolyte
- 5.2.5. Other Materials
- 5.3. Market Analysis, Insights and Forecast - by Region
- 5.3.1. North America
- 5.3.2. Europe
- 5.3.3. Asia Pacific
- 5.3.4. Middle East and Africa
- 5.3.5. South America
- 5.1. Market Analysis, Insights and Forecast - by Battery Type
- 6. Global Electric Vehicle Battery Materials Market Analysis, Insights and Forecast, 2021-2033
- 6.1. Market Analysis, Insights and Forecast - by Battery Type
- 6.1.1. Lithium-ion
- 6.1.2. Lead-acid
- 6.1.3. Other Battery Types
- 6.2. Market Analysis, Insights and Forecast - by Material
- 6.2.1. Anode
- 6.2.2. Cathode
- 6.2.3. Separator
- 6.2.4. Electrolyte
- 6.2.5. Other Materials
- 6.1. Market Analysis, Insights and Forecast - by Battery Type
- 7. North America Electric Vehicle Battery Materials Market Analysis, Insights and Forecast, 2020-2032
- 7.1. Market Analysis, Insights and Forecast - by Battery Type
- 7.1.1. Lithium-ion
- 7.1.2. Lead-acid
- 7.1.3. Other Battery Types
- 7.2. Market Analysis, Insights and Forecast - by Material
- 7.2.1. Anode
- 7.2.2. Cathode
- 7.2.3. Separator
- 7.2.4. Electrolyte
- 7.2.5. Other Materials
- 7.1. Market Analysis, Insights and Forecast - by Battery Type
- 8. Europe Electric Vehicle Battery Materials Market Analysis, Insights and Forecast, 2020-2032
- 8.1. Market Analysis, Insights and Forecast - by Battery Type
- 8.1.1. Lithium-ion
- 8.1.2. Lead-acid
- 8.1.3. Other Battery Types
- 8.2. Market Analysis, Insights and Forecast - by Material
- 8.2.1. Anode
- 8.2.2. Cathode
- 8.2.3. Separator
- 8.2.4. Electrolyte
- 8.2.5. Other Materials
- 8.1. Market Analysis, Insights and Forecast - by Battery Type
- 9. Asia Pacific Electric Vehicle Battery Materials Market Analysis, Insights and Forecast, 2020-2032
- 9.1. Market Analysis, Insights and Forecast - by Battery Type
- 9.1.1. Lithium-ion
- 9.1.2. Lead-acid
- 9.1.3. Other Battery Types
- 9.2. Market Analysis, Insights and Forecast - by Material
- 9.2.1. Anode
- 9.2.2. Cathode
- 9.2.3. Separator
- 9.2.4. Electrolyte
- 9.2.5. Other Materials
- 9.1. Market Analysis, Insights and Forecast - by Battery Type
- 10. Middle East and Africa Electric Vehicle Battery Materials Market Analysis, Insights and Forecast, 2020-2032
- 10.1. Market Analysis, Insights and Forecast - by Battery Type
- 10.1.1. Lithium-ion
- 10.1.2. Lead-acid
- 10.1.3. Other Battery Types
- 10.2. Market Analysis, Insights and Forecast - by Material
- 10.2.1. Anode
- 10.2.2. Cathode
- 10.2.3. Separator
- 10.2.4. Electrolyte
- 10.2.5. Other Materials
- 10.1. Market Analysis, Insights and Forecast - by Battery Type
- 11. South America Electric Vehicle Battery Materials Market Analysis, Insights and Forecast, 2020-2032
- 11.1. Market Analysis, Insights and Forecast - by Battery Type
- 11.1.1. Lithium-ion
- 11.1.2. Lead-acid
- 11.1.3. Other Battery Types
- 11.2. Market Analysis, Insights and Forecast - by Material
- 11.2.1. Anode
- 11.2.2. Cathode
- 11.2.3. Separator
- 11.2.4. Electrolyte
- 11.2.5. Other Materials
- 11.1. Market Analysis, Insights and Forecast - by Battery Type
- 12. Competitive Analysis
- 12.1. Company Profiles
- 12.1.1 Targray Technology International Inc
- 12.1.1.1. Company Overview
- 12.1.1.2. Products
- 12.1.1.3. Company Financials
- 12.1.1.4. SWOT Analysis
- 12.1.2 BASF SE
- 12.1.2.1. Company Overview
- 12.1.2.2. Products
- 12.1.2.3. Company Financials
- 12.1.2.4. SWOT Analysis
- 12.1.3 Mitsubishi Chemical Group Corporation
- 12.1.3.1. Company Overview
- 12.1.3.2. Products
- 12.1.3.3. Company Financials
- 12.1.3.4. SWOT Analysis
- 12.1.4 UBE Corporation
- 12.1.4.1. Company Overview
- 12.1.4.2. Products
- 12.1.4.3. Company Financials
- 12.1.4.4. SWOT Analysis
- 12.1.5 Umicore
- 12.1.5.1. Company Overview
- 12.1.5.2. Products
- 12.1.5.3. Company Financials
- 12.1.5.4. SWOT Analysis
- 12.1.6 Sumitomo Chemical Co Ltd
- 12.1.6.1. Company Overview
- 12.1.6.2. Products
- 12.1.6.3. Company Financials
- 12.1.6.4. SWOT Analysis
- 12.1.7 Nichia Corporation
- 12.1.7.1. Company Overview
- 12.1.7.2. Products
- 12.1.7.3. Company Financials
- 12.1.7.4. SWOT Analysis
- 12.1.8 ENTEK International LLC
- 12.1.8.1. Company Overview
- 12.1.8.2. Products
- 12.1.8.3. Company Financials
- 12.1.8.4. SWOT Analysis
- 12.1.9 Arkema SA
- 12.1.9.1. Company Overview
- 12.1.9.2. Products
- 12.1.9.3. Company Financials
- 12.1.9.4. SWOT Analysis
- 12.1.10 Kureha Corporation*List Not Exhaustive 6 4 List of Other Prominent Companies6 5 Market Ranking Analysi
- 12.1.10.1. Company Overview
- 12.1.10.2. Products
- 12.1.10.3. Company Financials
- 12.1.10.4. SWOT Analysis
- 12.1.1 Targray Technology International Inc
- 12.2. Market Entropy
- 12.2.1 Company's Key Areas Served
- 12.2.2 Recent Developments
- 12.3. Company Market Share Analysis 2025
- 12.3.1 Top 5 Companies Market Share Analysis
- 12.3.2 Top 3 Companies Market Share Analysis
- 12.4. List of Potential Customers
- 13. Research Methodology
List of Figures
- Figure 1: Global Electric Vehicle Battery Materials Market Revenue Breakdown (Million, %) by Region 2025 & 2033
- Figure 2: Global Electric Vehicle Battery Materials Market Volume Breakdown (Billion, %) by Region 2025 & 2033
- Figure 3: North America Electric Vehicle Battery Materials Market Revenue (Million), by Battery Type 2025 & 2033
- Figure 4: North America Electric Vehicle Battery Materials Market Volume (Billion), by Battery Type 2025 & 2033
- Figure 5: North America Electric Vehicle Battery Materials Market Revenue Share (%), by Battery Type 2025 & 2033
- Figure 6: North America Electric Vehicle Battery Materials Market Volume Share (%), by Battery Type 2025 & 2033
- Figure 7: North America Electric Vehicle Battery Materials Market Revenue (Million), by Material 2025 & 2033
- Figure 8: North America Electric Vehicle Battery Materials Market Volume (Billion), by Material 2025 & 2033
- Figure 9: North America Electric Vehicle Battery Materials Market Revenue Share (%), by Material 2025 & 2033
- Figure 10: North America Electric Vehicle Battery Materials Market Volume Share (%), by Material 2025 & 2033
- Figure 11: North America Electric Vehicle Battery Materials Market Revenue (Million), by Country 2025 & 2033
- Figure 12: North America Electric Vehicle Battery Materials Market Volume (Billion), by Country 2025 & 2033
- Figure 13: North America Electric Vehicle Battery Materials Market Revenue Share (%), by Country 2025 & 2033
- Figure 14: North America Electric Vehicle Battery Materials Market Volume Share (%), by Country 2025 & 2033
- Figure 15: Europe Electric Vehicle Battery Materials Market Revenue (Million), by Battery Type 2025 & 2033
- Figure 16: Europe Electric Vehicle Battery Materials Market Volume (Billion), by Battery Type 2025 & 2033
- Figure 17: Europe Electric Vehicle Battery Materials Market Revenue Share (%), by Battery Type 2025 & 2033
- Figure 18: Europe Electric Vehicle Battery Materials Market Volume Share (%), by Battery Type 2025 & 2033
- Figure 19: Europe Electric Vehicle Battery Materials Market Revenue (Million), by Material 2025 & 2033
- Figure 20: Europe Electric Vehicle Battery Materials Market Volume (Billion), by Material 2025 & 2033
- Figure 21: Europe Electric Vehicle Battery Materials Market Revenue Share (%), by Material 2025 & 2033
- Figure 22: Europe Electric Vehicle Battery Materials Market Volume Share (%), by Material 2025 & 2033
- Figure 23: Europe Electric Vehicle Battery Materials Market Revenue (Million), by Country 2025 & 2033
- Figure 24: Europe Electric Vehicle Battery Materials Market Volume (Billion), by Country 2025 & 2033
- Figure 25: Europe Electric Vehicle Battery Materials Market Revenue Share (%), by Country 2025 & 2033
- Figure 26: Europe Electric Vehicle Battery Materials Market Volume Share (%), by Country 2025 & 2033
- Figure 27: Asia Pacific Electric Vehicle Battery Materials Market Revenue (Million), by Battery Type 2025 & 2033
- Figure 28: Asia Pacific Electric Vehicle Battery Materials Market Volume (Billion), by Battery Type 2025 & 2033
- Figure 29: Asia Pacific Electric Vehicle Battery Materials Market Revenue Share (%), by Battery Type 2025 & 2033
- Figure 30: Asia Pacific Electric Vehicle Battery Materials Market Volume Share (%), by Battery Type 2025 & 2033
- Figure 31: Asia Pacific Electric Vehicle Battery Materials Market Revenue (Million), by Material 2025 & 2033
- Figure 32: Asia Pacific Electric Vehicle Battery Materials Market Volume (Billion), by Material 2025 & 2033
- Figure 33: Asia Pacific Electric Vehicle Battery Materials Market Revenue Share (%), by Material 2025 & 2033
- Figure 34: Asia Pacific Electric Vehicle Battery Materials Market Volume Share (%), by Material 2025 & 2033
- Figure 35: Asia Pacific Electric Vehicle Battery Materials Market Revenue (Million), by Country 2025 & 2033
- Figure 36: Asia Pacific Electric Vehicle Battery Materials Market Volume (Billion), by Country 2025 & 2033
- Figure 37: Asia Pacific Electric Vehicle Battery Materials Market Revenue Share (%), by Country 2025 & 2033
- Figure 38: Asia Pacific Electric Vehicle Battery Materials Market Volume Share (%), by Country 2025 & 2033
- Figure 39: Middle East and Africa Electric Vehicle Battery Materials Market Revenue (Million), by Battery Type 2025 & 2033
- Figure 40: Middle East and Africa Electric Vehicle Battery Materials Market Volume (Billion), by Battery Type 2025 & 2033
- Figure 41: Middle East and Africa Electric Vehicle Battery Materials Market Revenue Share (%), by Battery Type 2025 & 2033
- Figure 42: Middle East and Africa Electric Vehicle Battery Materials Market Volume Share (%), by Battery Type 2025 & 2033
- Figure 43: Middle East and Africa Electric Vehicle Battery Materials Market Revenue (Million), by Material 2025 & 2033
- Figure 44: Middle East and Africa Electric Vehicle Battery Materials Market Volume (Billion), by Material 2025 & 2033
- Figure 45: Middle East and Africa Electric Vehicle Battery Materials Market Revenue Share (%), by Material 2025 & 2033
- Figure 46: Middle East and Africa Electric Vehicle Battery Materials Market Volume Share (%), by Material 2025 & 2033
- Figure 47: Middle East and Africa Electric Vehicle Battery Materials Market Revenue (Million), by Country 2025 & 2033
- Figure 48: Middle East and Africa Electric Vehicle Battery Materials Market Volume (Billion), by Country 2025 & 2033
- Figure 49: Middle East and Africa Electric Vehicle Battery Materials Market Revenue Share (%), by Country 2025 & 2033
- Figure 50: Middle East and Africa Electric Vehicle Battery Materials Market Volume Share (%), by Country 2025 & 2033
- Figure 51: South America Electric Vehicle Battery Materials Market Revenue (Million), by Battery Type 2025 & 2033
- Figure 52: South America Electric Vehicle Battery Materials Market Volume (Billion), by Battery Type 2025 & 2033
- Figure 53: South America Electric Vehicle Battery Materials Market Revenue Share (%), by Battery Type 2025 & 2033
- Figure 54: South America Electric Vehicle Battery Materials Market Volume Share (%), by Battery Type 2025 & 2033
- Figure 55: South America Electric Vehicle Battery Materials Market Revenue (Million), by Material 2025 & 2033
- Figure 56: South America Electric Vehicle Battery Materials Market Volume (Billion), by Material 2025 & 2033
- Figure 57: South America Electric Vehicle Battery Materials Market Revenue Share (%), by Material 2025 & 2033
- Figure 58: South America Electric Vehicle Battery Materials Market Volume Share (%), by Material 2025 & 2033
- Figure 59: South America Electric Vehicle Battery Materials Market Revenue (Million), by Country 2025 & 2033
- Figure 60: South America Electric Vehicle Battery Materials Market Volume (Billion), by Country 2025 & 2033
- Figure 61: South America Electric Vehicle Battery Materials Market Revenue Share (%), by Country 2025 & 2033
- Figure 62: South America Electric Vehicle Battery Materials Market Volume Share (%), by Country 2025 & 2033
List of Tables
- Table 1: Global Electric Vehicle Battery Materials Market Revenue Million Forecast, by Battery Type 2020 & 2033
- Table 2: Global Electric Vehicle Battery Materials Market Volume Billion Forecast, by Battery Type 2020 & 2033
- Table 3: Global Electric Vehicle Battery Materials Market Revenue Million Forecast, by Material 2020 & 2033
- Table 4: Global Electric Vehicle Battery Materials Market Volume Billion Forecast, by Material 2020 & 2033
- Table 5: Global Electric Vehicle Battery Materials Market Revenue Million Forecast, by Region 2020 & 2033
- Table 6: Global Electric Vehicle Battery Materials Market Volume Billion Forecast, by Region 2020 & 2033
- Table 7: Global Electric Vehicle Battery Materials Market Revenue Million Forecast, by Battery Type 2020 & 2033
- Table 8: Global Electric Vehicle Battery Materials Market Volume Billion Forecast, by Battery Type 2020 & 2033
- Table 9: Global Electric Vehicle Battery Materials Market Revenue Million Forecast, by Material 2020 & 2033
- Table 10: Global Electric Vehicle Battery Materials Market Volume Billion Forecast, by Material 2020 & 2033
- Table 11: Global Electric Vehicle Battery Materials Market Revenue Million Forecast, by Country 2020 & 2033
- Table 12: Global Electric Vehicle Battery Materials Market Volume Billion Forecast, by Country 2020 & 2033
- Table 13: United States Electric Vehicle Battery Materials Market Revenue (Million) Forecast, by Application 2020 & 2033
- Table 14: United States Electric Vehicle Battery Materials Market Volume (Billion) Forecast, by Application 2020 & 2033
- Table 15: Canada Electric Vehicle Battery Materials Market Revenue (Million) Forecast, by Application 2020 & 2033
- Table 16: Canada Electric Vehicle Battery Materials Market Volume (Billion) Forecast, by Application 2020 & 2033
- Table 17: Rest of North America Electric Vehicle Battery Materials Market Revenue (Million) Forecast, by Application 2020 & 2033
- Table 18: Rest of North America Electric Vehicle Battery Materials Market Volume (Billion) Forecast, by Application 2020 & 2033
- Table 19: Global Electric Vehicle Battery Materials Market Revenue Million Forecast, by Battery Type 2020 & 2033
- Table 20: Global Electric Vehicle Battery Materials Market Volume Billion Forecast, by Battery Type 2020 & 2033
- Table 21: Global Electric Vehicle Battery Materials Market Revenue Million Forecast, by Material 2020 & 2033
- Table 22: Global Electric Vehicle Battery Materials Market Volume Billion Forecast, by Material 2020 & 2033
- Table 23: Global Electric Vehicle Battery Materials Market Revenue Million Forecast, by Country 2020 & 2033
- Table 24: Global Electric Vehicle Battery Materials Market Volume Billion Forecast, by Country 2020 & 2033
- Table 25: Germany Electric Vehicle Battery Materials Market Revenue (Million) Forecast, by Application 2020 & 2033
- Table 26: Germany Electric Vehicle Battery Materials Market Volume (Billion) Forecast, by Application 2020 & 2033
- Table 27: France Electric Vehicle Battery Materials Market Revenue (Million) Forecast, by Application 2020 & 2033
- Table 28: France Electric Vehicle Battery Materials Market Volume (Billion) Forecast, by Application 2020 & 2033
- Table 29: United Kingdom Electric Vehicle Battery Materials Market Revenue (Million) Forecast, by Application 2020 & 2033
- Table 30: United Kingdom Electric Vehicle Battery Materials Market Volume (Billion) Forecast, by Application 2020 & 2033
- Table 31: Italy Electric Vehicle Battery Materials Market Revenue (Million) Forecast, by Application 2020 & 2033
- Table 32: Italy Electric Vehicle Battery Materials Market Volume (Billion) Forecast, by Application 2020 & 2033
- Table 33: Spain Electric Vehicle Battery Materials Market Revenue (Million) Forecast, by Application 2020 & 2033
- Table 34: Spain Electric Vehicle Battery Materials Market Volume (Billion) Forecast, by Application 2020 & 2033
- Table 35: NORDIC Electric Vehicle Battery Materials Market Revenue (Million) Forecast, by Application 2020 & 2033
- Table 36: NORDIC Electric Vehicle Battery Materials Market Volume (Billion) Forecast, by Application 2020 & 2033
- Table 37: Russia Electric Vehicle Battery Materials Market Revenue (Million) Forecast, by Application 2020 & 2033
- Table 38: Russia Electric Vehicle Battery Materials Market Volume (Billion) Forecast, by Application 2020 & 2033
- Table 39: Turkey Electric Vehicle Battery Materials Market Revenue (Million) Forecast, by Application 2020 & 2033
- Table 40: Turkey Electric Vehicle Battery Materials Market Volume (Billion) Forecast, by Application 2020 & 2033
- Table 41: Rest of Europe Electric Vehicle Battery Materials Market Revenue (Million) Forecast, by Application 2020 & 2033
- Table 42: Rest of Europe Electric Vehicle Battery Materials Market Volume (Billion) Forecast, by Application 2020 & 2033
- Table 43: Global Electric Vehicle Battery Materials Market Revenue Million Forecast, by Battery Type 2020 & 2033
- Table 44: Global Electric Vehicle Battery Materials Market Volume Billion Forecast, by Battery Type 2020 & 2033
- Table 45: Global Electric Vehicle Battery Materials Market Revenue Million Forecast, by Material 2020 & 2033
- Table 46: Global Electric Vehicle Battery Materials Market Volume Billion Forecast, by Material 2020 & 2033
- Table 47: Global Electric Vehicle Battery Materials Market Revenue Million Forecast, by Country 2020 & 2033
- Table 48: Global Electric Vehicle Battery Materials Market Volume Billion Forecast, by Country 2020 & 2033
- Table 49: China Electric Vehicle Battery Materials Market Revenue (Million) Forecast, by Application 2020 & 2033
- Table 50: China Electric Vehicle Battery Materials Market Volume (Billion) Forecast, by Application 2020 & 2033
- Table 51: India Electric Vehicle Battery Materials Market Revenue (Million) Forecast, by Application 2020 & 2033
- Table 52: India Electric Vehicle Battery Materials Market Volume (Billion) Forecast, by Application 2020 & 2033
- Table 53: Australia Electric Vehicle Battery Materials Market Revenue (Million) Forecast, by Application 2020 & 2033
- Table 54: Australia Electric Vehicle Battery Materials Market Volume (Billion) Forecast, by Application 2020 & 2033
- Table 55: Japan Electric Vehicle Battery Materials Market Revenue (Million) Forecast, by Application 2020 & 2033
- Table 56: Japan Electric Vehicle Battery Materials Market Volume (Billion) Forecast, by Application 2020 & 2033
- Table 57: South Korea Electric Vehicle Battery Materials Market Revenue (Million) Forecast, by Application 2020 & 2033
- Table 58: South Korea Electric Vehicle Battery Materials Market Volume (Billion) Forecast, by Application 2020 & 2033
- Table 59: Malaysia Electric Vehicle Battery Materials Market Revenue (Million) Forecast, by Application 2020 & 2033
- Table 60: Malaysia Electric Vehicle Battery Materials Market Volume (Billion) Forecast, by Application 2020 & 2033
- Table 61: Thailand Electric Vehicle Battery Materials Market Revenue (Million) Forecast, by Application 2020 & 2033
- Table 62: Thailand Electric Vehicle Battery Materials Market Volume (Billion) Forecast, by Application 2020 & 2033
- Table 63: Indonesia Electric Vehicle Battery Materials Market Revenue (Million) Forecast, by Application 2020 & 2033
- Table 64: Indonesia Electric Vehicle Battery Materials Market Volume (Billion) Forecast, by Application 2020 & 2033
- Table 65: Vietnam Electric Vehicle Battery Materials Market Revenue (Million) Forecast, by Application 2020 & 2033
- Table 66: Vietnam Electric Vehicle Battery Materials Market Volume (Billion) Forecast, by Application 2020 & 2033
- Table 67: Rest of Asia Pacific Electric Vehicle Battery Materials Market Revenue (Million) Forecast, by Application 2020 & 2033
- Table 68: Rest of Asia Pacific Electric Vehicle Battery Materials Market Volume (Billion) Forecast, by Application 2020 & 2033
- Table 69: Global Electric Vehicle Battery Materials Market Revenue Million Forecast, by Battery Type 2020 & 2033
- Table 70: Global Electric Vehicle Battery Materials Market Volume Billion Forecast, by Battery Type 2020 & 2033
- Table 71: Global Electric Vehicle Battery Materials Market Revenue Million Forecast, by Material 2020 & 2033
- Table 72: Global Electric Vehicle Battery Materials Market Volume Billion Forecast, by Material 2020 & 2033
- Table 73: Global Electric Vehicle Battery Materials Market Revenue Million Forecast, by Country 2020 & 2033
- Table 74: Global Electric Vehicle Battery Materials Market Volume Billion Forecast, by Country 2020 & 2033
- Table 75: Saudi Arabia Electric Vehicle Battery Materials Market Revenue (Million) Forecast, by Application 2020 & 2033
- Table 76: Saudi Arabia Electric Vehicle Battery Materials Market Volume (Billion) Forecast, by Application 2020 & 2033
- Table 77: United Arab Emirates Electric Vehicle Battery Materials Market Revenue (Million) Forecast, by Application 2020 & 2033
- Table 78: United Arab Emirates Electric Vehicle Battery Materials Market Volume (Billion) Forecast, by Application 2020 & 2033
- Table 79: Nigeria Electric Vehicle Battery Materials Market Revenue (Million) Forecast, by Application 2020 & 2033
- Table 80: Nigeria Electric Vehicle Battery Materials Market Volume (Billion) Forecast, by Application 2020 & 2033
- Table 81: Egypt Electric Vehicle Battery Materials Market Revenue (Million) Forecast, by Application 2020 & 2033
- Table 82: Egypt Electric Vehicle Battery Materials Market Volume (Billion) Forecast, by Application 2020 & 2033
- Table 83: Qatar Electric Vehicle Battery Materials Market Revenue (Million) Forecast, by Application 2020 & 2033
- Table 84: Qatar Electric Vehicle Battery Materials Market Volume (Billion) Forecast, by Application 2020 & 2033
- Table 85: South Africa Electric Vehicle Battery Materials Market Revenue (Million) Forecast, by Application 2020 & 2033
- Table 86: South Africa Electric Vehicle Battery Materials Market Volume (Billion) Forecast, by Application 2020 & 2033
- Table 87: Rest of Middle East and Africa Electric Vehicle Battery Materials Market Revenue (Million) Forecast, by Application 2020 & 2033
- Table 88: Rest of Middle East and Africa Electric Vehicle Battery Materials Market Volume (Billion) Forecast, by Application 2020 & 2033
- Table 89: Global Electric Vehicle Battery Materials Market Revenue Million Forecast, by Battery Type 2020 & 2033
- Table 90: Global Electric Vehicle Battery Materials Market Volume Billion Forecast, by Battery Type 2020 & 2033
- Table 91: Global Electric Vehicle Battery Materials Market Revenue Million Forecast, by Material 2020 & 2033
- Table 92: Global Electric Vehicle Battery Materials Market Volume Billion Forecast, by Material 2020 & 2033
- Table 93: Global Electric Vehicle Battery Materials Market Revenue Million Forecast, by Country 2020 & 2033
- Table 94: Global Electric Vehicle Battery Materials Market Volume Billion Forecast, by Country 2020 & 2033
- Table 95: Brazil Electric Vehicle Battery Materials Market Revenue (Million) Forecast, by Application 2020 & 2033
- Table 96: Brazil Electric Vehicle Battery Materials Market Volume (Billion) Forecast, by Application 2020 & 2033
- Table 97: Argentina Electric Vehicle Battery Materials Market Revenue (Million) Forecast, by Application 2020 & 2033
- Table 98: Argentina Electric Vehicle Battery Materials Market Volume (Billion) Forecast, by Application 2020 & 2033
- Table 99: Colombia Electric Vehicle Battery Materials Market Revenue (Million) Forecast, by Application 2020 & 2033
- Table 100: Colombia Electric Vehicle Battery Materials Market Volume (Billion) Forecast, by Application 2020 & 2033
- Table 101: Rest of South America Electric Vehicle Battery Materials Market Revenue (Million) Forecast, by Application 2020 & 2033
- Table 102: Rest of South America Electric Vehicle Battery Materials Market Volume (Billion) Forecast, by Application 2020 & 2033
Frequently Asked Questions
1. What is the projected Compound Annual Growth Rate (CAGR) of the Electric Vehicle Battery Materials Market?
The projected CAGR is approximately 13.34%.
2. Which companies are prominent players in the Electric Vehicle Battery Materials Market?
Key companies in the market include Targray Technology International Inc, BASF SE, Mitsubishi Chemical Group Corporation, UBE Corporation, Umicore, Sumitomo Chemical Co Ltd, Nichia Corporation, ENTEK International LLC, Arkema SA, Kureha Corporation*List Not Exhaustive 6 4 List of Other Prominent Companies6 5 Market Ranking Analysi.
3. What are the main segments of the Electric Vehicle Battery Materials Market?
The market segments include Battery Type, Material.
4. Can you provide details about the market size?
The market size is estimated to be USD 26.78 Million as of 2022.
5. What are some drivers contributing to market growth?
4.; The Growing Adoption of Electric Vehicles4.; Decreasing Price of Lithium-ion Batteries.
6. What are the notable trends driving market growth?
Lithium-ion Battery is Expected to Have a Major Share.
7. Are there any restraints impacting market growth?
4.; The Growing Adoption of Electric Vehicles4.; Decreasing Price of Lithium-ion Batteries.
8. Can you provide examples of recent developments in the market?
January 2024: 24M introduced a battery separator, the 24M ImpervioTM, to revolutionize battery safety in electric vehicles. This innovative technology marks a significant leap in safety for both lithium-ion and lithium-metal batteries.January 2024: Researchers at MIT developed a novel battery material poised to revolutionize electric vehicle power sources. This lithium-ion battery features an innovative organic material-based cathode, a departure from the conventional use of cobalt or nickel.
9. What pricing options are available for accessing the report?
Pricing options include single-user, multi-user, and enterprise licenses priced at USD 4750, USD 5250, and USD 8750 respectively.
10. Is the market size provided in terms of value or volume?
The market size is provided in terms of value, measured in Million and volume, measured in Billion.
11. Are there any specific market keywords associated with the report?
Yes, the market keyword associated with the report is "Electric Vehicle Battery Materials Market," which aids in identifying and referencing the specific market segment covered.
12. How do I determine which pricing option suits my needs best?
The pricing options vary based on user requirements and access needs. Individual users may opt for single-user licenses, while businesses requiring broader access may choose multi-user or enterprise licenses for cost-effective access to the report.
13. Are there any additional resources or data provided in the Electric Vehicle Battery Materials Market report?
While the report offers comprehensive insights, it's advisable to review the specific contents or supplementary materials provided to ascertain if additional resources or data are available.
14. How can I stay updated on further developments or reports in the Electric Vehicle Battery Materials Market?
To stay informed about further developments, trends, and reports in the Electric Vehicle Battery Materials Market, consider subscribing to industry newsletters, following relevant companies and organizations, or regularly checking reputable industry news sources and publications.
Methodology
Step 1 - Identification of Relevant Samples Size from Population Database


Step 2 - Approaches for Defining Global Market Size (Value, Volume* & Price*)

Note*: In applicable scenarios
Step 3 - Data Sources
Primary Research
- Web Analytics
- Survey Reports
- Research Institute
- Latest Research Reports
- Opinion Leaders
Secondary Research
- Annual Reports
- White Paper
- Latest Press Release
- Industry Association
- Paid Database
- Investor Presentations

Step 4 - Data Triangulation
Involves using different sources of information in order to increase the validity of a study
These sources are likely to be stakeholders in a program - participants, other researchers, program staff, other community members, and so on.
Then we put all data in single framework & apply various statistical tools to find out the dynamic on the market.
During the analysis stage, feedback from the stakeholder groups would be compared to determine areas of agreement as well as areas of divergence