

Key Insights
The Electrophoresis Reagents market, projected to reach $1.31 billion by 2025, is anticipated to grow at a compound annual growth rate (CAGR) of 4.5% from 2025 to 2033. This growth is propelled by the expanding pharmaceutical and biotechnology sectors, crucial for drug discovery and genetic research. Advancements in techniques like capillary electrophoresis, offering enhanced resolution and speed, further drive market adoption. Increased global research funding in academia and research institutions also stimulates demand. Key segments include gel electrophoresis, currently dominant, and rapidly growing capillary electrophoresis. Dyes and buffers hold significant shares within product segments. Geographically, North America and Europe lead, supported by robust research infrastructure. However, the Asia-Pacific region is poised for the fastest growth, fueled by rising healthcare and biotechnology investments. Market challenges include the cost of advanced systems and the need for specialized expertise.
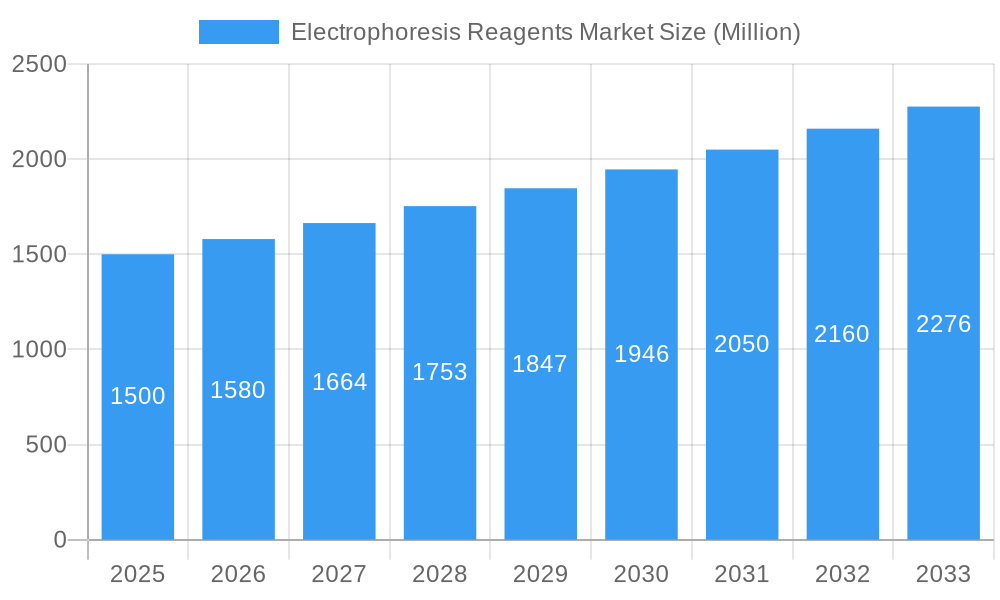
Electrophoresis Reagents Market Market Size (In Billion)
Despite challenges, the market outlook remains positive, driven by the demand for precise analytical techniques in forensics and environmental monitoring. The rising incidence of chronic diseases indirectly boosts demand for reagents used in developing diagnostics and treatments. Strategic collaborations and product diversification across applications ensure long-term market expansion. The competitive landscape features established global corporations and specialized players focused on innovation.
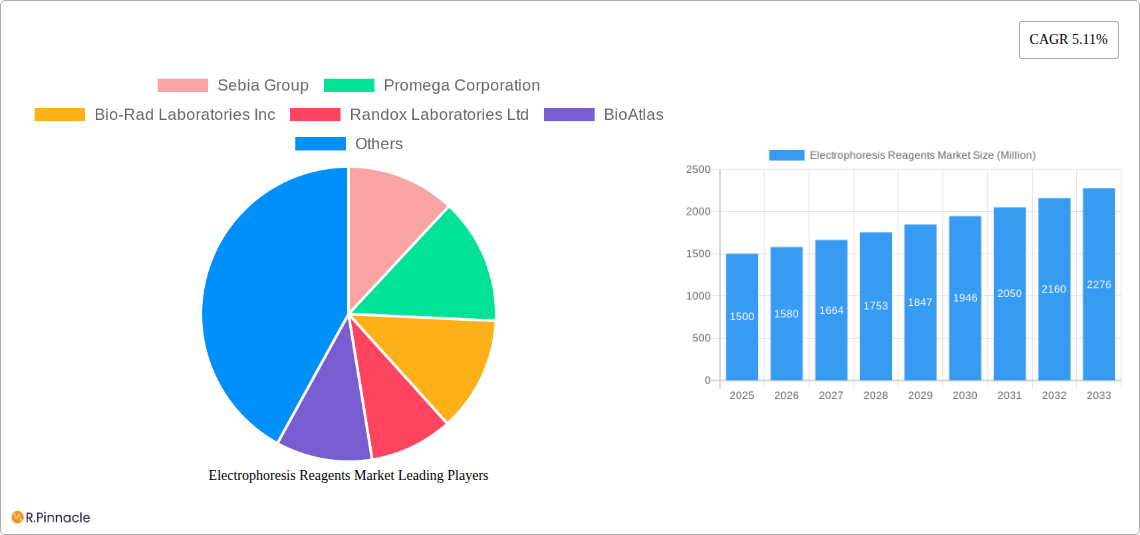
Electrophoresis Reagents Market Company Market Share
This report offers a comprehensive analysis of the Electrophoresis Reagents market, providing insights for industry professionals, investors, and researchers. Covering 2019-2033, with a base year of 2025 and a forecast period of 2025-2033, it details market structure, dynamics, key players, and future trends. The market is expected to reach $1.31 billion by 2033, with a CAGR of 4.5%.
Electrophoresis Reagents Market Market Structure & Innovation Trends
The Electrophoresis Reagents market is characterized by a moderately concentrated landscape, with key players such as Sebia Group, Promega Corporation, Bio-Rad Laboratories Inc, Randox Laboratories Ltd, BioAtlas, Lonza Group AG, Takara Bio Inc, Agilent Technologies Inc, Helena Laboratories Corporation, Qiagen NV, Merck KGaA (Sigma-Aldrich Corporation), Hoefer Inc (Harvard Bioscience Inc), and Thermo Fisher Scientific holding significant market share. Market concentration is further analyzed through Herfindahl-Hirschman Index (HHI) and market share data for each player.
Innovation in the market is driven by advancements in electrophoresis techniques (like capillary electrophoresis), the development of novel reagents with improved sensitivity and specificity, and the increasing demand for high-throughput screening technologies in research and diagnostics. Stringent regulatory frameworks, particularly regarding reagent purity and safety, influence market dynamics. Product substitutes, such as mass spectrometry-based techniques, pose a challenge but also stimulate innovation. The market exhibits a diverse end-user base, including academic and research institutions, pharmaceutical and biotechnology companies, and clinical laboratories. M&A activities, while not extremely frequent, have played a role in shaping the market structure, with deal values ranging from xx Million to xx Million in recent years. Specific examples and analyses of significant M&A transactions are included in the full report.
Electrophoresis Reagents Market Market Dynamics & Trends
The Electrophoresis Reagents market is experiencing robust growth, driven by factors such as the increasing prevalence of chronic diseases, the rising demand for faster and more accurate diagnostic tools, and the growing adoption of electrophoresis techniques in various research applications. Technological advancements, particularly in microfluidic devices and automated systems, are streamlining workflows and increasing efficiency. Consumer preference is shifting toward reagents with enhanced sensitivity, improved ease of use, and reduced environmental impact. Competitive dynamics are influenced by factors like pricing strategies, product innovation, and the expansion of distribution networks. The market penetration of capillary electrophoresis is growing steadily, driven by its advantages in speed and resolution compared to traditional gel electrophoresis. The CAGR for the market is projected to be xx% during the forecast period. Detailed analysis of each growth driver is provided in the report.
Dominant Regions & Segments in Electrophoresis Reagents Market
North America currently holds the largest market share in the Electrophoresis Reagents market, driven by factors such as substantial research funding, strong presence of major players, and high adoption rates of advanced technologies. However, Asia-Pacific is expected to witness the fastest growth during the forecast period due to rapid economic expansion, burgeoning healthcare infrastructure, and increasing research and development activities.
- Key Drivers for North America: High government funding for research, strong regulatory support, and a large number of research institutions and pharmaceutical companies.
- Key Drivers for Asia-Pacific: Increasing healthcare spending, growing research and development investment in life sciences, and a rising prevalence of chronic diseases.
Dominant Product Segments:
- Gels: High demand due to established use in various electrophoresis applications. Market size xx Million in 2025.
- Dyes: Essential components of electrophoresis, contributing significantly to market value. Market size xx Million in 2025.
- Buffers: Crucial for maintaining optimal pH and ionic strength, driving substantial demand. Market size xx Million in 2025.
- Other Products: Includes ancillary products like sample preparation kits and detection systems. Market size xx Million in 2025.
Dominant Technique Segment: Gel electrophoresis continues to dominate due to its widespread use and established protocols. Capillary electrophoresis is experiencing notable growth due to higher resolution and automation.
Dominant End-User Segment: Academic and research institutions constitute the largest end-user segment due to extensive research activities. Pharmaceutical and biotechnology companies represent a significant and rapidly growing segment.
Electrophoresis Reagents Market Product Innovations
Recent product developments focus on improving sensitivity, specificity, and throughput of electrophoresis reagents. Miniaturization and automation are key technological trends, leading to the development of microfluidic devices and integrated systems that simplify workflows and reduce analysis time. New dyes and buffers offer enhanced performance and compatibility with various electrophoresis platforms. The market is witnessing the integration of advanced detection technologies, such as fluorescence and mass spectrometry, to improve analytical capabilities. These innovations are enhancing the market fit of electrophoresis reagents in diverse applications.
Report Scope & Segmentation Analysis
This report segments the Electrophoresis Reagents market by product (Gels, Starch Gels, Dyes, Other Dyes, Buffers, Other Buffers, Other Products), technique (Gel Electrophoresis, Capillary Electrophoresis), and end-user (Academic and Research Institutions, Pharmaceutical and Biotechnology Companies, Laboratories, Other End Users). Each segment is analyzed based on market size, growth projections, and competitive dynamics. For example, the gel electrophoresis segment is expected to witness xx% growth during the forecast period driven by its established applications. Similarly, the pharmaceutical and biotechnology end-user segment exhibits robust growth due to increasing drug development activities. The report provides detailed market size and forecast data for each segment.
Key Drivers of Electrophoresis Reagents Market Growth
The Electrophoresis Reagents market is fueled by several key factors, including:
- Technological advancements: The development of novel reagents with improved performance characteristics and the integration of automation and miniaturization technologies are accelerating market growth.
- Rising prevalence of chronic diseases: Increased demand for accurate and rapid diagnostic tools is driving the adoption of electrophoresis techniques.
- Government funding and research initiatives: Significant investments in research and development in the life sciences sector are supporting the growth of the market.
Challenges in the Electrophoresis Reagents Market Sector
The Electrophoresis Reagents market faces several challenges, including:
- Stringent regulatory requirements: Compliance with strict regulatory standards can increase costs and complexity for manufacturers.
- Competitive landscape: Intense competition among existing players can lead to price pressures and reduced profit margins.
- Supply chain disruptions: Global supply chain disruptions may impact the availability and cost of raw materials. These factors are expected to impact the market growth marginally, estimated to cause a xx% reduction in growth during the forecast period.
Emerging Opportunities in Electrophoresis Reagents Market
Several emerging opportunities are shaping the future of the Electrophoresis Reagents market:
- Personalized medicine: The increasing demand for personalized diagnostics and therapeutics presents significant growth potential for electrophoresis reagents.
- Point-of-care diagnostics: Development of portable and user-friendly electrophoresis devices for point-of-care settings is creating new market opportunities.
- Expansion into emerging markets: Significant growth potential exists in developing economies with rising healthcare spending and increasing research investments.
Leading Players in the Electrophoresis Reagents Market Market
- Sebia Group
- Promega Corporation
- Bio-Rad Laboratories Inc
- Randox Laboratories Ltd
- BioAtlas
- Lonza Group AG
- Takara Bio Inc
- Agilent Technologies Inc
- Helena Laboratories Corporation
- Qiagen NV
- Merck KGaA (Sigma-Aldrich Corporation)
- Hoefer Inc (Harvard Bioscience Inc)
- Thermo Fisher Scientific
Key Developments in Electrophoresis Reagents Market Industry
- June 2022: Advanced Electrophoresis Solution Ltd. secured pre-A investment to expand its product pipeline. This signifies investor confidence in the market's growth potential.
- August 2022: Amerigo Scientific launched the CALX8 Reagent, expanding the range of available reagents for life science research and contributing to the market's innovation.
Future Outlook for Electrophoresis Reagents Market Market
The Electrophoresis Reagents market is poised for continued growth, driven by technological advancements, increasing demand for advanced diagnostic tools, and expansion into emerging markets. Strategic partnerships, acquisitions, and the development of innovative products with improved performance characteristics will further shape the market landscape. The market is expected to witness significant growth, particularly in regions with burgeoning healthcare infrastructure and research activities, leading to substantial market expansion in the coming years.
Electrophoresis Reagents Market Segmentation
-
1. Product
-
1.1. Gels
- 1.1.1. Agarose Gels
- 1.1.2. Polyacrylamide Gels
- 1.1.3. Starch Gels
-
1.2. Dyes
- 1.2.1. Ethidium Bromide (ETBR) Dyes
- 1.2.2. Bromophenol Blue
- 1.2.3. Sybr Dyes
- 1.2.4. Other Dyes
-
1.3. Buffers
- 1.3.1. Tris/Acetate/EDTA
- 1.3.2. Tris/Borate/EDTA
- 1.3.3. Other Buffers
- 1.4. Other Products
-
1.1. Gels
-
2. Technique
- 2.1. Gel Electrophoresis
- 2.2. Capillary Electrophoresis
-
3. End User
- 3.1. Academic and Research Institutions
- 3.2. Pharmaceutical and Biotechnology Companies
- 3.3. Laboratories
- 3.4. Other End Users
Electrophoresis Reagents Market Segmentation By Geography
-
1. North America
- 1.1. United States
- 1.2. Canada
- 1.3. Mexico
-
2. Europe
- 2.1. Germany
- 2.2. United Kingdom
- 2.3. France
- 2.4. Italy
- 2.5. Spain
- 2.6. Rest of Europe
-
3. Asia Pacific
- 3.1. China
- 3.2. Japan
- 3.3. India
- 3.4. Australia
- 3.5. South Korea
- 3.6. Rest of Asia Pacific
-
4. Middle East and Africa
- 4.1. GCC
- 4.2. South Africa
- 4.3. Rest of Middle East and Africa
-
5. South America
- 5.1. Brazil
- 5.2. Argentina
- 5.3. Rest of South America
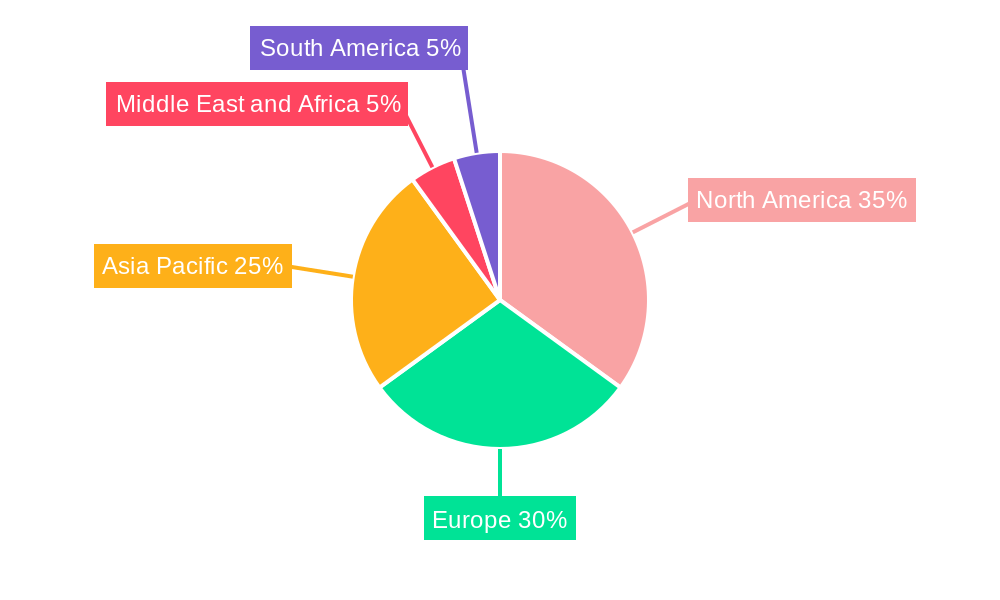
Electrophoresis Reagents Market Regional Market Share
Geographic Coverage of Electrophoresis Reagents Market
Electrophoresis Reagents Market REPORT HIGHLIGHTS
| Aspects | Details |
|---|---|
| Study Period | 2020-2034 |
| Base Year | 2025 |
| Estimated Year | 2026 |
| Forecast Period | 2026-2034 |
| Historical Period | 2020-2025 |
| Growth Rate | CAGR of 4.5% from 2020-2034 |
| Segmentation |
|
Table of Contents
- 1. Introduction
- 1.1. Research Scope
- 1.2. Market Segmentation
- 1.3. Research Objective
- 1.4. Definitions and Assumptions
- 2. Executive Summary
- 2.1. Market Snapshot
- 3. Market Dynamics
- 3.1. Market Drivers
- 3.2. Market Restrains
- 3.3. Market Trends
- 3.4. Market Opportunities
- 4. Market Factor Analysis
- 4.1. Porters Five Forces
- 4.1.1. Bargaining Power of Suppliers
- 4.1.2. Bargaining Power of Buyers
- 4.1.3. Threat of New Entrants
- 4.1.4. Threat of Substitutes
- 4.1.5. Competitive Rivalry
- 4.2. PESTEL analysis
- 4.3. BCG Analysis
- 4.3.1. Stars (High Growth, High Market Share)
- 4.3.2. Cash Cows (Low Growth, High Market Share)
- 4.3.3. Question Mark (High Growth, Low Market Share)
- 4.3.4. Dogs (Low Growth, Low Market Share)
- 4.4. Ansoff Matrix Analysis
- 4.5. Supply Chain Analysis
- 4.6. Regulatory Landscape
- 4.7. Current Market Potential and Opportunity Assessment (TAM–SAM–SOM Framework)
- 4.8. PRI Analyst Note
- 4.1. Porters Five Forces
- 5. Market Analysis, Insights and Forecast 2021-2033
- 5.1. Market Analysis, Insights and Forecast - by Product
- 5.1.1. Gels
- 5.1.1.1. Agarose Gels
- 5.1.1.2. Polyacrylamide Gels
- 5.1.1.3. Starch Gels
- 5.1.2. Dyes
- 5.1.2.1. Ethidium Bromide (ETBR) Dyes
- 5.1.2.2. Bromophenol Blue
- 5.1.2.3. Sybr Dyes
- 5.1.2.4. Other Dyes
- 5.1.3. Buffers
- 5.1.3.1. Tris/Acetate/EDTA
- 5.1.3.2. Tris/Borate/EDTA
- 5.1.3.3. Other Buffers
- 5.1.4. Other Products
- 5.1.1. Gels
- 5.2. Market Analysis, Insights and Forecast - by Technique
- 5.2.1. Gel Electrophoresis
- 5.2.2. Capillary Electrophoresis
- 5.3. Market Analysis, Insights and Forecast - by End User
- 5.3.1. Academic and Research Institutions
- 5.3.2. Pharmaceutical and Biotechnology Companies
- 5.3.3. Laboratories
- 5.3.4. Other End Users
- 5.4. Market Analysis, Insights and Forecast - by Region
- 5.4.1. North America
- 5.4.2. Europe
- 5.4.3. Asia Pacific
- 5.4.4. Middle East and Africa
- 5.4.5. South America
- 5.1. Market Analysis, Insights and Forecast - by Product
- 6. Global Electrophoresis Reagents Market Analysis, Insights and Forecast, 2021-2033
- 6.1. Market Analysis, Insights and Forecast - by Product
- 6.1.1. Gels
- 6.1.1.1. Agarose Gels
- 6.1.1.2. Polyacrylamide Gels
- 6.1.1.3. Starch Gels
- 6.1.2. Dyes
- 6.1.2.1. Ethidium Bromide (ETBR) Dyes
- 6.1.2.2. Bromophenol Blue
- 6.1.2.3. Sybr Dyes
- 6.1.2.4. Other Dyes
- 6.1.3. Buffers
- 6.1.3.1. Tris/Acetate/EDTA
- 6.1.3.2. Tris/Borate/EDTA
- 6.1.3.3. Other Buffers
- 6.1.4. Other Products
- 6.1.1. Gels
- 6.2. Market Analysis, Insights and Forecast - by Technique
- 6.2.1. Gel Electrophoresis
- 6.2.2. Capillary Electrophoresis
- 6.3. Market Analysis, Insights and Forecast - by End User
- 6.3.1. Academic and Research Institutions
- 6.3.2. Pharmaceutical and Biotechnology Companies
- 6.3.3. Laboratories
- 6.3.4. Other End Users
- 6.1. Market Analysis, Insights and Forecast - by Product
- 7. North America Electrophoresis Reagents Market Analysis, Insights and Forecast, 2020-2032
- 7.1. Market Analysis, Insights and Forecast - by Product
- 7.1.1. Gels
- 7.1.1.1. Agarose Gels
- 7.1.1.2. Polyacrylamide Gels
- 7.1.1.3. Starch Gels
- 7.1.2. Dyes
- 7.1.2.1. Ethidium Bromide (ETBR) Dyes
- 7.1.2.2. Bromophenol Blue
- 7.1.2.3. Sybr Dyes
- 7.1.2.4. Other Dyes
- 7.1.3. Buffers
- 7.1.3.1. Tris/Acetate/EDTA
- 7.1.3.2. Tris/Borate/EDTA
- 7.1.3.3. Other Buffers
- 7.1.4. Other Products
- 7.1.1. Gels
- 7.2. Market Analysis, Insights and Forecast - by Technique
- 7.2.1. Gel Electrophoresis
- 7.2.2. Capillary Electrophoresis
- 7.3. Market Analysis, Insights and Forecast - by End User
- 7.3.1. Academic and Research Institutions
- 7.3.2. Pharmaceutical and Biotechnology Companies
- 7.3.3. Laboratories
- 7.3.4. Other End Users
- 7.1. Market Analysis, Insights and Forecast - by Product
- 8. Europe Electrophoresis Reagents Market Analysis, Insights and Forecast, 2020-2032
- 8.1. Market Analysis, Insights and Forecast - by Product
- 8.1.1. Gels
- 8.1.1.1. Agarose Gels
- 8.1.1.2. Polyacrylamide Gels
- 8.1.1.3. Starch Gels
- 8.1.2. Dyes
- 8.1.2.1. Ethidium Bromide (ETBR) Dyes
- 8.1.2.2. Bromophenol Blue
- 8.1.2.3. Sybr Dyes
- 8.1.2.4. Other Dyes
- 8.1.3. Buffers
- 8.1.3.1. Tris/Acetate/EDTA
- 8.1.3.2. Tris/Borate/EDTA
- 8.1.3.3. Other Buffers
- 8.1.4. Other Products
- 8.1.1. Gels
- 8.2. Market Analysis, Insights and Forecast - by Technique
- 8.2.1. Gel Electrophoresis
- 8.2.2. Capillary Electrophoresis
- 8.3. Market Analysis, Insights and Forecast - by End User
- 8.3.1. Academic and Research Institutions
- 8.3.2. Pharmaceutical and Biotechnology Companies
- 8.3.3. Laboratories
- 8.3.4. Other End Users
- 8.1. Market Analysis, Insights and Forecast - by Product
- 9. Asia Pacific Electrophoresis Reagents Market Analysis, Insights and Forecast, 2020-2032
- 9.1. Market Analysis, Insights and Forecast - by Product
- 9.1.1. Gels
- 9.1.1.1. Agarose Gels
- 9.1.1.2. Polyacrylamide Gels
- 9.1.1.3. Starch Gels
- 9.1.2. Dyes
- 9.1.2.1. Ethidium Bromide (ETBR) Dyes
- 9.1.2.2. Bromophenol Blue
- 9.1.2.3. Sybr Dyes
- 9.1.2.4. Other Dyes
- 9.1.3. Buffers
- 9.1.3.1. Tris/Acetate/EDTA
- 9.1.3.2. Tris/Borate/EDTA
- 9.1.3.3. Other Buffers
- 9.1.4. Other Products
- 9.1.1. Gels
- 9.2. Market Analysis, Insights and Forecast - by Technique
- 9.2.1. Gel Electrophoresis
- 9.2.2. Capillary Electrophoresis
- 9.3. Market Analysis, Insights and Forecast - by End User
- 9.3.1. Academic and Research Institutions
- 9.3.2. Pharmaceutical and Biotechnology Companies
- 9.3.3. Laboratories
- 9.3.4. Other End Users
- 9.1. Market Analysis, Insights and Forecast - by Product
- 10. Middle East and Africa Electrophoresis Reagents Market Analysis, Insights and Forecast, 2020-2032
- 10.1. Market Analysis, Insights and Forecast - by Product
- 10.1.1. Gels
- 10.1.1.1. Agarose Gels
- 10.1.1.2. Polyacrylamide Gels
- 10.1.1.3. Starch Gels
- 10.1.2. Dyes
- 10.1.2.1. Ethidium Bromide (ETBR) Dyes
- 10.1.2.2. Bromophenol Blue
- 10.1.2.3. Sybr Dyes
- 10.1.2.4. Other Dyes
- 10.1.3. Buffers
- 10.1.3.1. Tris/Acetate/EDTA
- 10.1.3.2. Tris/Borate/EDTA
- 10.1.3.3. Other Buffers
- 10.1.4. Other Products
- 10.1.1. Gels
- 10.2. Market Analysis, Insights and Forecast - by Technique
- 10.2.1. Gel Electrophoresis
- 10.2.2. Capillary Electrophoresis
- 10.3. Market Analysis, Insights and Forecast - by End User
- 10.3.1. Academic and Research Institutions
- 10.3.2. Pharmaceutical and Biotechnology Companies
- 10.3.3. Laboratories
- 10.3.4. Other End Users
- 10.1. Market Analysis, Insights and Forecast - by Product
- 11. South America Electrophoresis Reagents Market Analysis, Insights and Forecast, 2020-2032
- 11.1. Market Analysis, Insights and Forecast - by Product
- 11.1.1. Gels
- 11.1.1.1. Agarose Gels
- 11.1.1.2. Polyacrylamide Gels
- 11.1.1.3. Starch Gels
- 11.1.2. Dyes
- 11.1.2.1. Ethidium Bromide (ETBR) Dyes
- 11.1.2.2. Bromophenol Blue
- 11.1.2.3. Sybr Dyes
- 11.1.2.4. Other Dyes
- 11.1.3. Buffers
- 11.1.3.1. Tris/Acetate/EDTA
- 11.1.3.2. Tris/Borate/EDTA
- 11.1.3.3. Other Buffers
- 11.1.4. Other Products
- 11.1.1. Gels
- 11.2. Market Analysis, Insights and Forecast - by Technique
- 11.2.1. Gel Electrophoresis
- 11.2.2. Capillary Electrophoresis
- 11.3. Market Analysis, Insights and Forecast - by End User
- 11.3.1. Academic and Research Institutions
- 11.3.2. Pharmaceutical and Biotechnology Companies
- 11.3.3. Laboratories
- 11.3.4. Other End Users
- 11.1. Market Analysis, Insights and Forecast - by Product
- 12. Competitive Analysis
- 12.1. Company Profiles
- 12.1.1 Sebia Group
- 12.1.1.1. Company Overview
- 12.1.1.2. Products
- 12.1.1.3. Company Financials
- 12.1.1.4. SWOT Analysis
- 12.1.2 Promega Corporation
- 12.1.2.1. Company Overview
- 12.1.2.2. Products
- 12.1.2.3. Company Financials
- 12.1.2.4. SWOT Analysis
- 12.1.3 Bio-Rad Laboratories Inc
- 12.1.3.1. Company Overview
- 12.1.3.2. Products
- 12.1.3.3. Company Financials
- 12.1.3.4. SWOT Analysis
- 12.1.4 Randox Laboratories Ltd
- 12.1.4.1. Company Overview
- 12.1.4.2. Products
- 12.1.4.3. Company Financials
- 12.1.4.4. SWOT Analysis
- 12.1.5 BioAtlas
- 12.1.5.1. Company Overview
- 12.1.5.2. Products
- 12.1.5.3. Company Financials
- 12.1.5.4. SWOT Analysis
- 12.1.6 Lonza Group AG
- 12.1.6.1. Company Overview
- 12.1.6.2. Products
- 12.1.6.3. Company Financials
- 12.1.6.4. SWOT Analysis
- 12.1.7 Takara Bio Inc
- 12.1.7.1. Company Overview
- 12.1.7.2. Products
- 12.1.7.3. Company Financials
- 12.1.7.4. SWOT Analysis
- 12.1.8 Agilent Technologies Inc
- 12.1.8.1. Company Overview
- 12.1.8.2. Products
- 12.1.8.3. Company Financials
- 12.1.8.4. SWOT Analysis
- 12.1.9 Helena Laboratories Corporation
- 12.1.9.1. Company Overview
- 12.1.9.2. Products
- 12.1.9.3. Company Financials
- 12.1.9.4. SWOT Analysis
- 12.1.10 Qiagen NV
- 12.1.10.1. Company Overview
- 12.1.10.2. Products
- 12.1.10.3. Company Financials
- 12.1.10.4. SWOT Analysis
- 12.1.11 Merck KGaA (Sigma-Aldrich Corporation)
- 12.1.11.1. Company Overview
- 12.1.11.2. Products
- 12.1.11.3. Company Financials
- 12.1.11.4. SWOT Analysis
- 12.1.12 Hoefer Inc (Harvard Bioscience Inc )
- 12.1.12.1. Company Overview
- 12.1.12.2. Products
- 12.1.12.3. Company Financials
- 12.1.12.4. SWOT Analysis
- 12.1.13 Thermo Fisher Scientific
- 12.1.13.1. Company Overview
- 12.1.13.2. Products
- 12.1.13.3. Company Financials
- 12.1.13.4. SWOT Analysis
- 12.1.1 Sebia Group
- 12.2. Market Entropy
- 12.2.1 Company's Key Areas Served
- 12.2.2 Recent Developments
- 12.3. Company Market Share Analysis 2025
- 12.3.1 Top 5 Companies Market Share Analysis
- 12.3.2 Top 3 Companies Market Share Analysis
- 12.4. List of Potential Customers
- 13. Research Methodology
List of Figures
- Figure 1: Global Electrophoresis Reagents Market Revenue Breakdown (billion, %) by Region 2025 & 2033
- Figure 2: Global Electrophoresis Reagents Market Volume Breakdown (K Unit, %) by Region 2025 & 2033
- Figure 3: North America Electrophoresis Reagents Market Revenue (billion), by Product 2025 & 2033
- Figure 4: North America Electrophoresis Reagents Market Volume (K Unit), by Product 2025 & 2033
- Figure 5: North America Electrophoresis Reagents Market Revenue Share (%), by Product 2025 & 2033
- Figure 6: North America Electrophoresis Reagents Market Volume Share (%), by Product 2025 & 2033
- Figure 7: North America Electrophoresis Reagents Market Revenue (billion), by Technique 2025 & 2033
- Figure 8: North America Electrophoresis Reagents Market Volume (K Unit), by Technique 2025 & 2033
- Figure 9: North America Electrophoresis Reagents Market Revenue Share (%), by Technique 2025 & 2033
- Figure 10: North America Electrophoresis Reagents Market Volume Share (%), by Technique 2025 & 2033
- Figure 11: North America Electrophoresis Reagents Market Revenue (billion), by End User 2025 & 2033
- Figure 12: North America Electrophoresis Reagents Market Volume (K Unit), by End User 2025 & 2033
- Figure 13: North America Electrophoresis Reagents Market Revenue Share (%), by End User 2025 & 2033
- Figure 14: North America Electrophoresis Reagents Market Volume Share (%), by End User 2025 & 2033
- Figure 15: North America Electrophoresis Reagents Market Revenue (billion), by Country 2025 & 2033
- Figure 16: North America Electrophoresis Reagents Market Volume (K Unit), by Country 2025 & 2033
- Figure 17: North America Electrophoresis Reagents Market Revenue Share (%), by Country 2025 & 2033
- Figure 18: North America Electrophoresis Reagents Market Volume Share (%), by Country 2025 & 2033
- Figure 19: Europe Electrophoresis Reagents Market Revenue (billion), by Product 2025 & 2033
- Figure 20: Europe Electrophoresis Reagents Market Volume (K Unit), by Product 2025 & 2033
- Figure 21: Europe Electrophoresis Reagents Market Revenue Share (%), by Product 2025 & 2033
- Figure 22: Europe Electrophoresis Reagents Market Volume Share (%), by Product 2025 & 2033
- Figure 23: Europe Electrophoresis Reagents Market Revenue (billion), by Technique 2025 & 2033
- Figure 24: Europe Electrophoresis Reagents Market Volume (K Unit), by Technique 2025 & 2033
- Figure 25: Europe Electrophoresis Reagents Market Revenue Share (%), by Technique 2025 & 2033
- Figure 26: Europe Electrophoresis Reagents Market Volume Share (%), by Technique 2025 & 2033
- Figure 27: Europe Electrophoresis Reagents Market Revenue (billion), by End User 2025 & 2033
- Figure 28: Europe Electrophoresis Reagents Market Volume (K Unit), by End User 2025 & 2033
- Figure 29: Europe Electrophoresis Reagents Market Revenue Share (%), by End User 2025 & 2033
- Figure 30: Europe Electrophoresis Reagents Market Volume Share (%), by End User 2025 & 2033
- Figure 31: Europe Electrophoresis Reagents Market Revenue (billion), by Country 2025 & 2033
- Figure 32: Europe Electrophoresis Reagents Market Volume (K Unit), by Country 2025 & 2033
- Figure 33: Europe Electrophoresis Reagents Market Revenue Share (%), by Country 2025 & 2033
- Figure 34: Europe Electrophoresis Reagents Market Volume Share (%), by Country 2025 & 2033
- Figure 35: Asia Pacific Electrophoresis Reagents Market Revenue (billion), by Product 2025 & 2033
- Figure 36: Asia Pacific Electrophoresis Reagents Market Volume (K Unit), by Product 2025 & 2033
- Figure 37: Asia Pacific Electrophoresis Reagents Market Revenue Share (%), by Product 2025 & 2033
- Figure 38: Asia Pacific Electrophoresis Reagents Market Volume Share (%), by Product 2025 & 2033
- Figure 39: Asia Pacific Electrophoresis Reagents Market Revenue (billion), by Technique 2025 & 2033
- Figure 40: Asia Pacific Electrophoresis Reagents Market Volume (K Unit), by Technique 2025 & 2033
- Figure 41: Asia Pacific Electrophoresis Reagents Market Revenue Share (%), by Technique 2025 & 2033
- Figure 42: Asia Pacific Electrophoresis Reagents Market Volume Share (%), by Technique 2025 & 2033
- Figure 43: Asia Pacific Electrophoresis Reagents Market Revenue (billion), by End User 2025 & 2033
- Figure 44: Asia Pacific Electrophoresis Reagents Market Volume (K Unit), by End User 2025 & 2033
- Figure 45: Asia Pacific Electrophoresis Reagents Market Revenue Share (%), by End User 2025 & 2033
- Figure 46: Asia Pacific Electrophoresis Reagents Market Volume Share (%), by End User 2025 & 2033
- Figure 47: Asia Pacific Electrophoresis Reagents Market Revenue (billion), by Country 2025 & 2033
- Figure 48: Asia Pacific Electrophoresis Reagents Market Volume (K Unit), by Country 2025 & 2033
- Figure 49: Asia Pacific Electrophoresis Reagents Market Revenue Share (%), by Country 2025 & 2033
- Figure 50: Asia Pacific Electrophoresis Reagents Market Volume Share (%), by Country 2025 & 2033
- Figure 51: Middle East and Africa Electrophoresis Reagents Market Revenue (billion), by Product 2025 & 2033
- Figure 52: Middle East and Africa Electrophoresis Reagents Market Volume (K Unit), by Product 2025 & 2033
- Figure 53: Middle East and Africa Electrophoresis Reagents Market Revenue Share (%), by Product 2025 & 2033
- Figure 54: Middle East and Africa Electrophoresis Reagents Market Volume Share (%), by Product 2025 & 2033
- Figure 55: Middle East and Africa Electrophoresis Reagents Market Revenue (billion), by Technique 2025 & 2033
- Figure 56: Middle East and Africa Electrophoresis Reagents Market Volume (K Unit), by Technique 2025 & 2033
- Figure 57: Middle East and Africa Electrophoresis Reagents Market Revenue Share (%), by Technique 2025 & 2033
- Figure 58: Middle East and Africa Electrophoresis Reagents Market Volume Share (%), by Technique 2025 & 2033
- Figure 59: Middle East and Africa Electrophoresis Reagents Market Revenue (billion), by End User 2025 & 2033
- Figure 60: Middle East and Africa Electrophoresis Reagents Market Volume (K Unit), by End User 2025 & 2033
- Figure 61: Middle East and Africa Electrophoresis Reagents Market Revenue Share (%), by End User 2025 & 2033
- Figure 62: Middle East and Africa Electrophoresis Reagents Market Volume Share (%), by End User 2025 & 2033
- Figure 63: Middle East and Africa Electrophoresis Reagents Market Revenue (billion), by Country 2025 & 2033
- Figure 64: Middle East and Africa Electrophoresis Reagents Market Volume (K Unit), by Country 2025 & 2033
- Figure 65: Middle East and Africa Electrophoresis Reagents Market Revenue Share (%), by Country 2025 & 2033
- Figure 66: Middle East and Africa Electrophoresis Reagents Market Volume Share (%), by Country 2025 & 2033
- Figure 67: South America Electrophoresis Reagents Market Revenue (billion), by Product 2025 & 2033
- Figure 68: South America Electrophoresis Reagents Market Volume (K Unit), by Product 2025 & 2033
- Figure 69: South America Electrophoresis Reagents Market Revenue Share (%), by Product 2025 & 2033
- Figure 70: South America Electrophoresis Reagents Market Volume Share (%), by Product 2025 & 2033
- Figure 71: South America Electrophoresis Reagents Market Revenue (billion), by Technique 2025 & 2033
- Figure 72: South America Electrophoresis Reagents Market Volume (K Unit), by Technique 2025 & 2033
- Figure 73: South America Electrophoresis Reagents Market Revenue Share (%), by Technique 2025 & 2033
- Figure 74: South America Electrophoresis Reagents Market Volume Share (%), by Technique 2025 & 2033
- Figure 75: South America Electrophoresis Reagents Market Revenue (billion), by End User 2025 & 2033
- Figure 76: South America Electrophoresis Reagents Market Volume (K Unit), by End User 2025 & 2033
- Figure 77: South America Electrophoresis Reagents Market Revenue Share (%), by End User 2025 & 2033
- Figure 78: South America Electrophoresis Reagents Market Volume Share (%), by End User 2025 & 2033
- Figure 79: South America Electrophoresis Reagents Market Revenue (billion), by Country 2025 & 2033
- Figure 80: South America Electrophoresis Reagents Market Volume (K Unit), by Country 2025 & 2033
- Figure 81: South America Electrophoresis Reagents Market Revenue Share (%), by Country 2025 & 2033
- Figure 82: South America Electrophoresis Reagents Market Volume Share (%), by Country 2025 & 2033
List of Tables
- Table 1: Global Electrophoresis Reagents Market Revenue billion Forecast, by Product 2020 & 2033
- Table 2: Global Electrophoresis Reagents Market Volume K Unit Forecast, by Product 2020 & 2033
- Table 3: Global Electrophoresis Reagents Market Revenue billion Forecast, by Technique 2020 & 2033
- Table 4: Global Electrophoresis Reagents Market Volume K Unit Forecast, by Technique 2020 & 2033
- Table 5: Global Electrophoresis Reagents Market Revenue billion Forecast, by End User 2020 & 2033
- Table 6: Global Electrophoresis Reagents Market Volume K Unit Forecast, by End User 2020 & 2033
- Table 7: Global Electrophoresis Reagents Market Revenue billion Forecast, by Region 2020 & 2033
- Table 8: Global Electrophoresis Reagents Market Volume K Unit Forecast, by Region 2020 & 2033
- Table 9: Global Electrophoresis Reagents Market Revenue billion Forecast, by Product 2020 & 2033
- Table 10: Global Electrophoresis Reagents Market Volume K Unit Forecast, by Product 2020 & 2033
- Table 11: Global Electrophoresis Reagents Market Revenue billion Forecast, by Technique 2020 & 2033
- Table 12: Global Electrophoresis Reagents Market Volume K Unit Forecast, by Technique 2020 & 2033
- Table 13: Global Electrophoresis Reagents Market Revenue billion Forecast, by End User 2020 & 2033
- Table 14: Global Electrophoresis Reagents Market Volume K Unit Forecast, by End User 2020 & 2033
- Table 15: Global Electrophoresis Reagents Market Revenue billion Forecast, by Country 2020 & 2033
- Table 16: Global Electrophoresis Reagents Market Volume K Unit Forecast, by Country 2020 & 2033
- Table 17: United States Electrophoresis Reagents Market Revenue (billion) Forecast, by Application 2020 & 2033
- Table 18: United States Electrophoresis Reagents Market Volume (K Unit) Forecast, by Application 2020 & 2033
- Table 19: Canada Electrophoresis Reagents Market Revenue (billion) Forecast, by Application 2020 & 2033
- Table 20: Canada Electrophoresis Reagents Market Volume (K Unit) Forecast, by Application 2020 & 2033
- Table 21: Mexico Electrophoresis Reagents Market Revenue (billion) Forecast, by Application 2020 & 2033
- Table 22: Mexico Electrophoresis Reagents Market Volume (K Unit) Forecast, by Application 2020 & 2033
- Table 23: Global Electrophoresis Reagents Market Revenue billion Forecast, by Product 2020 & 2033
- Table 24: Global Electrophoresis Reagents Market Volume K Unit Forecast, by Product 2020 & 2033
- Table 25: Global Electrophoresis Reagents Market Revenue billion Forecast, by Technique 2020 & 2033
- Table 26: Global Electrophoresis Reagents Market Volume K Unit Forecast, by Technique 2020 & 2033
- Table 27: Global Electrophoresis Reagents Market Revenue billion Forecast, by End User 2020 & 2033
- Table 28: Global Electrophoresis Reagents Market Volume K Unit Forecast, by End User 2020 & 2033
- Table 29: Global Electrophoresis Reagents Market Revenue billion Forecast, by Country 2020 & 2033
- Table 30: Global Electrophoresis Reagents Market Volume K Unit Forecast, by Country 2020 & 2033
- Table 31: Germany Electrophoresis Reagents Market Revenue (billion) Forecast, by Application 2020 & 2033
- Table 32: Germany Electrophoresis Reagents Market Volume (K Unit) Forecast, by Application 2020 & 2033
- Table 33: United Kingdom Electrophoresis Reagents Market Revenue (billion) Forecast, by Application 2020 & 2033
- Table 34: United Kingdom Electrophoresis Reagents Market Volume (K Unit) Forecast, by Application 2020 & 2033
- Table 35: France Electrophoresis Reagents Market Revenue (billion) Forecast, by Application 2020 & 2033
- Table 36: France Electrophoresis Reagents Market Volume (K Unit) Forecast, by Application 2020 & 2033
- Table 37: Italy Electrophoresis Reagents Market Revenue (billion) Forecast, by Application 2020 & 2033
- Table 38: Italy Electrophoresis Reagents Market Volume (K Unit) Forecast, by Application 2020 & 2033
- Table 39: Spain Electrophoresis Reagents Market Revenue (billion) Forecast, by Application 2020 & 2033
- Table 40: Spain Electrophoresis Reagents Market Volume (K Unit) Forecast, by Application 2020 & 2033
- Table 41: Rest of Europe Electrophoresis Reagents Market Revenue (billion) Forecast, by Application 2020 & 2033
- Table 42: Rest of Europe Electrophoresis Reagents Market Volume (K Unit) Forecast, by Application 2020 & 2033
- Table 43: Global Electrophoresis Reagents Market Revenue billion Forecast, by Product 2020 & 2033
- Table 44: Global Electrophoresis Reagents Market Volume K Unit Forecast, by Product 2020 & 2033
- Table 45: Global Electrophoresis Reagents Market Revenue billion Forecast, by Technique 2020 & 2033
- Table 46: Global Electrophoresis Reagents Market Volume K Unit Forecast, by Technique 2020 & 2033
- Table 47: Global Electrophoresis Reagents Market Revenue billion Forecast, by End User 2020 & 2033
- Table 48: Global Electrophoresis Reagents Market Volume K Unit Forecast, by End User 2020 & 2033
- Table 49: Global Electrophoresis Reagents Market Revenue billion Forecast, by Country 2020 & 2033
- Table 50: Global Electrophoresis Reagents Market Volume K Unit Forecast, by Country 2020 & 2033
- Table 51: China Electrophoresis Reagents Market Revenue (billion) Forecast, by Application 2020 & 2033
- Table 52: China Electrophoresis Reagents Market Volume (K Unit) Forecast, by Application 2020 & 2033
- Table 53: Japan Electrophoresis Reagents Market Revenue (billion) Forecast, by Application 2020 & 2033
- Table 54: Japan Electrophoresis Reagents Market Volume (K Unit) Forecast, by Application 2020 & 2033
- Table 55: India Electrophoresis Reagents Market Revenue (billion) Forecast, by Application 2020 & 2033
- Table 56: India Electrophoresis Reagents Market Volume (K Unit) Forecast, by Application 2020 & 2033
- Table 57: Australia Electrophoresis Reagents Market Revenue (billion) Forecast, by Application 2020 & 2033
- Table 58: Australia Electrophoresis Reagents Market Volume (K Unit) Forecast, by Application 2020 & 2033
- Table 59: South Korea Electrophoresis Reagents Market Revenue (billion) Forecast, by Application 2020 & 2033
- Table 60: South Korea Electrophoresis Reagents Market Volume (K Unit) Forecast, by Application 2020 & 2033
- Table 61: Rest of Asia Pacific Electrophoresis Reagents Market Revenue (billion) Forecast, by Application 2020 & 2033
- Table 62: Rest of Asia Pacific Electrophoresis Reagents Market Volume (K Unit) Forecast, by Application 2020 & 2033
- Table 63: Global Electrophoresis Reagents Market Revenue billion Forecast, by Product 2020 & 2033
- Table 64: Global Electrophoresis Reagents Market Volume K Unit Forecast, by Product 2020 & 2033
- Table 65: Global Electrophoresis Reagents Market Revenue billion Forecast, by Technique 2020 & 2033
- Table 66: Global Electrophoresis Reagents Market Volume K Unit Forecast, by Technique 2020 & 2033
- Table 67: Global Electrophoresis Reagents Market Revenue billion Forecast, by End User 2020 & 2033
- Table 68: Global Electrophoresis Reagents Market Volume K Unit Forecast, by End User 2020 & 2033
- Table 69: Global Electrophoresis Reagents Market Revenue billion Forecast, by Country 2020 & 2033
- Table 70: Global Electrophoresis Reagents Market Volume K Unit Forecast, by Country 2020 & 2033
- Table 71: GCC Electrophoresis Reagents Market Revenue (billion) Forecast, by Application 2020 & 2033
- Table 72: GCC Electrophoresis Reagents Market Volume (K Unit) Forecast, by Application 2020 & 2033
- Table 73: South Africa Electrophoresis Reagents Market Revenue (billion) Forecast, by Application 2020 & 2033
- Table 74: South Africa Electrophoresis Reagents Market Volume (K Unit) Forecast, by Application 2020 & 2033
- Table 75: Rest of Middle East and Africa Electrophoresis Reagents Market Revenue (billion) Forecast, by Application 2020 & 2033
- Table 76: Rest of Middle East and Africa Electrophoresis Reagents Market Volume (K Unit) Forecast, by Application 2020 & 2033
- Table 77: Global Electrophoresis Reagents Market Revenue billion Forecast, by Product 2020 & 2033
- Table 78: Global Electrophoresis Reagents Market Volume K Unit Forecast, by Product 2020 & 2033
- Table 79: Global Electrophoresis Reagents Market Revenue billion Forecast, by Technique 2020 & 2033
- Table 80: Global Electrophoresis Reagents Market Volume K Unit Forecast, by Technique 2020 & 2033
- Table 81: Global Electrophoresis Reagents Market Revenue billion Forecast, by End User 2020 & 2033
- Table 82: Global Electrophoresis Reagents Market Volume K Unit Forecast, by End User 2020 & 2033
- Table 83: Global Electrophoresis Reagents Market Revenue billion Forecast, by Country 2020 & 2033
- Table 84: Global Electrophoresis Reagents Market Volume K Unit Forecast, by Country 2020 & 2033
- Table 85: Brazil Electrophoresis Reagents Market Revenue (billion) Forecast, by Application 2020 & 2033
- Table 86: Brazil Electrophoresis Reagents Market Volume (K Unit) Forecast, by Application 2020 & 2033
- Table 87: Argentina Electrophoresis Reagents Market Revenue (billion) Forecast, by Application 2020 & 2033
- Table 88: Argentina Electrophoresis Reagents Market Volume (K Unit) Forecast, by Application 2020 & 2033
- Table 89: Rest of South America Electrophoresis Reagents Market Revenue (billion) Forecast, by Application 2020 & 2033
- Table 90: Rest of South America Electrophoresis Reagents Market Volume (K Unit) Forecast, by Application 2020 & 2033
Frequently Asked Questions
1. What is the projected Compound Annual Growth Rate (CAGR) of the Electrophoresis Reagents Market?
The projected CAGR is approximately 4.5%.
2. Which companies are prominent players in the Electrophoresis Reagents Market?
Key companies in the market include Sebia Group, Promega Corporation, Bio-Rad Laboratories Inc, Randox Laboratories Ltd, BioAtlas, Lonza Group AG, Takara Bio Inc, Agilent Technologies Inc, Helena Laboratories Corporation, Qiagen NV, Merck KGaA (Sigma-Aldrich Corporation), Hoefer Inc (Harvard Bioscience Inc ), Thermo Fisher Scientific.
3. What are the main segments of the Electrophoresis Reagents Market?
The market segments include Product, Technique, End User.
4. Can you provide details about the market size?
The market size is estimated to be USD 1.31 billion as of 2022.
5. What are some drivers contributing to market growth?
Increasing Funding for Genomic and Proteomic Research; Rising Prevalence of Chronic Diseases; Technological Developments.
6. What are the notable trends driving market growth?
Gel Electrophoresis Segment is Expected to Hold a Major Market Share Over the Forecast Period.
7. Are there any restraints impacting market growth?
Time-consuming Operations; Presence of Alternative Technologies.
8. Can you provide examples of recent developments in the market?
August 2022: Amerigo Scientific, a distributor focused on supplying products and services to the biomedical and life science communities, announced the release of their new CALX8 Reagent for life science laboratory scientists. This reagent is extensively used in molecular biology research, such as cell lysis, protein purification, electrophoresis, and immunoassays.
9. What pricing options are available for accessing the report?
Pricing options include single-user, multi-user, and enterprise licenses priced at USD 4750, USD 5250, and USD 8750 respectively.
10. Is the market size provided in terms of value or volume?
The market size is provided in terms of value, measured in billion and volume, measured in K Unit.
11. Are there any specific market keywords associated with the report?
Yes, the market keyword associated with the report is "Electrophoresis Reagents Market," which aids in identifying and referencing the specific market segment covered.
12. How do I determine which pricing option suits my needs best?
The pricing options vary based on user requirements and access needs. Individual users may opt for single-user licenses, while businesses requiring broader access may choose multi-user or enterprise licenses for cost-effective access to the report.
13. Are there any additional resources or data provided in the Electrophoresis Reagents Market report?
While the report offers comprehensive insights, it's advisable to review the specific contents or supplementary materials provided to ascertain if additional resources or data are available.
14. How can I stay updated on further developments or reports in the Electrophoresis Reagents Market?
To stay informed about further developments, trends, and reports in the Electrophoresis Reagents Market, consider subscribing to industry newsletters, following relevant companies and organizations, or regularly checking reputable industry news sources and publications.
Methodology
Step 1 - Identification of Relevant Samples Size from Population Database


Step 2 - Approaches for Defining Global Market Size (Value, Volume* & Price*)

Note*: In applicable scenarios
Step 3 - Data Sources
Primary Research
- Web Analytics
- Survey Reports
- Research Institute
- Latest Research Reports
- Opinion Leaders
Secondary Research
- Annual Reports
- White Paper
- Latest Press Release
- Industry Association
- Paid Database
- Investor Presentations

Step 4 - Data Triangulation
Involves using different sources of information in order to increase the validity of a study
These sources are likely to be stakeholders in a program - participants, other researchers, program staff, other community members, and so on.
Then we put all data in single framework & apply various statistical tools to find out the dynamic on the market.
During the analysis stage, feedback from the stakeholder groups would be compared to determine areas of agreement as well as areas of divergence