
Key Insights
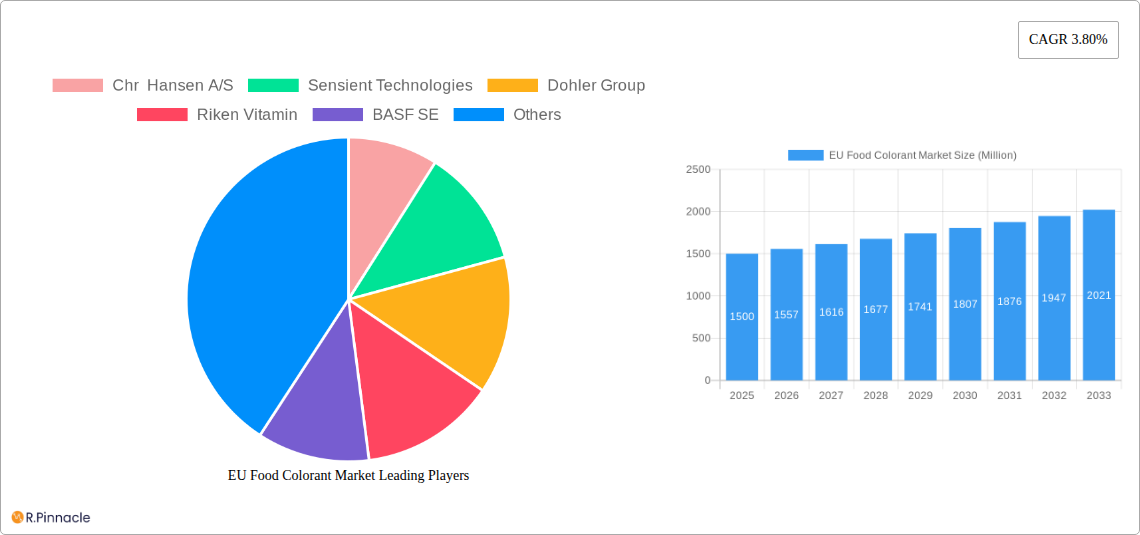
The EU food colorant market, exhibiting a Compound Annual Growth Rate (CAGR) of 3.80%, presents a compelling investment opportunity. Driven by increasing consumer demand for visually appealing food products and the expanding processed food industry, the market is projected to experience significant growth over the forecast period (2025-2033). The preference for natural colorants is a prominent trend, fueled by growing health consciousness and the perception of natural ingredients as healthier and safer. This shift towards natural alternatives is impacting the market segmentation, with natural colorants projected to capture a larger market share compared to synthetic options in the coming years. Key application areas include beverages, confectionery, and dairy & frozen products, reflecting the widespread use of food colorants across diverse food categories. While regulations surrounding food additives and potential health concerns pose certain restraints, the market's growth trajectory is expected to remain positive, largely driven by innovation in natural colorant technologies and the increasing sophistication of food processing techniques. The dominance of major players like Chr. Hansen, Sensient Technologies, and Givaudan, reflects the consolidated nature of the market, although smaller, specialized producers catering to niche demands continue to contribute to market dynamism.
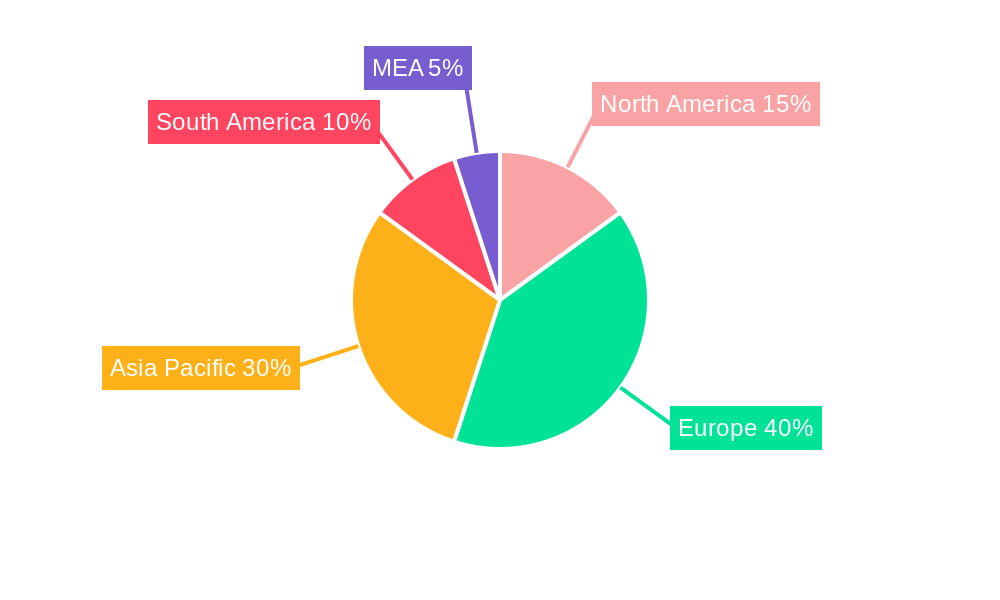
The European region holds a significant share of the global market, with countries like Germany, the United Kingdom, and France representing major consumption hubs. Continued growth is anticipated across the EU, bolstered by robust economic conditions, rising disposable incomes, and a consistently high demand for convenient and aesthetically pleasing food products. However, regional variations exist, with specific growth rates influenced by individual country-specific regulations, consumer preferences, and market dynamics. Ongoing research and development efforts focused on creating sustainable and cost-effective colorants are poised to further propel market expansion. Competition among existing players and the emergence of new entrants with innovative product offerings will continue shaping the market landscape, creating opportunities for both consolidation and diversification within the industry. The long-term outlook remains positive, projecting steady expansion driven by consumer preferences, technological advancements, and sustained growth in the overall food and beverage sector.
EU Food Colorant Market Report: 2019-2033
This comprehensive report provides an in-depth analysis of the European Union (EU) food colorant market, offering invaluable insights for industry professionals, investors, and stakeholders. The study covers the period 2019-2033, with a focus on the 2025-2033 forecast period. We analyze market dynamics, competition, and future trends to deliver actionable intelligence for strategic decision-making. The report values are expressed in Millions.
EU Food Colorant Market Structure & Innovation Trends
This section analyzes the EU food colorant market's competitive landscape, innovative advancements, regulatory environment, and market dynamics. We examine market concentration, highlighting the leading players such as Chr. Hansen A/S, Sensient Technologies, Dohler Group, Riken Vitamin, BASF SE, Koninklijke DSM N.V., D&D Williamson & Co, and Givaudan (Naturex), and their respective market shares. The report also explores the impact of mergers and acquisitions (M&A) activities, providing an analysis of deal values and their influence on market consolidation. Innovation drivers, such as consumer demand for natural colors and stricter regulations, are discussed. Regulatory frameworks, including EU food safety regulations, are also analyzed alongside the impact of product substitutes and evolving end-user demographics. The estimated market size for 2025 is xx Million and we explore how these factors interplay to shape the overall market structure.
EU Food Colorant Market Dynamics & Trends
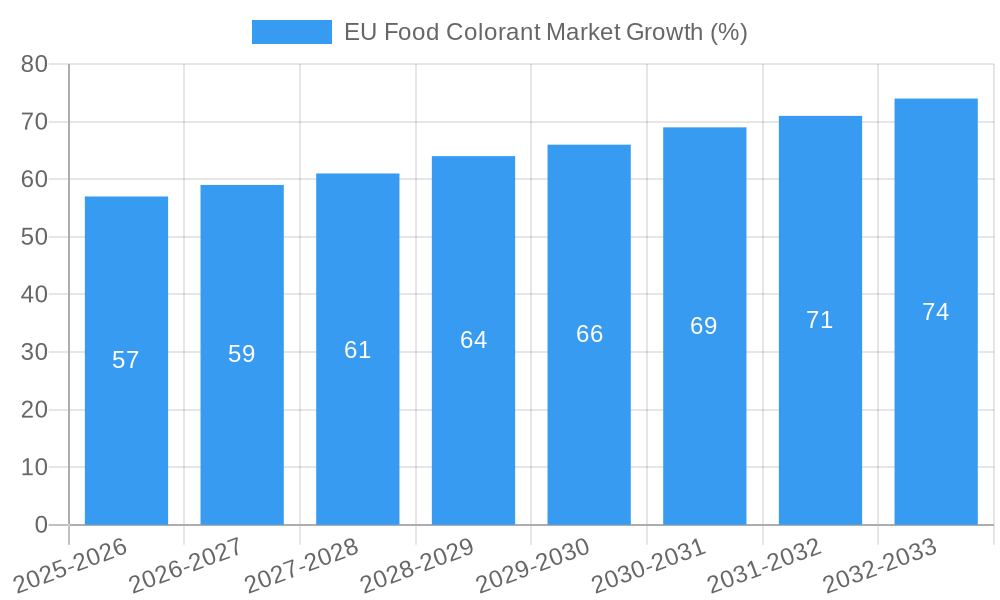
This section delves into the key drivers and trends shaping the EU food colorant market. We project a Compound Annual Growth Rate (CAGR) of xx% during the forecast period (2025-2033), driven by factors such as increasing consumer demand for convenience foods, growing health consciousness leading to a preference for natural food colorants, and technological advancements in colorant production. The report examines the impact of technological disruptions, including the introduction of new extraction and synthesis techniques, on market penetration rates. Furthermore, the changing consumer preferences, the rise of veganism and vegetarianism, the competitive dynamics among key players and their strategies are analyzed to provide a comprehensive understanding of market dynamics. The market penetration of natural colorants is expected to reach xx% by 2033.
Dominant Regions & Segments in EU Food Colorant Market
This section identifies the leading regions and segments within the EU food colorant market. We analyze dominance through a combination of factors.
By Product Type:
- Natural Color: Germany and France are projected to be the leading markets for natural food colorants, driven by strong consumer demand for natural and organic products. This segment is expected to exhibit a xx% CAGR. Key drivers include increased consumer awareness of health and wellness.
- Synthetic Color: The UK and Italy are key markets for synthetic food colorants, driven by cost-effectiveness and established usage in traditional food products. This segment is expected to experience growth with a xx% CAGR.
By Application:
- Beverage: The beverage segment is expected to dominate, driven by high demand for aesthetically pleasing drinks. Factors such as strong economic growth and a thriving food and beverage industry play a vital role.
- Dairy & Frozen Products: This segment's growth is linked to the increasing consumption of dairy and frozen desserts, further enhanced by innovation in product offerings.
- Bakery: The bakery segment displays significant growth potential due to changing dietary preferences and increasing demand for convenience foods.
- Meat, Poultry & Seafood: The demand for aesthetically pleasing meat products drives the growth in this segment.
- Confectionery: The confectionery sector thrives on appealing visual aspects, leading to significant colorant demand.
- Others: This segment's growth is attributed to rising demand for colored food products in diverse sectors like pharmaceuticals and cosmetics.
EU Food Colorant Market Product Innovations
Recent product developments in the EU food colorant market focus on natural, sustainable, and clean-label options. Companies are investing in innovative extraction methods for natural colorants, and developing new synthetic colors with improved stability and safety profiles. These innovations are aimed at catering to the growing consumer demand for healthier and more sustainable food products, aligning with the market's growing preference for clean-label ingredients.
Report Scope & Segmentation Analysis
This report segments the EU food colorant market by product type (natural and synthetic colors) and application (beverage, dairy & frozen products, bakery, meat, poultry & seafood, confectionery, and others). Each segment's market size, growth projections, and competitive dynamics are analyzed in detail. The market size for natural colors is projected to reach xx Million by 2033, while the synthetic colors market is expected to be xx Million.
Key Drivers of EU Food Colorant Market Growth
The EU food colorant market is experiencing significant growth due to factors such as rising consumer demand for processed foods, increasing use of food colorants in the food & beverage sector, and a strong focus on product aesthetics and visual appeal. Furthermore, growing health consciousness is driving demand for natural food colorants, thereby creating new market opportunities for manufacturers.
Challenges in the EU Food Colorant Market Sector
The EU food colorant market faces challenges such as stringent regulatory frameworks (EU food safety regulations), increasing health concerns related to certain synthetic food colorants, fluctuating raw material prices, and intense competition among key players. These factors may impact market growth, requiring constant adaptation by manufacturers to meet changing consumer demands and comply with regulations.
Emerging Opportunities in EU Food Colorant Market
Emerging opportunities in the EU food colorant market include the growing demand for natural and organic colorants, innovation in product development, and exploration of new applications in areas such as nutraceuticals. The potential for expansion into new markets and the rise of plant-based food products create further opportunities for growth and innovation.
Leading Players in the EU Food Colorant Market Market
- Chr. Hansen A/S
- Sensient Technologies
- Dohler Group
- Riken Vitamin
- BASF SE
- Koninklijke DSM N.V.
- D&D Williamson & Co
- Givaudan (Naturex)
- List Not Exhaustive
Key Developments in EU Food Colorant Market Industry
- 2022 Q4: Sensient Technologies launched a new range of natural food colorants derived from fruits and vegetables.
- 2023 Q1: BASF SE announced a significant investment in expanding its production capacity for natural food colorants.
- 2023 Q2: Chr. Hansen A/S acquired a smaller competitor, strengthening its market position.
- Further developments will be detailed in the full report.
Future Outlook for EU Food Colorant Market Market
The future of the EU food colorant market appears promising, driven by continued growth in the food and beverage industry, evolving consumer preferences, and ongoing innovation in colorant technology. The market is poised for expansion, presenting substantial opportunities for businesses to capitalize on emerging trends and consumer demand for natural, sustainable, and healthier food colorants. The focus on clean-label products and sustainable sourcing will continue to shape market trends in the coming years.
EU Food Colorant Market Segmentation
-
1. Product Type
- 1.1. Natural Color
- 1.2. Synthetic Color
-
2. Application
- 2.1. Beverage
- 2.2. Dairy & Frozen Product
- 2.3. Bakery
- 2.4. Meat, Poultry & Seafood
- 2.5. Confectionery
- 2.6. Others
EU Food Colorant Market Segmentation By Geography
- 1. Spain
- 2. United Kingdom
- 3. Germany
- 4. France
- 5. Italy
- 6. Russia
- 7. Rest of Europe
EU Food Colorant Market REPORT HIGHLIGHTS
| Aspects | Details |
|---|---|
| Study Period | 2019-2033 |
| Base Year | 2024 |
| Estimated Year | 2025 |
| Forecast Period | 2025-2033 |
| Historical Period | 2019-2024 |
| Growth Rate | CAGR of 3.80% from 2019-2033 |
| Segmentation |
|
Table of Contents
- 1. Introduction
- 1.1. Research Scope
- 1.2. Market Segmentation
- 1.3. Research Methodology
- 1.4. Definitions and Assumptions
- 2. Executive Summary
- 2.1. Introduction
- 3. Market Dynamics
- 3.1. Introduction
- 3.2. Market Drivers
- 3.2.1. The Rising Awareness of the Health Benefits Associated with Collagen Consumption; Rising Sport and Fitness Trends Drives the Market Growth
- 3.3. Market Restrains
- 3.3.1. Concerns over the Source and Animal Welfare in Collagen Extraction Limit the Market Growth
- 3.4. Market Trends
- 3.4.1. United Kingdom Held the Largest Market Share
- 4. Market Factor Analysis
- 4.1. Porters Five Forces
- 4.2. Supply/Value Chain
- 4.3. PESTEL analysis
- 4.4. Market Entropy
- 4.5. Patent/Trademark Analysis
- 5. Global EU Food Colorant Market Analysis, Insights and Forecast, 2019-2031
- 5.1. Market Analysis, Insights and Forecast - by Product Type
- 5.1.1. Natural Color
- 5.1.2. Synthetic Color
- 5.2. Market Analysis, Insights and Forecast - by Application
- 5.2.1. Beverage
- 5.2.2. Dairy & Frozen Product
- 5.2.3. Bakery
- 5.2.4. Meat, Poultry & Seafood
- 5.2.5. Confectionery
- 5.2.6. Others
- 5.3. Market Analysis, Insights and Forecast - by Region
- 5.3.1. Spain
- 5.3.2. United Kingdom
- 5.3.3. Germany
- 5.3.4. France
- 5.3.5. Italy
- 5.3.6. Russia
- 5.3.7. Rest of Europe
- 5.1. Market Analysis, Insights and Forecast - by Product Type
- 6. Spain EU Food Colorant Market Analysis, Insights and Forecast, 2019-2031
- 6.1. Market Analysis, Insights and Forecast - by Product Type
- 6.1.1. Natural Color
- 6.1.2. Synthetic Color
- 6.2. Market Analysis, Insights and Forecast - by Application
- 6.2.1. Beverage
- 6.2.2. Dairy & Frozen Product
- 6.2.3. Bakery
- 6.2.4. Meat, Poultry & Seafood
- 6.2.5. Confectionery
- 6.2.6. Others
- 6.1. Market Analysis, Insights and Forecast - by Product Type
- 7. United Kingdom EU Food Colorant Market Analysis, Insights and Forecast, 2019-2031
- 7.1. Market Analysis, Insights and Forecast - by Product Type
- 7.1.1. Natural Color
- 7.1.2. Synthetic Color
- 7.2. Market Analysis, Insights and Forecast - by Application
- 7.2.1. Beverage
- 7.2.2. Dairy & Frozen Product
- 7.2.3. Bakery
- 7.2.4. Meat, Poultry & Seafood
- 7.2.5. Confectionery
- 7.2.6. Others
- 7.1. Market Analysis, Insights and Forecast - by Product Type
- 8. Germany EU Food Colorant Market Analysis, Insights and Forecast, 2019-2031
- 8.1. Market Analysis, Insights and Forecast - by Product Type
- 8.1.1. Natural Color
- 8.1.2. Synthetic Color
- 8.2. Market Analysis, Insights and Forecast - by Application
- 8.2.1. Beverage
- 8.2.2. Dairy & Frozen Product
- 8.2.3. Bakery
- 8.2.4. Meat, Poultry & Seafood
- 8.2.5. Confectionery
- 8.2.6. Others
- 8.1. Market Analysis, Insights and Forecast - by Product Type
- 9. France EU Food Colorant Market Analysis, Insights and Forecast, 2019-2031
- 9.1. Market Analysis, Insights and Forecast - by Product Type
- 9.1.1. Natural Color
- 9.1.2. Synthetic Color
- 9.2. Market Analysis, Insights and Forecast - by Application
- 9.2.1. Beverage
- 9.2.2. Dairy & Frozen Product
- 9.2.3. Bakery
- 9.2.4. Meat, Poultry & Seafood
- 9.2.5. Confectionery
- 9.2.6. Others
- 9.1. Market Analysis, Insights and Forecast - by Product Type
- 10. Italy EU Food Colorant Market Analysis, Insights and Forecast, 2019-2031
- 10.1. Market Analysis, Insights and Forecast - by Product Type
- 10.1.1. Natural Color
- 10.1.2. Synthetic Color
- 10.2. Market Analysis, Insights and Forecast - by Application
- 10.2.1. Beverage
- 10.2.2. Dairy & Frozen Product
- 10.2.3. Bakery
- 10.2.4. Meat, Poultry & Seafood
- 10.2.5. Confectionery
- 10.2.6. Others
- 10.1. Market Analysis, Insights and Forecast - by Product Type
- 11. Russia EU Food Colorant Market Analysis, Insights and Forecast, 2019-2031
- 11.1. Market Analysis, Insights and Forecast - by Product Type
- 11.1.1. Natural Color
- 11.1.2. Synthetic Color
- 11.2. Market Analysis, Insights and Forecast - by Application
- 11.2.1. Beverage
- 11.2.2. Dairy & Frozen Product
- 11.2.3. Bakery
- 11.2.4. Meat, Poultry & Seafood
- 11.2.5. Confectionery
- 11.2.6. Others
- 11.1. Market Analysis, Insights and Forecast - by Product Type
- 12. Rest of Europe EU Food Colorant Market Analysis, Insights and Forecast, 2019-2031
- 12.1. Market Analysis, Insights and Forecast - by Product Type
- 12.1.1. Natural Color
- 12.1.2. Synthetic Color
- 12.2. Market Analysis, Insights and Forecast - by Application
- 12.2.1. Beverage
- 12.2.2. Dairy & Frozen Product
- 12.2.3. Bakery
- 12.2.4. Meat, Poultry & Seafood
- 12.2.5. Confectionery
- 12.2.6. Others
- 12.1. Market Analysis, Insights and Forecast - by Product Type
- 13. North America EU Food Colorant Market Analysis, Insights and Forecast, 2019-2031
- 13.1. Market Analysis, Insights and Forecast - By Country/Sub-region
- 13.1.1 United States
- 13.1.2 Canada
- 13.1.3 Mexico
- 14. Europe EU Food Colorant Market Analysis, Insights and Forecast, 2019-2031
- 14.1. Market Analysis, Insights and Forecast - By Country/Sub-region
- 14.1.1 Germany
- 14.1.2 United Kingdom
- 14.1.3 France
- 14.1.4 Spain
- 14.1.5 Italy
- 14.1.6 Spain
- 14.1.7 Belgium
- 14.1.8 Netherland
- 14.1.9 Nordics
- 14.1.10 Rest of Europe
- 15. Asia Pacific EU Food Colorant Market Analysis, Insights and Forecast, 2019-2031
- 15.1. Market Analysis, Insights and Forecast - By Country/Sub-region
- 15.1.1 China
- 15.1.2 Japan
- 15.1.3 India
- 15.1.4 South Korea
- 15.1.5 Southeast Asia
- 15.1.6 Australia
- 15.1.7 Indonesia
- 15.1.8 Phillipes
- 15.1.9 Singapore
- 15.1.10 Thailandc
- 15.1.11 Rest of Asia Pacific
- 16. South America EU Food Colorant Market Analysis, Insights and Forecast, 2019-2031
- 16.1. Market Analysis, Insights and Forecast - By Country/Sub-region
- 16.1.1 Brazil
- 16.1.2 Argentina
- 16.1.3 Peru
- 16.1.4 Chile
- 16.1.5 Colombia
- 16.1.6 Ecuador
- 16.1.7 Venezuela
- 16.1.8 Rest of South America
- 17. North America EU Food Colorant Market Analysis, Insights and Forecast, 2019-2031
- 17.1. Market Analysis, Insights and Forecast - By Country/Sub-region
- 17.1.1 United States
- 17.1.2 Canada
- 17.1.3 Mexico
- 18. MEA EU Food Colorant Market Analysis, Insights and Forecast, 2019-2031
- 18.1. Market Analysis, Insights and Forecast - By Country/Sub-region
- 18.1.1 United Arab Emirates
- 18.1.2 Saudi Arabia
- 18.1.3 South Africa
- 18.1.4 Rest of Middle East and Africa
- 19. Competitive Analysis
- 19.1. Global Market Share Analysis 2024
- 19.2. Company Profiles
- 19.2.1 Chr Hansen A/S
- 19.2.1.1. Overview
- 19.2.1.2. Products
- 19.2.1.3. SWOT Analysis
- 19.2.1.4. Recent Developments
- 19.2.1.5. Financials (Based on Availability)
- 19.2.2 Sensient Technologies
- 19.2.2.1. Overview
- 19.2.2.2. Products
- 19.2.2.3. SWOT Analysis
- 19.2.2.4. Recent Developments
- 19.2.2.5. Financials (Based on Availability)
- 19.2.3 Dohler Group
- 19.2.3.1. Overview
- 19.2.3.2. Products
- 19.2.3.3. SWOT Analysis
- 19.2.3.4. Recent Developments
- 19.2.3.5. Financials (Based on Availability)
- 19.2.4 Riken Vitamin
- 19.2.4.1. Overview
- 19.2.4.2. Products
- 19.2.4.3. SWOT Analysis
- 19.2.4.4. Recent Developments
- 19.2.4.5. Financials (Based on Availability)
- 19.2.5 BASF SE
- 19.2.5.1. Overview
- 19.2.5.2. Products
- 19.2.5.3. SWOT Analysis
- 19.2.5.4. Recent Developments
- 19.2.5.5. Financials (Based on Availability)
- 19.2.6 Koninklijke DSM N V
- 19.2.6.1. Overview
- 19.2.6.2. Products
- 19.2.6.3. SWOT Analysis
- 19.2.6.4. Recent Developments
- 19.2.6.5. Financials (Based on Availability)
- 19.2.7 D D Williamson & Co
- 19.2.7.1. Overview
- 19.2.7.2. Products
- 19.2.7.3. SWOT Analysis
- 19.2.7.4. Recent Developments
- 19.2.7.5. Financials (Based on Availability)
- 19.2.8 Givaudan (Naturex)*List Not Exhaustive
- 19.2.8.1. Overview
- 19.2.8.2. Products
- 19.2.8.3. SWOT Analysis
- 19.2.8.4. Recent Developments
- 19.2.8.5. Financials (Based on Availability)
- 19.2.1 Chr Hansen A/S
List of Figures
- Figure 1: Global EU Food Colorant Market Revenue Breakdown (Million, %) by Region 2024 & 2032
- Figure 2: North America EU Food Colorant Market Revenue (Million), by Country 2024 & 2032
- Figure 3: North America EU Food Colorant Market Revenue Share (%), by Country 2024 & 2032
- Figure 4: Europe EU Food Colorant Market Revenue (Million), by Country 2024 & 2032
- Figure 5: Europe EU Food Colorant Market Revenue Share (%), by Country 2024 & 2032
- Figure 6: Asia Pacific EU Food Colorant Market Revenue (Million), by Country 2024 & 2032
- Figure 7: Asia Pacific EU Food Colorant Market Revenue Share (%), by Country 2024 & 2032
- Figure 8: South America EU Food Colorant Market Revenue (Million), by Country 2024 & 2032
- Figure 9: South America EU Food Colorant Market Revenue Share (%), by Country 2024 & 2032
- Figure 10: North America EU Food Colorant Market Revenue (Million), by Country 2024 & 2032
- Figure 11: North America EU Food Colorant Market Revenue Share (%), by Country 2024 & 2032
- Figure 12: MEA EU Food Colorant Market Revenue (Million), by Country 2024 & 2032
- Figure 13: MEA EU Food Colorant Market Revenue Share (%), by Country 2024 & 2032
- Figure 14: Spain EU Food Colorant Market Revenue (Million), by Product Type 2024 & 2032
- Figure 15: Spain EU Food Colorant Market Revenue Share (%), by Product Type 2024 & 2032
- Figure 16: Spain EU Food Colorant Market Revenue (Million), by Application 2024 & 2032
- Figure 17: Spain EU Food Colorant Market Revenue Share (%), by Application 2024 & 2032
- Figure 18: Spain EU Food Colorant Market Revenue (Million), by Country 2024 & 2032
- Figure 19: Spain EU Food Colorant Market Revenue Share (%), by Country 2024 & 2032
- Figure 20: United Kingdom EU Food Colorant Market Revenue (Million), by Product Type 2024 & 2032
- Figure 21: United Kingdom EU Food Colorant Market Revenue Share (%), by Product Type 2024 & 2032
- Figure 22: United Kingdom EU Food Colorant Market Revenue (Million), by Application 2024 & 2032
- Figure 23: United Kingdom EU Food Colorant Market Revenue Share (%), by Application 2024 & 2032
- Figure 24: United Kingdom EU Food Colorant Market Revenue (Million), by Country 2024 & 2032
- Figure 25: United Kingdom EU Food Colorant Market Revenue Share (%), by Country 2024 & 2032
- Figure 26: Germany EU Food Colorant Market Revenue (Million), by Product Type 2024 & 2032
- Figure 27: Germany EU Food Colorant Market Revenue Share (%), by Product Type 2024 & 2032
- Figure 28: Germany EU Food Colorant Market Revenue (Million), by Application 2024 & 2032
- Figure 29: Germany EU Food Colorant Market Revenue Share (%), by Application 2024 & 2032
- Figure 30: Germany EU Food Colorant Market Revenue (Million), by Country 2024 & 2032
- Figure 31: Germany EU Food Colorant Market Revenue Share (%), by Country 2024 & 2032
- Figure 32: France EU Food Colorant Market Revenue (Million), by Product Type 2024 & 2032
- Figure 33: France EU Food Colorant Market Revenue Share (%), by Product Type 2024 & 2032
- Figure 34: France EU Food Colorant Market Revenue (Million), by Application 2024 & 2032
- Figure 35: France EU Food Colorant Market Revenue Share (%), by Application 2024 & 2032
- Figure 36: France EU Food Colorant Market Revenue (Million), by Country 2024 & 2032
- Figure 37: France EU Food Colorant Market Revenue Share (%), by Country 2024 & 2032
- Figure 38: Italy EU Food Colorant Market Revenue (Million), by Product Type 2024 & 2032
- Figure 39: Italy EU Food Colorant Market Revenue Share (%), by Product Type 2024 & 2032
- Figure 40: Italy EU Food Colorant Market Revenue (Million), by Application 2024 & 2032
- Figure 41: Italy EU Food Colorant Market Revenue Share (%), by Application 2024 & 2032
- Figure 42: Italy EU Food Colorant Market Revenue (Million), by Country 2024 & 2032
- Figure 43: Italy EU Food Colorant Market Revenue Share (%), by Country 2024 & 2032
- Figure 44: Russia EU Food Colorant Market Revenue (Million), by Product Type 2024 & 2032
- Figure 45: Russia EU Food Colorant Market Revenue Share (%), by Product Type 2024 & 2032
- Figure 46: Russia EU Food Colorant Market Revenue (Million), by Application 2024 & 2032
- Figure 47: Russia EU Food Colorant Market Revenue Share (%), by Application 2024 & 2032
- Figure 48: Russia EU Food Colorant Market Revenue (Million), by Country 2024 & 2032
- Figure 49: Russia EU Food Colorant Market Revenue Share (%), by Country 2024 & 2032
- Figure 50: Rest of Europe EU Food Colorant Market Revenue (Million), by Product Type 2024 & 2032
- Figure 51: Rest of Europe EU Food Colorant Market Revenue Share (%), by Product Type 2024 & 2032
- Figure 52: Rest of Europe EU Food Colorant Market Revenue (Million), by Application 2024 & 2032
- Figure 53: Rest of Europe EU Food Colorant Market Revenue Share (%), by Application 2024 & 2032
- Figure 54: Rest of Europe EU Food Colorant Market Revenue (Million), by Country 2024 & 2032
- Figure 55: Rest of Europe EU Food Colorant Market Revenue Share (%), by Country 2024 & 2032
List of Tables
- Table 1: Global EU Food Colorant Market Revenue Million Forecast, by Region 2019 & 2032
- Table 2: Global EU Food Colorant Market Revenue Million Forecast, by Product Type 2019 & 2032
- Table 3: Global EU Food Colorant Market Revenue Million Forecast, by Application 2019 & 2032
- Table 4: Global EU Food Colorant Market Revenue Million Forecast, by Region 2019 & 2032
- Table 5: Global EU Food Colorant Market Revenue Million Forecast, by Country 2019 & 2032
- Table 6: United States EU Food Colorant Market Revenue (Million) Forecast, by Application 2019 & 2032
- Table 7: Canada EU Food Colorant Market Revenue (Million) Forecast, by Application 2019 & 2032
- Table 8: Mexico EU Food Colorant Market Revenue (Million) Forecast, by Application 2019 & 2032
- Table 9: Global EU Food Colorant Market Revenue Million Forecast, by Country 2019 & 2032
- Table 10: Germany EU Food Colorant Market Revenue (Million) Forecast, by Application 2019 & 2032
- Table 11: United Kingdom EU Food Colorant Market Revenue (Million) Forecast, by Application 2019 & 2032
- Table 12: France EU Food Colorant Market Revenue (Million) Forecast, by Application 2019 & 2032
- Table 13: Spain EU Food Colorant Market Revenue (Million) Forecast, by Application 2019 & 2032
- Table 14: Italy EU Food Colorant Market Revenue (Million) Forecast, by Application 2019 & 2032
- Table 15: Spain EU Food Colorant Market Revenue (Million) Forecast, by Application 2019 & 2032
- Table 16: Belgium EU Food Colorant Market Revenue (Million) Forecast, by Application 2019 & 2032
- Table 17: Netherland EU Food Colorant Market Revenue (Million) Forecast, by Application 2019 & 2032
- Table 18: Nordics EU Food Colorant Market Revenue (Million) Forecast, by Application 2019 & 2032
- Table 19: Rest of Europe EU Food Colorant Market Revenue (Million) Forecast, by Application 2019 & 2032
- Table 20: Global EU Food Colorant Market Revenue Million Forecast, by Country 2019 & 2032
- Table 21: China EU Food Colorant Market Revenue (Million) Forecast, by Application 2019 & 2032
- Table 22: Japan EU Food Colorant Market Revenue (Million) Forecast, by Application 2019 & 2032
- Table 23: India EU Food Colorant Market Revenue (Million) Forecast, by Application 2019 & 2032
- Table 24: South Korea EU Food Colorant Market Revenue (Million) Forecast, by Application 2019 & 2032
- Table 25: Southeast Asia EU Food Colorant Market Revenue (Million) Forecast, by Application 2019 & 2032
- Table 26: Australia EU Food Colorant Market Revenue (Million) Forecast, by Application 2019 & 2032
- Table 27: Indonesia EU Food Colorant Market Revenue (Million) Forecast, by Application 2019 & 2032
- Table 28: Phillipes EU Food Colorant Market Revenue (Million) Forecast, by Application 2019 & 2032
- Table 29: Singapore EU Food Colorant Market Revenue (Million) Forecast, by Application 2019 & 2032
- Table 30: Thailandc EU Food Colorant Market Revenue (Million) Forecast, by Application 2019 & 2032
- Table 31: Rest of Asia Pacific EU Food Colorant Market Revenue (Million) Forecast, by Application 2019 & 2032
- Table 32: Global EU Food Colorant Market Revenue Million Forecast, by Country 2019 & 2032
- Table 33: Brazil EU Food Colorant Market Revenue (Million) Forecast, by Application 2019 & 2032
- Table 34: Argentina EU Food Colorant Market Revenue (Million) Forecast, by Application 2019 & 2032
- Table 35: Peru EU Food Colorant Market Revenue (Million) Forecast, by Application 2019 & 2032
- Table 36: Chile EU Food Colorant Market Revenue (Million) Forecast, by Application 2019 & 2032
- Table 37: Colombia EU Food Colorant Market Revenue (Million) Forecast, by Application 2019 & 2032
- Table 38: Ecuador EU Food Colorant Market Revenue (Million) Forecast, by Application 2019 & 2032
- Table 39: Venezuela EU Food Colorant Market Revenue (Million) Forecast, by Application 2019 & 2032
- Table 40: Rest of South America EU Food Colorant Market Revenue (Million) Forecast, by Application 2019 & 2032
- Table 41: Global EU Food Colorant Market Revenue Million Forecast, by Country 2019 & 2032
- Table 42: United States EU Food Colorant Market Revenue (Million) Forecast, by Application 2019 & 2032
- Table 43: Canada EU Food Colorant Market Revenue (Million) Forecast, by Application 2019 & 2032
- Table 44: Mexico EU Food Colorant Market Revenue (Million) Forecast, by Application 2019 & 2032
- Table 45: Global EU Food Colorant Market Revenue Million Forecast, by Country 2019 & 2032
- Table 46: United Arab Emirates EU Food Colorant Market Revenue (Million) Forecast, by Application 2019 & 2032
- Table 47: Saudi Arabia EU Food Colorant Market Revenue (Million) Forecast, by Application 2019 & 2032
- Table 48: South Africa EU Food Colorant Market Revenue (Million) Forecast, by Application 2019 & 2032
- Table 49: Rest of Middle East and Africa EU Food Colorant Market Revenue (Million) Forecast, by Application 2019 & 2032
- Table 50: Global EU Food Colorant Market Revenue Million Forecast, by Product Type 2019 & 2032
- Table 51: Global EU Food Colorant Market Revenue Million Forecast, by Application 2019 & 2032
- Table 52: Global EU Food Colorant Market Revenue Million Forecast, by Country 2019 & 2032
- Table 53: Global EU Food Colorant Market Revenue Million Forecast, by Product Type 2019 & 2032
- Table 54: Global EU Food Colorant Market Revenue Million Forecast, by Application 2019 & 2032
- Table 55: Global EU Food Colorant Market Revenue Million Forecast, by Country 2019 & 2032
- Table 56: Global EU Food Colorant Market Revenue Million Forecast, by Product Type 2019 & 2032
- Table 57: Global EU Food Colorant Market Revenue Million Forecast, by Application 2019 & 2032
- Table 58: Global EU Food Colorant Market Revenue Million Forecast, by Country 2019 & 2032
- Table 59: Global EU Food Colorant Market Revenue Million Forecast, by Product Type 2019 & 2032
- Table 60: Global EU Food Colorant Market Revenue Million Forecast, by Application 2019 & 2032
- Table 61: Global EU Food Colorant Market Revenue Million Forecast, by Country 2019 & 2032
- Table 62: Global EU Food Colorant Market Revenue Million Forecast, by Product Type 2019 & 2032
- Table 63: Global EU Food Colorant Market Revenue Million Forecast, by Application 2019 & 2032
- Table 64: Global EU Food Colorant Market Revenue Million Forecast, by Country 2019 & 2032
- Table 65: Global EU Food Colorant Market Revenue Million Forecast, by Product Type 2019 & 2032
- Table 66: Global EU Food Colorant Market Revenue Million Forecast, by Application 2019 & 2032
- Table 67: Global EU Food Colorant Market Revenue Million Forecast, by Country 2019 & 2032
- Table 68: Global EU Food Colorant Market Revenue Million Forecast, by Product Type 2019 & 2032
- Table 69: Global EU Food Colorant Market Revenue Million Forecast, by Application 2019 & 2032
- Table 70: Global EU Food Colorant Market Revenue Million Forecast, by Country 2019 & 2032
Frequently Asked Questions
1. What is the projected Compound Annual Growth Rate (CAGR) of the EU Food Colorant Market?
The projected CAGR is approximately 3.80%.
2. Which companies are prominent players in the EU Food Colorant Market?
Key companies in the market include Chr Hansen A/S, Sensient Technologies, Dohler Group, Riken Vitamin, BASF SE, Koninklijke DSM N V, D D Williamson & Co, Givaudan (Naturex)*List Not Exhaustive.
3. What are the main segments of the EU Food Colorant Market?
The market segments include Product Type, Application.
4. Can you provide details about the market size?
The market size is estimated to be USD XX Million as of 2022.
5. What are some drivers contributing to market growth?
The Rising Awareness of the Health Benefits Associated with Collagen Consumption; Rising Sport and Fitness Trends Drives the Market Growth.
6. What are the notable trends driving market growth?
United Kingdom Held the Largest Market Share.
7. Are there any restraints impacting market growth?
Concerns over the Source and Animal Welfare in Collagen Extraction Limit the Market Growth.
8. Can you provide examples of recent developments in the market?
N/A
9. What pricing options are available for accessing the report?
Pricing options include single-user, multi-user, and enterprise licenses priced at USD 4750, USD 5250, and USD 8750 respectively.
10. Is the market size provided in terms of value or volume?
The market size is provided in terms of value, measured in Million.
11. Are there any specific market keywords associated with the report?
Yes, the market keyword associated with the report is "EU Food Colorant Market," which aids in identifying and referencing the specific market segment covered.
12. How do I determine which pricing option suits my needs best?
The pricing options vary based on user requirements and access needs. Individual users may opt for single-user licenses, while businesses requiring broader access may choose multi-user or enterprise licenses for cost-effective access to the report.
13. Are there any additional resources or data provided in the EU Food Colorant Market report?
While the report offers comprehensive insights, it's advisable to review the specific contents or supplementary materials provided to ascertain if additional resources or data are available.
14. How can I stay updated on further developments or reports in the EU Food Colorant Market?
To stay informed about further developments, trends, and reports in the EU Food Colorant Market, consider subscribing to industry newsletters, following relevant companies and organizations, or regularly checking reputable industry news sources and publications.
Methodology
Step 1 - Identification of Relevant Samples Size from Population Database


Step 2 - Approaches for Defining Global Market Size (Value, Volume* & Price*)

Note*: In applicable scenarios
Step 3 - Data Sources
Primary Research
- Web Analytics
- Survey Reports
- Research Institute
- Latest Research Reports
- Opinion Leaders
Secondary Research
- Annual Reports
- White Paper
- Latest Press Release
- Industry Association
- Paid Database
- Investor Presentations

Step 4 - Data Triangulation
Involves using different sources of information in order to increase the validity of a study
These sources are likely to be stakeholders in a program - participants, other researchers, program staff, other community members, and so on.
Then we put all data in single framework & apply various statistical tools to find out the dynamic on the market.
During the analysis stage, feedback from the stakeholder groups would be compared to determine areas of agreement as well as areas of divergence


