
Key Insights
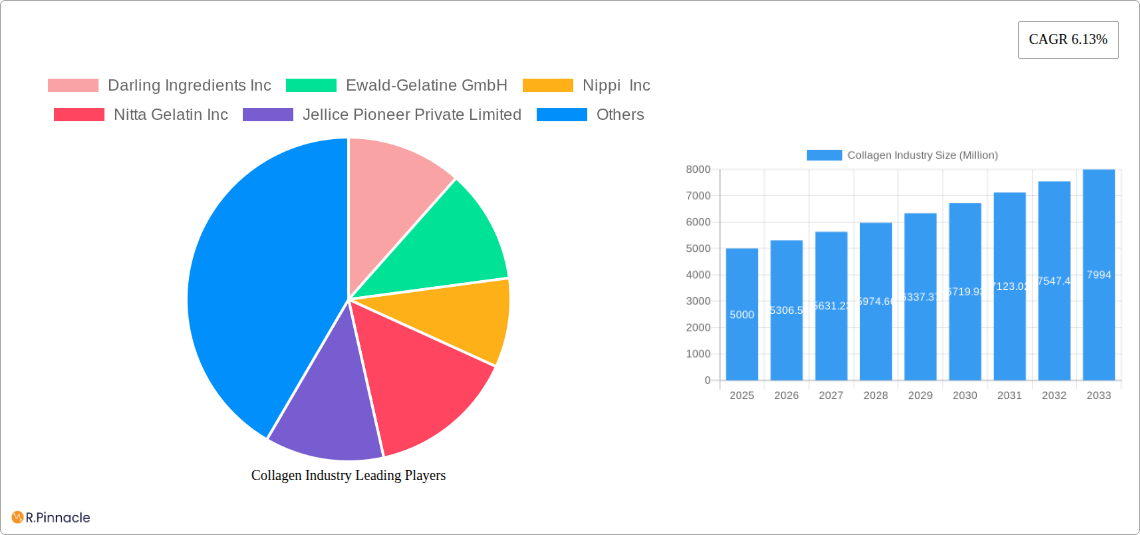
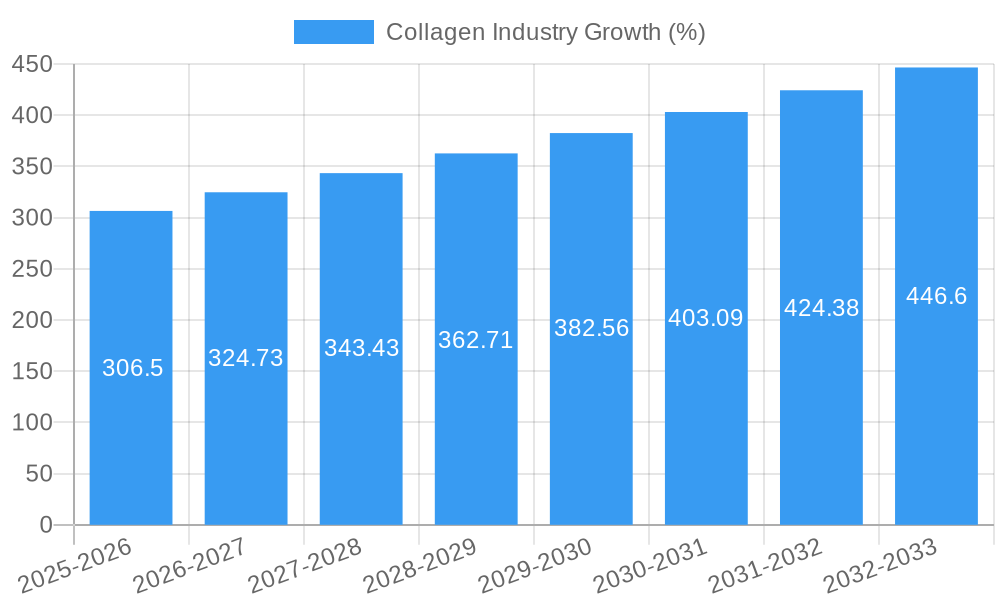
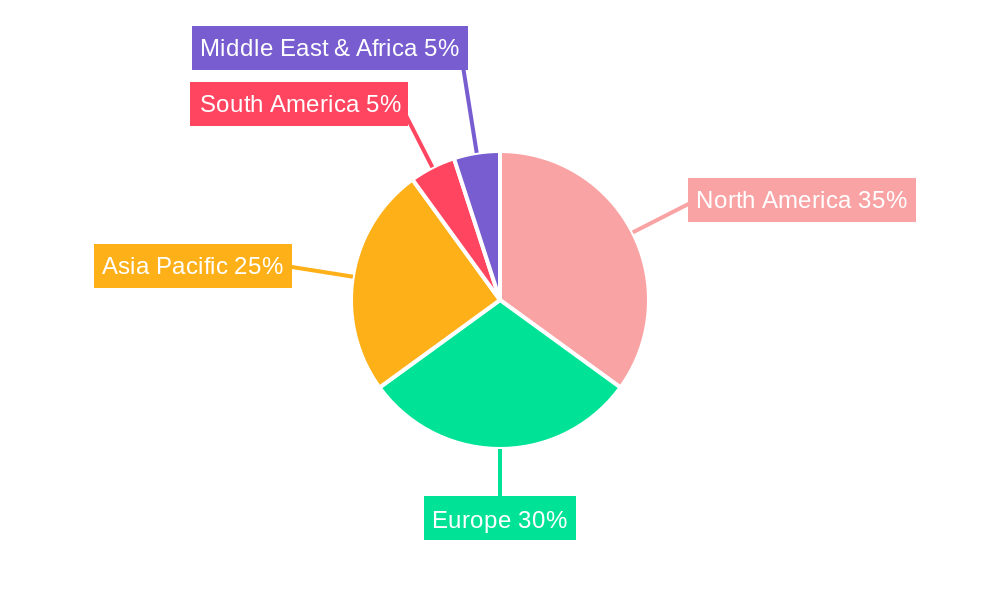
The global collagen market, valued at approximately $XX million in 2025, is projected to experience robust growth, driven by a 6.13% CAGR from 2025 to 2033. This expansion is fueled by several key factors. The increasing demand for collagen-based products in the animal feed industry, particularly for enhancing animal health and productivity, is a significant driver. Simultaneously, the burgeoning food and beverage sector's incorporation of collagen peptides for their functional and nutritional benefits, such as improved skin health and joint support, is propelling market growth. The sports and performance nutrition segment also contributes significantly, with athletes utilizing collagen supplements for enhanced muscle recovery and improved performance. Growth is further supported by rising consumer awareness of collagen's health benefits and increasing disposable incomes in developing economies. The market is segmented by form (animal-based, marine-based) and end-user application (animal feed, food and beverages, sport/performance nutrition). Animal-based collagen currently holds a larger market share, but marine-based collagen is gaining traction due to its sustainability and perceived health advantages. While the market faces challenges such as potential supply chain disruptions and fluctuating raw material prices, the overall outlook remains positive, indicating substantial growth opportunities for key players in the coming years. Geographical distribution shows strong market presence in North America and Europe, with Asia-Pacific poised for significant expansion given its rising consumer base and increasing health consciousness.
Leading companies such as Darling Ingredients Inc., GELITA AG, and Nitta Gelatin Inc. are actively shaping the market through innovation, product diversification, and strategic partnerships. Competition is expected to intensify, with companies focusing on developing novel collagen products tailored to specific end-user needs and geographical preferences. The market's continued growth will likely hinge on the development of sustainable sourcing practices, enhanced product quality control, and effective marketing strategies that highlight the proven health benefits of collagen. Further research into the specific effects of different collagen types on various health outcomes will also contribute to continued expansion.
Collagen Industry Market Report: 2019-2033
This comprehensive report provides a detailed analysis of the global collagen industry, offering invaluable insights for industry professionals, investors, and strategic decision-makers. Covering the period from 2019 to 2033, with a focus on 2025, this report unveils the market's structure, dynamics, and future outlook, highlighting key players, emerging trends, and significant challenges. The global collagen market is estimated to be worth xx Million in 2025 and is projected to reach xx Million by 2033, exhibiting a robust CAGR of xx%.
Collagen Industry Market Structure & Innovation Trends
This section delves into the competitive landscape of the collagen industry, analyzing market concentration, innovation drivers, and regulatory factors. We examine the interplay of various factors shaping the market's trajectory, including:
- Market Concentration: The global collagen market exhibits a moderately concentrated structure, with a few dominant players holding significant market share. Darling Ingredients Inc, GELITA AG, and Nippi Inc are among the key players, collectively accounting for an estimated xx% of the market in 2025.
- Innovation Drivers: The demand for high-quality collagen products, driven by the burgeoning health and wellness sector, fuels innovation in extraction methods, product formulations, and applications. The development of novel collagen peptides and hydrolysates tailored to specific end-user needs is a major driver.
- Regulatory Frameworks: Stringent regulations concerning food safety and ingredient sourcing significantly influence market dynamics. Compliance with evolving standards poses both challenges and opportunities for manufacturers.
- Product Substitutes: While collagen remains a dominant player in its sector, alternative ingredients like plant-based proteins and other biomaterials present a level of competitive pressure.
- End-User Demographics: The aging global population and increased health consciousness are driving the demand for collagen products across diverse end-user segments, including food and beverage, sports nutrition, and animal feed.
- M&A Activities: Consolidation through mergers and acquisitions is a common trend in the industry, with recent deals valued at an estimated xx Million collectively impacting market share and competitive positioning. Specific examples of M&A activities are included within the report.
Collagen Industry Market Dynamics & Trends
This section analyzes the key market dynamics and trends impacting the collagen industry's growth. We explore market growth drivers, technological advancements, consumer preferences, and the competitive landscape. The report features detailed analyses of:
- Market Growth Drivers: Increasing consumer awareness of collagen's benefits for skin health, joint mobility, and overall wellness is a significant driver. The expansion of the sports nutrition and beauty markets further boosts demand.
- Technological Disruptions: Advancements in collagen extraction and processing technologies lead to higher-quality products with improved bioavailability and functionality. This includes innovations in enzymatic hydrolysis, purification, and formulation.
- Consumer Preferences: Consumer preference shifts towards clean-label, natural, and sustainably sourced collagen products shape product development and marketing strategies.
- Competitive Dynamics: The industry landscape is characterized by both competition and collaboration. Key players are engaged in strategic partnerships, product diversification, and expansion into new markets to maintain their edge.
Dominant Regions & Segments in Collagen Industry
This section highlights the leading regions and segments within the collagen market.
Leading Region: North America currently holds the largest market share, driven by high consumption in the United States and Canada. However, Asia-Pacific is poised for rapid growth, fueled by rising disposable incomes and increasing health awareness in countries like China and Japan.
Leading Segments:
Form: Animal-based collagen dominates the market due to its established production processes and widespread acceptance. However, marine-based collagen is emerging as a sustainable alternative, gaining traction among environmentally conscious consumers.
End-User: The Food and Beverages segment currently holds the largest market share. However, the Sport/Performance Nutrition sector is experiencing rapid growth due to collagen's role in muscle recovery and athletic performance. Animal Feed is a significant segment with consistent demand.
Key Drivers (by bullet points):
- North America: Strong regulatory frameworks, high disposable incomes, and established distribution networks contribute to the region's dominance.
- Asia-Pacific: Rapid economic growth, expanding middle class, and rising awareness of health and wellness are key growth drivers.
- Europe: Mature markets with well-established consumer preferences and technological advancements continue to drive steady growth.
Collagen Industry Product Innovations
Recent years have witnessed significant product innovation within the collagen industry, driven by technological advancements and changing consumer demands. The focus has shifted towards enhanced product formulations with improved bioavailability, targeted functionalities (e.g., improved skin hydration, joint support), and sustainable sourcing. The emergence of collagen peptides with specific molecular weight ranges tailored for various applications has revolutionized product development and effectiveness.
Report Scope & Segmentation Analysis
This report comprehensively segments the collagen market based on form (Animal Based, Marine Based) and end-user (Animal Feed, Food and Beverages, Sport/Performance Nutrition). Each segment's market size, growth projections, and competitive dynamics are analyzed in detail, providing a granular view of the industry's structure and growth potential. Growth rates vary significantly across segments with Sport/Performance Nutrition showing strong potential for growth above average.
Key Drivers of Collagen Industry Growth
Several key factors contribute to the collagen industry's robust growth. These include: increasing consumer awareness of collagen's health benefits, the expansion of the sports nutrition and functional food markets, advancements in extraction and processing technologies leading to higher quality and more effective products, and supportive regulatory environments in key markets.
Challenges in the Collagen Industry Sector
The collagen industry faces challenges including stringent regulations regarding sourcing and production, fluctuations in raw material costs, and increasing competition from alternative protein sources and biomaterials. Furthermore, ensuring product consistency and quality throughout the supply chain remains a key challenge.
Emerging Opportunities in Collagen Industry
Emerging opportunities include the development of new product applications, expansion into untapped markets, and the growing adoption of sustainable and ethical sourcing practices. Innovations in product delivery formats (e.g., convenient sachets, ready-to-mix powders) and the exploration of new collagen sources further present significant opportunities.
Leading Players in the Collagen Industry Market
- Darling Ingredients Inc
- Ewald-Gelatine GmbH
- Nippi Inc
- Nitta Gelatin Inc
- Jellice Pioneer Private Limited
- GELITA AG
- ASAHI GELATINE INDUSTRIAL Co Ltd
- Foodchem International Corporation
- Italgelatine SpA
Key Developments in Collagen Industry Industry
- July 2022: Jellice Taiwan launched META Collagen, expanding its product portfolio and targeting a new market segment. This launch enhances market competition and provides consumers with more options.
- February 2022: Nippi Shanghai's collaboration with Infobird Co. Ltd leverages AI to enhance sales and market share in the crucial Chinese market, signifying the adoption of innovative marketing strategies.
- March 2021: GELITA USA's expansion signifies substantial investment in production capacity, driven by strong market demand and reflects confidence in future growth within the collagen peptide market.
Future Outlook for Collagen Industry Market
The collagen market is poised for continued growth, driven by ongoing innovation in product development, expansion into new applications, and the increasing adoption of collagen-based solutions across various sectors. Strategic partnerships, mergers, and acquisitions will continue to shape the industry's competitive dynamics, creating further opportunities for growth and consolidation.
Collagen Industry Segmentation
-
1. Form
- 1.1. Animal Based
- 1.2. Marine Based
-
2. End User
- 2.1. Animal Feed
-
2.2. Food and Beverages
-
2.2.1. By Sub End User
- 2.2.1.1. Bakery
- 2.2.1.2. Breakfast Cereals
- 2.2.1.3. Snacks
-
2.2.1. By Sub End User
- 2.3. Personal Care and Cosmetics
-
2.4. Supplements
- 2.4.1. Elderly Nutrition and Medical Nutrition
- 2.4.2. Sport/Performance Nutrition
Collagen Industry Segmentation By Geography
-
1. North America
- 1.1. United States
- 1.2. Canada
- 1.3. Mexico
-
2. South America
- 2.1. Brazil
- 2.2. Argentina
- 2.3. Rest of South America
-
3. Europe
- 3.1. United Kingdom
- 3.2. Germany
- 3.3. France
- 3.4. Italy
- 3.5. Spain
- 3.6. Russia
- 3.7. Benelux
- 3.8. Nordics
- 3.9. Rest of Europe
-
4. Middle East & Africa
- 4.1. Turkey
- 4.2. Israel
- 4.3. GCC
- 4.4. North Africa
- 4.5. South Africa
- 4.6. Rest of Middle East & Africa
-
5. Asia Pacific
- 5.1. China
- 5.2. India
- 5.3. Japan
- 5.4. South Korea
- 5.5. ASEAN
- 5.6. Oceania
- 5.7. Rest of Asia Pacific
Collagen Industry REPORT HIGHLIGHTS
| Aspects | Details |
|---|---|
| Study Period | 2019-2033 |
| Base Year | 2024 |
| Estimated Year | 2025 |
| Forecast Period | 2025-2033 |
| Historical Period | 2019-2024 |
| Growth Rate | CAGR of 6.13% from 2019-2033 |
| Segmentation |
|
Table of Contents
- 1. Introduction
- 1.1. Research Scope
- 1.2. Market Segmentation
- 1.3. Research Methodology
- 1.4. Definitions and Assumptions
- 2. Executive Summary
- 2.1. Introduction
- 3. Market Dynamics
- 3.1. Introduction
- 3.2. Market Drivers
- 3.2.1. Rising Health and Wellness Trends Drives the Market; Rising Demand for functional Food Drives the Market
- 3.3. Market Restrains
- 3.3.1. High Competition from Other Protein Sources
- 3.4. Market Trends
- 3.4.1. OTHER KEY INDUSTRY TRENDS COVERED IN THE REPORT
- 4. Market Factor Analysis
- 4.1. Porters Five Forces
- 4.2. Supply/Value Chain
- 4.3. PESTEL analysis
- 4.4. Market Entropy
- 4.5. Patent/Trademark Analysis
- 5. Global Collagen Industry Analysis, Insights and Forecast, 2019-2031
- 5.1. Market Analysis, Insights and Forecast - by Form
- 5.1.1. Animal Based
- 5.1.2. Marine Based
- 5.2. Market Analysis, Insights and Forecast - by End User
- 5.2.1. Animal Feed
- 5.2.2. Food and Beverages
- 5.2.2.1. By Sub End User
- 5.2.2.1.1. Bakery
- 5.2.2.1.2. Breakfast Cereals
- 5.2.2.1.3. Snacks
- 5.2.2.1. By Sub End User
- 5.2.3. Personal Care and Cosmetics
- 5.2.4. Supplements
- 5.2.4.1. Elderly Nutrition and Medical Nutrition
- 5.2.4.2. Sport/Performance Nutrition
- 5.3. Market Analysis, Insights and Forecast - by Region
- 5.3.1. North America
- 5.3.2. South America
- 5.3.3. Europe
- 5.3.4. Middle East & Africa
- 5.3.5. Asia Pacific
- 5.1. Market Analysis, Insights and Forecast - by Form
- 6. North America Collagen Industry Analysis, Insights and Forecast, 2019-2031
- 6.1. Market Analysis, Insights and Forecast - by Form
- 6.1.1. Animal Based
- 6.1.2. Marine Based
- 6.2. Market Analysis, Insights and Forecast - by End User
- 6.2.1. Animal Feed
- 6.2.2. Food and Beverages
- 6.2.2.1. By Sub End User
- 6.2.2.1.1. Bakery
- 6.2.2.1.2. Breakfast Cereals
- 6.2.2.1.3. Snacks
- 6.2.2.1. By Sub End User
- 6.2.3. Personal Care and Cosmetics
- 6.2.4. Supplements
- 6.2.4.1. Elderly Nutrition and Medical Nutrition
- 6.2.4.2. Sport/Performance Nutrition
- 6.1. Market Analysis, Insights and Forecast - by Form
- 7. South America Collagen Industry Analysis, Insights and Forecast, 2019-2031
- 7.1. Market Analysis, Insights and Forecast - by Form
- 7.1.1. Animal Based
- 7.1.2. Marine Based
- 7.2. Market Analysis, Insights and Forecast - by End User
- 7.2.1. Animal Feed
- 7.2.2. Food and Beverages
- 7.2.2.1. By Sub End User
- 7.2.2.1.1. Bakery
- 7.2.2.1.2. Breakfast Cereals
- 7.2.2.1.3. Snacks
- 7.2.2.1. By Sub End User
- 7.2.3. Personal Care and Cosmetics
- 7.2.4. Supplements
- 7.2.4.1. Elderly Nutrition and Medical Nutrition
- 7.2.4.2. Sport/Performance Nutrition
- 7.1. Market Analysis, Insights and Forecast - by Form
- 8. Europe Collagen Industry Analysis, Insights and Forecast, 2019-2031
- 8.1. Market Analysis, Insights and Forecast - by Form
- 8.1.1. Animal Based
- 8.1.2. Marine Based
- 8.2. Market Analysis, Insights and Forecast - by End User
- 8.2.1. Animal Feed
- 8.2.2. Food and Beverages
- 8.2.2.1. By Sub End User
- 8.2.2.1.1. Bakery
- 8.2.2.1.2. Breakfast Cereals
- 8.2.2.1.3. Snacks
- 8.2.2.1. By Sub End User
- 8.2.3. Personal Care and Cosmetics
- 8.2.4. Supplements
- 8.2.4.1. Elderly Nutrition and Medical Nutrition
- 8.2.4.2. Sport/Performance Nutrition
- 8.1. Market Analysis, Insights and Forecast - by Form
- 9. Middle East & Africa Collagen Industry Analysis, Insights and Forecast, 2019-2031
- 9.1. Market Analysis, Insights and Forecast - by Form
- 9.1.1. Animal Based
- 9.1.2. Marine Based
- 9.2. Market Analysis, Insights and Forecast - by End User
- 9.2.1. Animal Feed
- 9.2.2. Food and Beverages
- 9.2.2.1. By Sub End User
- 9.2.2.1.1. Bakery
- 9.2.2.1.2. Breakfast Cereals
- 9.2.2.1.3. Snacks
- 9.2.2.1. By Sub End User
- 9.2.3. Personal Care and Cosmetics
- 9.2.4. Supplements
- 9.2.4.1. Elderly Nutrition and Medical Nutrition
- 9.2.4.2. Sport/Performance Nutrition
- 9.1. Market Analysis, Insights and Forecast - by Form
- 10. Asia Pacific Collagen Industry Analysis, Insights and Forecast, 2019-2031
- 10.1. Market Analysis, Insights and Forecast - by Form
- 10.1.1. Animal Based
- 10.1.2. Marine Based
- 10.2. Market Analysis, Insights and Forecast - by End User
- 10.2.1. Animal Feed
- 10.2.2. Food and Beverages
- 10.2.2.1. By Sub End User
- 10.2.2.1.1. Bakery
- 10.2.2.1.2. Breakfast Cereals
- 10.2.2.1.3. Snacks
- 10.2.2.1. By Sub End User
- 10.2.3. Personal Care and Cosmetics
- 10.2.4. Supplements
- 10.2.4.1. Elderly Nutrition and Medical Nutrition
- 10.2.4.2. Sport/Performance Nutrition
- 10.1. Market Analysis, Insights and Forecast - by Form
- 11. North America Collagen Industry Analysis, Insights and Forecast, 2019-2031
- 11.1. Market Analysis, Insights and Forecast - By Country/Sub-region
- 11.1.1 United States
- 11.1.2 Canada
- 11.1.3 Mexico
- 12. South America Collagen Industry Analysis, Insights and Forecast, 2019-2031
- 12.1. Market Analysis, Insights and Forecast - By Country/Sub-region
- 12.1.1 Brazil
- 12.1.2 Argentina
- 12.1.3 Rest of South America
- 13. Asia Pacific Collagen Industry Analysis, Insights and Forecast, 2019-2031
- 13.1. Market Analysis, Insights and Forecast - By Country/Sub-region
- 13.1.1 China
- 13.1.2 Japan
- 13.1.3 India
- 13.1.4 South Korea
- 13.1.5 Taiwan
- 13.1.6 Australia
- 13.1.7 Rest of Asia-Pacific
- 14. Europe Collagen Industry Analysis, Insights and Forecast, 2019-2031
- 14.1. Market Analysis, Insights and Forecast - By Country/Sub-region
- 14.1.1 Germany
- 14.1.2 France
- 14.1.3 Italy
- 14.1.4 United Kingdom
- 14.1.5 Netherlands
- 14.1.6 Sweden
- 14.1.7 Rest of Europe
- 15. Middle East & Africa Collagen Industry Analysis, Insights and Forecast, 2019-2031
- 15.1. Market Analysis, Insights and Forecast - By Country/Sub-region
- 15.1.1 UAE
- 15.1.2 South Africa
- 15.1.3 Saudi Arabia
- 15.1.4 Rest of MEA
- 16. Competitive Analysis
- 16.1. Global Market Share Analysis 2024
- 16.2. Company Profiles
- 16.2.1 Darling Ingredients Inc
- 16.2.1.1. Overview
- 16.2.1.2. Products
- 16.2.1.3. SWOT Analysis
- 16.2.1.4. Recent Developments
- 16.2.1.5. Financials (Based on Availability)
- 16.2.2 Ewald-Gelatine GmbH
- 16.2.2.1. Overview
- 16.2.2.2. Products
- 16.2.2.3. SWOT Analysis
- 16.2.2.4. Recent Developments
- 16.2.2.5. Financials (Based on Availability)
- 16.2.3 Nippi Inc
- 16.2.3.1. Overview
- 16.2.3.2. Products
- 16.2.3.3. SWOT Analysis
- 16.2.3.4. Recent Developments
- 16.2.3.5. Financials (Based on Availability)
- 16.2.4 Nitta Gelatin Inc
- 16.2.4.1. Overview
- 16.2.4.2. Products
- 16.2.4.3. SWOT Analysis
- 16.2.4.4. Recent Developments
- 16.2.4.5. Financials (Based on Availability)
- 16.2.5 Jellice Pioneer Private Limited
- 16.2.5.1. Overview
- 16.2.5.2. Products
- 16.2.5.3. SWOT Analysis
- 16.2.5.4. Recent Developments
- 16.2.5.5. Financials (Based on Availability)
- 16.2.6 GELITA AG
- 16.2.6.1. Overview
- 16.2.6.2. Products
- 16.2.6.3. SWOT Analysis
- 16.2.6.4. Recent Developments
- 16.2.6.5. Financials (Based on Availability)
- 16.2.7 ASAHI GELATINE INDUSTRIAL Co Ltd
- 16.2.7.1. Overview
- 16.2.7.2. Products
- 16.2.7.3. SWOT Analysis
- 16.2.7.4. Recent Developments
- 16.2.7.5. Financials (Based on Availability)
- 16.2.8 Foodchem International Corporation
- 16.2.8.1. Overview
- 16.2.8.2. Products
- 16.2.8.3. SWOT Analysis
- 16.2.8.4. Recent Developments
- 16.2.8.5. Financials (Based on Availability)
- 16.2.9 Italgelatine SpA
- 16.2.9.1. Overview
- 16.2.9.2. Products
- 16.2.9.3. SWOT Analysis
- 16.2.9.4. Recent Developments
- 16.2.9.5. Financials (Based on Availability)
- 16.2.1 Darling Ingredients Inc
List of Figures
- Figure 1: Global Collagen Industry Revenue Breakdown (Million, %) by Region 2024 & 2032
- Figure 2: North America Collagen Industry Revenue (Million), by Country 2024 & 2032
- Figure 3: North America Collagen Industry Revenue Share (%), by Country 2024 & 2032
- Figure 4: South America Collagen Industry Revenue (Million), by Country 2024 & 2032
- Figure 5: South America Collagen Industry Revenue Share (%), by Country 2024 & 2032
- Figure 6: Asia Pacific Collagen Industry Revenue (Million), by Country 2024 & 2032
- Figure 7: Asia Pacific Collagen Industry Revenue Share (%), by Country 2024 & 2032
- Figure 8: Europe Collagen Industry Revenue (Million), by Country 2024 & 2032
- Figure 9: Europe Collagen Industry Revenue Share (%), by Country 2024 & 2032
- Figure 10: Middle East & Africa Collagen Industry Revenue (Million), by Country 2024 & 2032
- Figure 11: Middle East & Africa Collagen Industry Revenue Share (%), by Country 2024 & 2032
- Figure 12: North America Collagen Industry Revenue (Million), by Form 2024 & 2032
- Figure 13: North America Collagen Industry Revenue Share (%), by Form 2024 & 2032
- Figure 14: North America Collagen Industry Revenue (Million), by End User 2024 & 2032
- Figure 15: North America Collagen Industry Revenue Share (%), by End User 2024 & 2032
- Figure 16: North America Collagen Industry Revenue (Million), by Country 2024 & 2032
- Figure 17: North America Collagen Industry Revenue Share (%), by Country 2024 & 2032
- Figure 18: South America Collagen Industry Revenue (Million), by Form 2024 & 2032
- Figure 19: South America Collagen Industry Revenue Share (%), by Form 2024 & 2032
- Figure 20: South America Collagen Industry Revenue (Million), by End User 2024 & 2032
- Figure 21: South America Collagen Industry Revenue Share (%), by End User 2024 & 2032
- Figure 22: South America Collagen Industry Revenue (Million), by Country 2024 & 2032
- Figure 23: South America Collagen Industry Revenue Share (%), by Country 2024 & 2032
- Figure 24: Europe Collagen Industry Revenue (Million), by Form 2024 & 2032
- Figure 25: Europe Collagen Industry Revenue Share (%), by Form 2024 & 2032
- Figure 26: Europe Collagen Industry Revenue (Million), by End User 2024 & 2032
- Figure 27: Europe Collagen Industry Revenue Share (%), by End User 2024 & 2032
- Figure 28: Europe Collagen Industry Revenue (Million), by Country 2024 & 2032
- Figure 29: Europe Collagen Industry Revenue Share (%), by Country 2024 & 2032
- Figure 30: Middle East & Africa Collagen Industry Revenue (Million), by Form 2024 & 2032
- Figure 31: Middle East & Africa Collagen Industry Revenue Share (%), by Form 2024 & 2032
- Figure 32: Middle East & Africa Collagen Industry Revenue (Million), by End User 2024 & 2032
- Figure 33: Middle East & Africa Collagen Industry Revenue Share (%), by End User 2024 & 2032
- Figure 34: Middle East & Africa Collagen Industry Revenue (Million), by Country 2024 & 2032
- Figure 35: Middle East & Africa Collagen Industry Revenue Share (%), by Country 2024 & 2032
- Figure 36: Asia Pacific Collagen Industry Revenue (Million), by Form 2024 & 2032
- Figure 37: Asia Pacific Collagen Industry Revenue Share (%), by Form 2024 & 2032
- Figure 38: Asia Pacific Collagen Industry Revenue (Million), by End User 2024 & 2032
- Figure 39: Asia Pacific Collagen Industry Revenue Share (%), by End User 2024 & 2032
- Figure 40: Asia Pacific Collagen Industry Revenue (Million), by Country 2024 & 2032
- Figure 41: Asia Pacific Collagen Industry Revenue Share (%), by Country 2024 & 2032
List of Tables
- Table 1: Global Collagen Industry Revenue Million Forecast, by Region 2019 & 2032
- Table 2: Global Collagen Industry Revenue Million Forecast, by Form 2019 & 2032
- Table 3: Global Collagen Industry Revenue Million Forecast, by End User 2019 & 2032
- Table 4: Global Collagen Industry Revenue Million Forecast, by Region 2019 & 2032
- Table 5: Global Collagen Industry Revenue Million Forecast, by Country 2019 & 2032
- Table 6: United States Collagen Industry Revenue (Million) Forecast, by Application 2019 & 2032
- Table 7: Canada Collagen Industry Revenue (Million) Forecast, by Application 2019 & 2032
- Table 8: Mexico Collagen Industry Revenue (Million) Forecast, by Application 2019 & 2032
- Table 9: Global Collagen Industry Revenue Million Forecast, by Country 2019 & 2032
- Table 10: Brazil Collagen Industry Revenue (Million) Forecast, by Application 2019 & 2032
- Table 11: Argentina Collagen Industry Revenue (Million) Forecast, by Application 2019 & 2032
- Table 12: Rest of South America Collagen Industry Revenue (Million) Forecast, by Application 2019 & 2032
- Table 13: Global Collagen Industry Revenue Million Forecast, by Country 2019 & 2032
- Table 14: China Collagen Industry Revenue (Million) Forecast, by Application 2019 & 2032
- Table 15: Japan Collagen Industry Revenue (Million) Forecast, by Application 2019 & 2032
- Table 16: India Collagen Industry Revenue (Million) Forecast, by Application 2019 & 2032
- Table 17: South Korea Collagen Industry Revenue (Million) Forecast, by Application 2019 & 2032
- Table 18: Taiwan Collagen Industry Revenue (Million) Forecast, by Application 2019 & 2032
- Table 19: Australia Collagen Industry Revenue (Million) Forecast, by Application 2019 & 2032
- Table 20: Rest of Asia-Pacific Collagen Industry Revenue (Million) Forecast, by Application 2019 & 2032
- Table 21: Global Collagen Industry Revenue Million Forecast, by Country 2019 & 2032
- Table 22: Germany Collagen Industry Revenue (Million) Forecast, by Application 2019 & 2032
- Table 23: France Collagen Industry Revenue (Million) Forecast, by Application 2019 & 2032
- Table 24: Italy Collagen Industry Revenue (Million) Forecast, by Application 2019 & 2032
- Table 25: United Kingdom Collagen Industry Revenue (Million) Forecast, by Application 2019 & 2032
- Table 26: Netherlands Collagen Industry Revenue (Million) Forecast, by Application 2019 & 2032
- Table 27: Sweden Collagen Industry Revenue (Million) Forecast, by Application 2019 & 2032
- Table 28: Rest of Europe Collagen Industry Revenue (Million) Forecast, by Application 2019 & 2032
- Table 29: Global Collagen Industry Revenue Million Forecast, by Country 2019 & 2032
- Table 30: UAE Collagen Industry Revenue (Million) Forecast, by Application 2019 & 2032
- Table 31: South Africa Collagen Industry Revenue (Million) Forecast, by Application 2019 & 2032
- Table 32: Saudi Arabia Collagen Industry Revenue (Million) Forecast, by Application 2019 & 2032
- Table 33: Rest of MEA Collagen Industry Revenue (Million) Forecast, by Application 2019 & 2032
- Table 34: Global Collagen Industry Revenue Million Forecast, by Form 2019 & 2032
- Table 35: Global Collagen Industry Revenue Million Forecast, by End User 2019 & 2032
- Table 36: Global Collagen Industry Revenue Million Forecast, by Country 2019 & 2032
- Table 37: United States Collagen Industry Revenue (Million) Forecast, by Application 2019 & 2032
- Table 38: Canada Collagen Industry Revenue (Million) Forecast, by Application 2019 & 2032
- Table 39: Mexico Collagen Industry Revenue (Million) Forecast, by Application 2019 & 2032
- Table 40: Global Collagen Industry Revenue Million Forecast, by Form 2019 & 2032
- Table 41: Global Collagen Industry Revenue Million Forecast, by End User 2019 & 2032
- Table 42: Global Collagen Industry Revenue Million Forecast, by Country 2019 & 2032
- Table 43: Brazil Collagen Industry Revenue (Million) Forecast, by Application 2019 & 2032
- Table 44: Argentina Collagen Industry Revenue (Million) Forecast, by Application 2019 & 2032
- Table 45: Rest of South America Collagen Industry Revenue (Million) Forecast, by Application 2019 & 2032
- Table 46: Global Collagen Industry Revenue Million Forecast, by Form 2019 & 2032
- Table 47: Global Collagen Industry Revenue Million Forecast, by End User 2019 & 2032
- Table 48: Global Collagen Industry Revenue Million Forecast, by Country 2019 & 2032
- Table 49: United Kingdom Collagen Industry Revenue (Million) Forecast, by Application 2019 & 2032
- Table 50: Germany Collagen Industry Revenue (Million) Forecast, by Application 2019 & 2032
- Table 51: France Collagen Industry Revenue (Million) Forecast, by Application 2019 & 2032
- Table 52: Italy Collagen Industry Revenue (Million) Forecast, by Application 2019 & 2032
- Table 53: Spain Collagen Industry Revenue (Million) Forecast, by Application 2019 & 2032
- Table 54: Russia Collagen Industry Revenue (Million) Forecast, by Application 2019 & 2032
- Table 55: Benelux Collagen Industry Revenue (Million) Forecast, by Application 2019 & 2032
- Table 56: Nordics Collagen Industry Revenue (Million) Forecast, by Application 2019 & 2032
- Table 57: Rest of Europe Collagen Industry Revenue (Million) Forecast, by Application 2019 & 2032
- Table 58: Global Collagen Industry Revenue Million Forecast, by Form 2019 & 2032
- Table 59: Global Collagen Industry Revenue Million Forecast, by End User 2019 & 2032
- Table 60: Global Collagen Industry Revenue Million Forecast, by Country 2019 & 2032
- Table 61: Turkey Collagen Industry Revenue (Million) Forecast, by Application 2019 & 2032
- Table 62: Israel Collagen Industry Revenue (Million) Forecast, by Application 2019 & 2032
- Table 63: GCC Collagen Industry Revenue (Million) Forecast, by Application 2019 & 2032
- Table 64: North Africa Collagen Industry Revenue (Million) Forecast, by Application 2019 & 2032
- Table 65: South Africa Collagen Industry Revenue (Million) Forecast, by Application 2019 & 2032
- Table 66: Rest of Middle East & Africa Collagen Industry Revenue (Million) Forecast, by Application 2019 & 2032
- Table 67: Global Collagen Industry Revenue Million Forecast, by Form 2019 & 2032
- Table 68: Global Collagen Industry Revenue Million Forecast, by End User 2019 & 2032
- Table 69: Global Collagen Industry Revenue Million Forecast, by Country 2019 & 2032
- Table 70: China Collagen Industry Revenue (Million) Forecast, by Application 2019 & 2032
- Table 71: India Collagen Industry Revenue (Million) Forecast, by Application 2019 & 2032
- Table 72: Japan Collagen Industry Revenue (Million) Forecast, by Application 2019 & 2032
- Table 73: South Korea Collagen Industry Revenue (Million) Forecast, by Application 2019 & 2032
- Table 74: ASEAN Collagen Industry Revenue (Million) Forecast, by Application 2019 & 2032
- Table 75: Oceania Collagen Industry Revenue (Million) Forecast, by Application 2019 & 2032
- Table 76: Rest of Asia Pacific Collagen Industry Revenue (Million) Forecast, by Application 2019 & 2032
Frequently Asked Questions
1. What is the projected Compound Annual Growth Rate (CAGR) of the Collagen Industry?
The projected CAGR is approximately 6.13%.
2. Which companies are prominent players in the Collagen Industry?
Key companies in the market include Darling Ingredients Inc, Ewald-Gelatine GmbH, Nippi Inc, Nitta Gelatin Inc, Jellice Pioneer Private Limited, GELITA AG, ASAHI GELATINE INDUSTRIAL Co Ltd, Foodchem International Corporation, Italgelatine SpA.
3. What are the main segments of the Collagen Industry?
The market segments include Form, End User.
4. Can you provide details about the market size?
The market size is estimated to be USD XX Million as of 2022.
5. What are some drivers contributing to market growth?
Rising Health and Wellness Trends Drives the Market; Rising Demand for functional Food Drives the Market.
6. What are the notable trends driving market growth?
OTHER KEY INDUSTRY TRENDS COVERED IN THE REPORT.
7. Are there any restraints impacting market growth?
High Competition from Other Protein Sources.
8. Can you provide examples of recent developments in the market?
July 2022: Jellice Taiwan launched META Collagen to expand its product portfolio.February 2022: Nippi (Shanghai) Trading Co. Ltd (“Nippi Shanghai”), a subsidiary of Nippi Japan, signed a cooperation agreement with Infobird Co. Ltd, an AI-enabled customer engagement solutions provider, to increase its sales and grow its market share as a supplier of collagen raw materials to the Chinese market.March 2021: GELITA USA opened its new collagen peptide unit, a 30,000-square-foot production unit at the southeastern end of the complex in the Port Neal industrial area near Sioux City in Iowa. This expansion is majorly driven by the double-digit market growth of GELITA’s collagen peptides, especially in the health and beauty markets, with no sign of slowing down in the future.
9. What pricing options are available for accessing the report?
Pricing options include single-user, multi-user, and enterprise licenses priced at USD 3800, USD 4500, and USD 5800 respectively.
10. Is the market size provided in terms of value or volume?
The market size is provided in terms of value, measured in Million.
11. Are there any specific market keywords associated with the report?
Yes, the market keyword associated with the report is "Collagen Industry," which aids in identifying and referencing the specific market segment covered.
12. How do I determine which pricing option suits my needs best?
The pricing options vary based on user requirements and access needs. Individual users may opt for single-user licenses, while businesses requiring broader access may choose multi-user or enterprise licenses for cost-effective access to the report.
13. Are there any additional resources or data provided in the Collagen Industry report?
While the report offers comprehensive insights, it's advisable to review the specific contents or supplementary materials provided to ascertain if additional resources or data are available.
14. How can I stay updated on further developments or reports in the Collagen Industry?
To stay informed about further developments, trends, and reports in the Collagen Industry, consider subscribing to industry newsletters, following relevant companies and organizations, or regularly checking reputable industry news sources and publications.
Methodology
Step 1 - Identification of Relevant Samples Size from Population Database


Step 2 - Approaches for Defining Global Market Size (Value, Volume* & Price*)

Note*: In applicable scenarios
Step 3 - Data Sources
Primary Research
- Web Analytics
- Survey Reports
- Research Institute
- Latest Research Reports
- Opinion Leaders
Secondary Research
- Annual Reports
- White Paper
- Latest Press Release
- Industry Association
- Paid Database
- Investor Presentations

Step 4 - Data Triangulation
Involves using different sources of information in order to increase the validity of a study
These sources are likely to be stakeholders in a program - participants, other researchers, program staff, other community members, and so on.
Then we put all data in single framework & apply various statistical tools to find out the dynamic on the market.
During the analysis stage, feedback from the stakeholder groups would be compared to determine areas of agreement as well as areas of divergence


