Europe Non-Lethal Weapons Industry Report 2025: Growth Driven by Government Incentives and Partnerships

Europe Non-Lethal Weapons Industry by Type (Area Denial, Ammunition, Explosives, Gases and Sprays, Directed Energy Weapons, Electroshock Weapons), by Application (Law Enforcement, Military), by By Country (United Kingdom, France, Germany, Italy, Spain, Rest of Europe) Forecast 2025-2033

Jul 1 2025
Base Year: 2024

210 Pages
Main Logo

Europe Non-Lethal Weapons Industry Report 2025: Growth Driven by Government Incentives and Partnerships


Home
Industries
Aerospace & Defense
sponsor image
sponsor image
sponsor image
sponsor image

Tailored for you

  • In-depth Analysis Tailored to Specified Regions or Segments
  • Company Profiles Customized to User Preferences
  • Comprehensive Insights Focused on Specific Segments or Regions
  • Customized Evaluation of Competitive Landscape to Meet Your Needs
  • Tailored Customization to Address Other Specific Requirements
Ask for customization


Key Insights

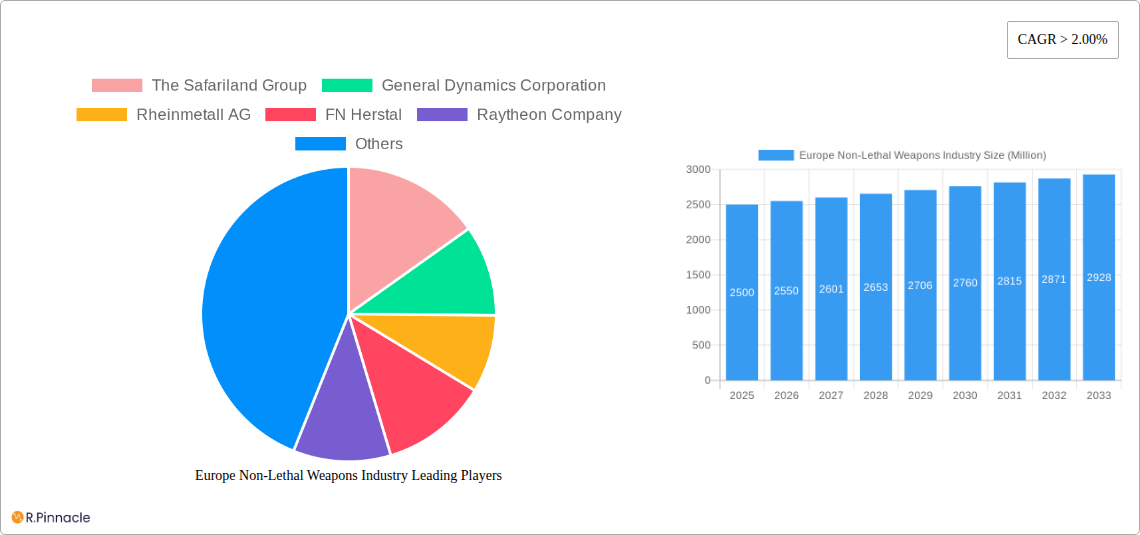
The European non-lethal weapons market, currently valued at approximately €2.5 billion in 2025, is projected to experience robust growth, exceeding a 2% Compound Annual Growth Rate (CAGR) through 2033. This expansion is driven by several key factors. Increasing concerns about civilian casualties in conflict zones and civil unrest are prompting law enforcement and military organizations to prioritize non-lethal solutions. Furthermore, technological advancements in areas like directed energy weapons and electroshock weapons are leading to more effective and precise tools, increasing adoption. The market is segmented by weapon type (area denial systems, ammunition, explosives, gases and sprays, directed energy weapons, electroshock weapons) and application (law enforcement, military). Germany, France, the United Kingdom, and Italy represent significant market shares within Europe, reflecting their substantial defense budgets and active law enforcement agencies. However, restraints include stringent regulations surrounding the development, deployment, and export of non-lethal weapons, as well as ethical concerns regarding their use. The market’s growth is also influenced by geopolitical instability and the increasing need for crowd control measures, especially in urban environments.

The competitive landscape comprises both established defense contractors like General Dynamics, Rheinmetall, and BAE Systems, and specialized manufacturers such as Safariland and Fiocchi Munizioni. These companies are actively involved in research and development, seeking to enhance the effectiveness and safety of their non-lethal weaponry. The market's future trajectory is likely to be shaped by ongoing technological innovations, evolving regulatory frameworks, and the evolving nature of modern conflicts and security challenges. The focus will increasingly shift towards developing less-lethal options that minimize harm while effectively achieving their intended purpose, balancing efficacy with ethical considerations.

Europe Non-Lethal Weapons Industry: Market Analysis Report 2019-2033

This comprehensive report provides a detailed analysis of the European non-lethal weapons market, offering actionable insights for industry professionals, investors, and policymakers. Covering the period 2019-2033, with a base year of 2025 and a forecast period of 2025-2033, this report meticulously examines market structure, dynamics, key players, and future growth prospects. The report values are expressed in Millions.

Europe Non-Lethal Weapons Industry Research Report - Market Size, Growth & Forecast

Europe Non-Lethal Weapons Industry Market Structure & Innovation Trends

This section analyzes the competitive landscape, focusing on market concentration, innovation drivers, regulatory frameworks, product substitutions, end-user demographics, and mergers & acquisitions (M&A) activities within the European non-lethal weapons market.

The European non-lethal weapons market exhibits a moderately concentrated structure, with several major players holding significant market share. The top five companies – The Safariland Group, General Dynamics Corporation, Rheinmetall AG, FN Herstal, and Raytheon Company – collectively account for an estimated xx% of the market in 2025. Market share fluctuations are influenced by factors such as successful product launches, M&A activity, and evolving regulatory landscapes. Innovation in non-lethal technologies, driven by the need for improved effectiveness and reduced collateral damage, is a key driver of market growth. Stringent regulations concerning the development, production, and deployment of non-lethal weapons are in place across various European countries, impacting market dynamics. The market also witnesses some level of substitution, with advancements in less-lethal technologies continually improving their efficacy and replacing older counterparts. End-user demographics (law enforcement, military) play a significant role in shaping market demand. M&A activity in the sector has been relatively moderate, with deal values averaging xx Million in the historical period (2019-2024), primarily driven by efforts to consolidate market share and expand product portfolios.

  • Market Concentration: Moderately concentrated, top 5 players hold xx% market share (2025).
  • Innovation Drivers: Improved effectiveness, reduced collateral damage.
  • Regulatory Frameworks: Stringent regulations across European countries.
  • Product Substitutes: Advancements in less-lethal technologies.
  • M&A Activity: Average deal value xx Million (2019-2024).
Europe Non-Lethal Weapons Industry Growth

Europe Non-Lethal Weapons Industry Market Dynamics & Trends

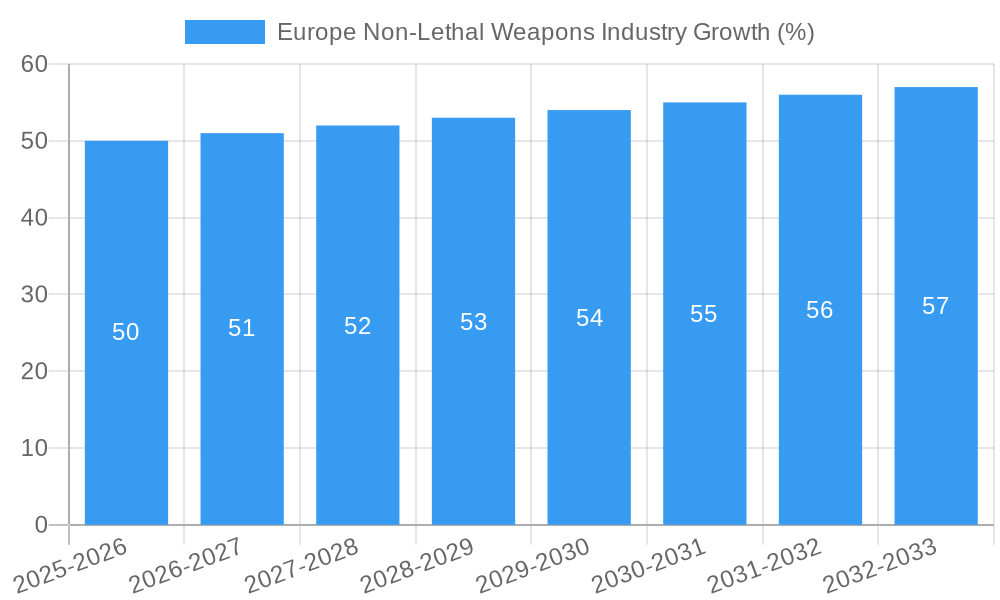
This section explores the key drivers, technological disruptions, consumer preferences, and competitive dynamics that shape the European non-lethal weapons market. The market is projected to experience a CAGR of xx% during the forecast period (2025-2033), driven by increasing demand from law enforcement and military agencies across Europe. Technological advancements such as the development of more precise and effective less-lethal weapons are key disruptors, leading to higher market penetration. Consumer preferences (i.e., law enforcement and military agencies) are focused on improved accuracy, reduced risk of injury, and enhanced operational capabilities. Competitive dynamics involve ongoing innovation, strategic partnerships, and M&A activity among major players. Market penetration rates for specific technologies vary depending on adoption rates by different end-users.

Europe Non-Lethal Weapons Industry Growth

Dominant Regions & Segments in Europe Non-Lethal Weapons Industry

This section identifies the leading regions and segments within the European non-lethal weapons market.

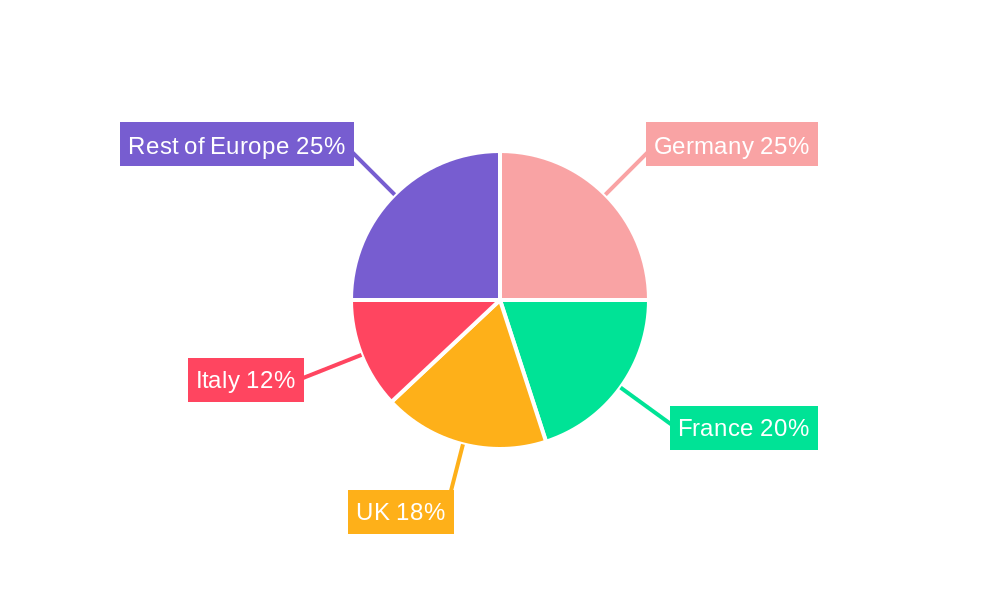
Leading Region: Western Europe (Germany, France, UK) dominates due to higher defense spending and technological advancements.

Dominant Segments:

  • Type: Ammunition and gases and sprays currently hold the largest market share due to widespread adoption and relatively lower cost. However, directed energy weapons are experiencing rapid growth due to technological advancements.
  • Application: Law enforcement represents the largest segment, driven by increasing demand for crowd control and riot management solutions. The military sector's demand is also significant, focused on specialized non-lethal weapons for specific operations.

Key Drivers for Dominant Regions/Segments:

  • Economic Policies: Defense spending budgets directly impact demand.
  • Infrastructure: Advanced R&D infrastructure supports innovation and manufacturing.

Europe Non-Lethal Weapons Industry Product Innovations

Recent product innovations include advancements in directed energy weapons (e.g., improved accuracy, range), enhanced ammunition with reduced injury potential, and new formulations for gases and sprays that are more effective and less harmful. These innovations are designed to meet the growing demand for less-lethal options with increased effectiveness and reduced collateral damage, aligning with evolving consumer preferences and market needs.

Report Scope & Segmentation Analysis

The report provides a comprehensive segmentation analysis of the European non-lethal weapons market.

By Type: Area Denial, Ammunition, Explosives, Gases and Sprays, Directed Energy Weapons, Electroshock Weapons. Each segment's growth projection varies, with Ammunition and Gases and Sprays projected for xx Million by 2033, while Directed Energy Weapons show the fastest growth rate.

By Application: Law Enforcement, Military. The Law Enforcement segment dominates, expected to reach xx Million by 2033.

Competitive dynamics within each segment vary depending on the level of innovation, technological advancement, and presence of major players.

Key Drivers of Europe Non-Lethal Weapons Industry Growth

The growth of the European non-lethal weapons market is driven by several factors, including increasing demand for effective crowd control and riot management solutions, rising defense budgets, technological advancements resulting in more precise and less harmful weapons, and a growing need for non-lethal solutions in military and peacekeeping operations. Regulatory frameworks, while stringent, also push innovation towards safer and more effective technologies.

Challenges in the Europe Non-Lethal Weapons Industry Sector

The European non-lethal weapons market faces challenges including stringent regulatory approvals which can delay product launches, supply chain disruptions impacting manufacturing costs and availability, and intense competition among established and emerging players. These factors can constrain market growth and profitability. Strict regulations also limit the types of non-lethal weapons that can be deployed, affecting market penetration for certain technologies.

Emerging Opportunities in Europe Non-Lethal Weapons Industry

Emerging opportunities exist in the development of advanced directed energy weapons, smart ammunition with enhanced targeting capabilities, and the integration of artificial intelligence in less-lethal systems. Expansion into new markets such as border security and civilian applications also presents growth potential. Developing less-lethal technologies for specific scenarios, like drone countermeasures, offers further opportunities.

Leading Players in the Europe Non-Lethal Weapons Industry Market

  • The Safariland Group
  • General Dynamics Corporation
  • Rheinmetall AG
  • FN Herstal
  • Raytheon Company
  • RUAG Group
  • Fiocchi Munizioni SpA
  • BAE Systems PLC
  • AARDVAR

Key Developments in Europe Non-Lethal Weapons Industry Industry

  • 2022 Q4: Rheinmetall AG announced a significant investment in R&D for directed energy weapons.
  • 2023 Q1: FN Herstal launched a new line of less-lethal ammunition with improved accuracy.
  • 2023 Q3: A merger between two smaller non-lethal weapons manufacturers resulted in a strengthened market presence. (Specific details not available, using placeholder)

Future Outlook for Europe Non-Lethal Weapons Industry Market

The future of the European non-lethal weapons market is positive, driven by continuous technological innovation, rising demand from both military and law enforcement sectors, and the increasing need for effective and safe crowd control and riot management solutions. Strategic partnerships and continued investment in R&D will further stimulate growth and expansion of the market in the coming years. The focus on developing more precise and less harmful weapons will continue to drive market expansion, offering significant opportunities for industry players.

Europe Non-Lethal Weapons Industry Segmentation

  • 1. Type
    • 1.1. Area Denial
    • 1.2. Ammunition
    • 1.3. Explosives
    • 1.4. Gases and Sprays
    • 1.5. Directed Energy Weapons
    • 1.6. Electroshock Weapons
  • 2. Application
    • 2.1. Law Enforcement
    • 2.2. Military

Europe Non-Lethal Weapons Industry Segmentation By Geography

  • 1. By Country
    • 1.1. United Kingdom
    • 1.2. France
    • 1.3. Germany
    • 1.4. Italy
    • 1.5. Spain
    • 1.6. Rest of Europe
Europe Non-Lethal Weapons Industry Regional Share


Europe Non-Lethal Weapons Industry REPORT HIGHLIGHTS

AspectsDetails
Study Period 2019-2033
Base Year 2024
Estimated Year 2025
Forecast Period2025-2033
Historical Period2019-2024
Growth RateCAGR of > 2.00% from 2019-2033
Segmentation
    • By Type
      • Area Denial
      • Ammunition
      • Explosives
      • Gases and Sprays
      • Directed Energy Weapons
      • Electroshock Weapons
    • By Application
      • Law Enforcement
      • Military
  • By Geography
    • By Country
      • United Kingdom
      • France
      • Germany
      • Italy
      • Spain
      • Rest of Europe


Table of Contents

  1. 1. Introduction
    • 1.1. Research Scope
    • 1.2. Market Segmentation
    • 1.3. Research Methodology
    • 1.4. Definitions and Assumptions
  2. 2. Executive Summary
    • 2.1. Introduction
  3. 3. Market Dynamics
    • 3.1. Introduction
      • 3.2. Market Drivers
      • 3.3. Market Restrains
      • 3.4. Market Trends
        • 3.4.1. The Law Enforcement Segment is Expected to Experience the Highest Growth During the Forecast Period
  4. 4. Market Factor Analysis
    • 4.1. Porters Five Forces
    • 4.2. Supply/Value Chain
    • 4.3. PESTEL analysis
    • 4.4. Market Entropy
    • 4.5. Patent/Trademark Analysis
  5. 5. Europe Non-Lethal Weapons Industry Analysis, Insights and Forecast, 2019-2031
    • 5.1. Market Analysis, Insights and Forecast - by Type
      • 5.1.1. Area Denial
      • 5.1.2. Ammunition
      • 5.1.3. Explosives
      • 5.1.4. Gases and Sprays
      • 5.1.5. Directed Energy Weapons
      • 5.1.6. Electroshock Weapons
    • 5.2. Market Analysis, Insights and Forecast - by Application
      • 5.2.1. Law Enforcement
      • 5.2.2. Military
    • 5.3. Market Analysis, Insights and Forecast - by Region
      • 5.3.1. By Country
  6. 6. Germany Europe Non-Lethal Weapons Industry Analysis, Insights and Forecast, 2019-2031
    • 7. France Europe Non-Lethal Weapons Industry Analysis, Insights and Forecast, 2019-2031
      • 8. Italy Europe Non-Lethal Weapons Industry Analysis, Insights and Forecast, 2019-2031
        • 9. United Kingdom Europe Non-Lethal Weapons Industry Analysis, Insights and Forecast, 2019-2031
          • 10. Netherlands Europe Non-Lethal Weapons Industry Analysis, Insights and Forecast, 2019-2031
            • 11. Sweden Europe Non-Lethal Weapons Industry Analysis, Insights and Forecast, 2019-2031
              • 12. Rest of Europe Europe Non-Lethal Weapons Industry Analysis, Insights and Forecast, 2019-2031
                • 13. Competitive Analysis
                  • 13.1. Market Share Analysis 2024
                    • 13.2. Company Profiles
                      • 13.2.1 The Safariland Group
                        • 13.2.1.1. Overview
                        • 13.2.1.2. Products
                        • 13.2.1.3. SWOT Analysis
                        • 13.2.1.4. Recent Developments
                        • 13.2.1.5. Financials (Based on Availability)
                      • 13.2.2 General Dynamics Corporation
                        • 13.2.2.1. Overview
                        • 13.2.2.2. Products
                        • 13.2.2.3. SWOT Analysis
                        • 13.2.2.4. Recent Developments
                        • 13.2.2.5. Financials (Based on Availability)
                      • 13.2.3 Rheinmetall AG
                        • 13.2.3.1. Overview
                        • 13.2.3.2. Products
                        • 13.2.3.3. SWOT Analysis
                        • 13.2.3.4. Recent Developments
                        • 13.2.3.5. Financials (Based on Availability)
                      • 13.2.4 FN Herstal
                        • 13.2.4.1. Overview
                        • 13.2.4.2. Products
                        • 13.2.4.3. SWOT Analysis
                        • 13.2.4.4. Recent Developments
                        • 13.2.4.5. Financials (Based on Availability)
                      • 13.2.5 Raytheon Company
                        • 13.2.5.1. Overview
                        • 13.2.5.2. Products
                        • 13.2.5.3. SWOT Analysis
                        • 13.2.5.4. Recent Developments
                        • 13.2.5.5. Financials (Based on Availability)
                      • 13.2.6 RUAG Group
                        • 13.2.6.1. Overview
                        • 13.2.6.2. Products
                        • 13.2.6.3. SWOT Analysis
                        • 13.2.6.4. Recent Developments
                        • 13.2.6.5. Financials (Based on Availability)
                      • 13.2.7 Fiocchi Munizioni SpA
                        • 13.2.7.1. Overview
                        • 13.2.7.2. Products
                        • 13.2.7.3. SWOT Analysis
                        • 13.2.7.4. Recent Developments
                        • 13.2.7.5. Financials (Based on Availability)
                      • 13.2.8 BAE Systems PLC
                        • 13.2.8.1. Overview
                        • 13.2.8.2. Products
                        • 13.2.8.3. SWOT Analysis
                        • 13.2.8.4. Recent Developments
                        • 13.2.8.5. Financials (Based on Availability)
                      • 13.2.9 AARDVAR
                        • 13.2.9.1. Overview
                        • 13.2.9.2. Products
                        • 13.2.9.3. SWOT Analysis
                        • 13.2.9.4. Recent Developments
                        • 13.2.9.5. Financials (Based on Availability)

                List of Figures

                1. Figure 1: Europe Non-Lethal Weapons Industry Revenue Breakdown (Million, %) by Product 2024 & 2032
                2. Figure 2: Europe Non-Lethal Weapons Industry Share (%) by Company 2024

                List of Tables

                1. Table 1: Europe Non-Lethal Weapons Industry Revenue Million Forecast, by Region 2019 & 2032
                2. Table 2: Europe Non-Lethal Weapons Industry Revenue Million Forecast, by Type 2019 & 2032
                3. Table 3: Europe Non-Lethal Weapons Industry Revenue Million Forecast, by Application 2019 & 2032
                4. Table 4: Europe Non-Lethal Weapons Industry Revenue Million Forecast, by Region 2019 & 2032
                5. Table 5: Europe Non-Lethal Weapons Industry Revenue Million Forecast, by Country 2019 & 2032
                6. Table 6: Germany Europe Non-Lethal Weapons Industry Revenue (Million) Forecast, by Application 2019 & 2032
                7. Table 7: France Europe Non-Lethal Weapons Industry Revenue (Million) Forecast, by Application 2019 & 2032
                8. Table 8: Italy Europe Non-Lethal Weapons Industry Revenue (Million) Forecast, by Application 2019 & 2032
                9. Table 9: United Kingdom Europe Non-Lethal Weapons Industry Revenue (Million) Forecast, by Application 2019 & 2032
                10. Table 10: Netherlands Europe Non-Lethal Weapons Industry Revenue (Million) Forecast, by Application 2019 & 2032
                11. Table 11: Sweden Europe Non-Lethal Weapons Industry Revenue (Million) Forecast, by Application 2019 & 2032
                12. Table 12: Rest of Europe Europe Non-Lethal Weapons Industry Revenue (Million) Forecast, by Application 2019 & 2032
                13. Table 13: Europe Non-Lethal Weapons Industry Revenue Million Forecast, by Type 2019 & 2032
                14. Table 14: Europe Non-Lethal Weapons Industry Revenue Million Forecast, by Application 2019 & 2032
                15. Table 15: Europe Non-Lethal Weapons Industry Revenue Million Forecast, by Country 2019 & 2032
                16. Table 16: United Kingdom Europe Non-Lethal Weapons Industry Revenue (Million) Forecast, by Application 2019 & 2032
                17. Table 17: France Europe Non-Lethal Weapons Industry Revenue (Million) Forecast, by Application 2019 & 2032
                18. Table 18: Germany Europe Non-Lethal Weapons Industry Revenue (Million) Forecast, by Application 2019 & 2032
                19. Table 19: Italy Europe Non-Lethal Weapons Industry Revenue (Million) Forecast, by Application 2019 & 2032
                20. Table 20: Spain Europe Non-Lethal Weapons Industry Revenue (Million) Forecast, by Application 2019 & 2032
                21. Table 21: Rest of Europe Europe Non-Lethal Weapons Industry Revenue (Million) Forecast, by Application 2019 & 2032


                Frequently Asked Questions

                1. What is the projected Compound Annual Growth Rate (CAGR) of the Europe Non-Lethal Weapons Industry?

                The projected CAGR is approximately > 2.00%.

                2. Which companies are prominent players in the Europe Non-Lethal Weapons Industry?

                Key companies in the market include The Safariland Group, General Dynamics Corporation, Rheinmetall AG, FN Herstal, Raytheon Company, RUAG Group, Fiocchi Munizioni SpA, BAE Systems PLC, AARDVAR.

                3. What are the main segments of the Europe Non-Lethal Weapons Industry?

                The market segments include Type, Application.

                4. Can you provide details about the market size?

                The market size is estimated to be USD XX Million as of 2022.

                5. What are some drivers contributing to market growth?

                N/A

                6. What are the notable trends driving market growth?

                The Law Enforcement Segment is Expected to Experience the Highest Growth During the Forecast Period.

                7. Are there any restraints impacting market growth?

                N/A

                8. Can you provide examples of recent developments in the market?

                N/A

                9. What pricing options are available for accessing the report?

                Pricing options include single-user, multi-user, and enterprise licenses priced at USD 4750, USD 4950, and USD 6800 respectively.

                10. Is the market size provided in terms of value or volume?

                The market size is provided in terms of value, measured in Million.

                11. Are there any specific market keywords associated with the report?

                Yes, the market keyword associated with the report is "Europe Non-Lethal Weapons Industry," which aids in identifying and referencing the specific market segment covered.

                12. How do I determine which pricing option suits my needs best?

                The pricing options vary based on user requirements and access needs. Individual users may opt for single-user licenses, while businesses requiring broader access may choose multi-user or enterprise licenses for cost-effective access to the report.

                13. Are there any additional resources or data provided in the Europe Non-Lethal Weapons Industry report?

                While the report offers comprehensive insights, it's advisable to review the specific contents or supplementary materials provided to ascertain if additional resources or data are available.

                14. How can I stay updated on further developments or reports in the Europe Non-Lethal Weapons Industry?

                To stay informed about further developments, trends, and reports in the Europe Non-Lethal Weapons Industry, consider subscribing to industry newsletters, following relevant companies and organizations, or regularly checking reputable industry news sources and publications.


                Methodology

                Step 1 - Identification of Relevant Samples Size from Population Database

                Step Chart
                Bar Chart
                Method Chart

                Step 2 - Approaches for Defining Global Market Size (Value, Volume* & Price*)

                Approach Chart
                Top-down and bottom-up approaches are used to validate the global market size and estimate the market size for manufactures, regional segments, product, and application.

                Note*: In applicable scenarios

                Step 3 - Data Sources

                Primary Research

                • Web Analytics
                • Survey Reports
                • Research Institute
                • Latest Research Reports
                • Opinion Leaders

                Secondary Research

                • Annual Reports
                • White Paper
                • Latest Press Release
                • Industry Association
                • Paid Database
                • Investor Presentations
                Analyst Chart

                Step 4 - Data Triangulation

                Involves using different sources of information in order to increase the validity of a study

                These sources are likely to be stakeholders in a program - participants, other researchers, program staff, other community members, and so on.

                Then we put all data in single framework & apply various statistical tools to find out the dynamic on the market.

                During the analysis stage, feedback from the stakeholder groups would be compared to determine areas of agreement as well as areas of divergence

                Additionally, after gathering mixed and scattered data from a wide range of sources, data is triangulated and correlated to come up with estimated figures which are further validated through primary mediums or industry experts, opinion leaders.

                About Report Pinnacle

                Report Pinnacle provides top-tier market research, industry intelligence, and actionable insights for finance, technology, healthcare, and consumer sectors. Our reports empower you to make informed decisions and achieve business success.

                Our expert team combines primary research, data analytics, and industry knowledge to deliver insights you can trust. We offer syndicated reports, custom research, and consulting services tailored to your unique business needs.

                At Report Pinnacle, we are committed to quality, transparency, and client satisfaction. Every report is rigorously validated to ensure accuracy and relevance. Our global perspective and local expertise help you understand both broad trends and detailed market shifts.

                Stay ahead with Report Pinnacle. Subscribe to our newsletter for the latest insights and research highlights, and follow us on social media for real-time updates.

                Report Pinnacle – Your Partner for Reaching the Top in Market Intelligence.

                artwork spiralartwork spiralRelated Reports
                artwork underline

                Electric Propulsion Systems Industry Strategic Insights for 2025 and Forecasts to 2033: Market Trends

                The Electric Propulsion Systems market is booming, projected to reach $10.94B in 2025, with a 6.09% CAGR. Explore market trends, key players (Airbus, Safran, Northrop Grumman), and regional growth in this comprehensive analysis of hybrid, full-electric systems across airborne, terrestrial, marine, and space applications.

                July 2025
                Base Year: 2024
                No Of Pages: 234
                Price: $4750

                Asia Aircraft MRO Market in Emerging Markets: Analysis and Projections 2025-2033

                The Asia Aircraft MRO Market is booming, projected to reach \$27 billion by 2033 with a 5.74% CAGR. Discover key drivers, trends, and major players shaping this dynamic sector in China, India, Japan, and beyond. Explore market segmentation and growth opportunities in commercial, military, and general aviation MRO services.

                July 2025
                Base Year: 2024
                No Of Pages: 234
                Price: $4750

                Strategic Insights for Military Electro-optical and Infrared Systems Market Market Expansion

                The Military Electro-optical and Infrared (EO/IR) Systems market is booming, projected to reach [estimated 2033 value based on CAGR] by 2033. Driven by geopolitical tensions and technological advancements, this report analyzes market size, growth, key players (L3Harris, Raytheon, Thales), and regional trends. Discover insights into the future of EO/IR systems in defense.

                July 2025
                Base Year: 2024
                No Of Pages: 234
                Price: $4750

                Analyzing Drone Camera Market: Opportunities and Growth Patterns 2025-2033

                The drone camera market is booming, projected to reach \$10.96 billion in 2025, with a CAGR of 18.28% through 2033. Explore market drivers, trends, restraints, and key players in this explosive sector. Discover insights into regional market share and future growth projections for high-resolution drone cameras.

                July 2025
                Base Year: 2024
                No Of Pages: 234
                Price: $4750

                Commercial Aircraft Windows and Windshields Industry and Emerging Technologies: Growth Insights 2025-2033

                Discover the booming commercial aircraft windows and windshields market! This in-depth analysis reveals a CAGR exceeding 3%, driven by surging air travel and technological advancements. Explore key players, regional trends, and future growth projections for 2025-2033.

                July 2025
                Base Year: 2024
                No Of Pages: 234
                Price: $4750

                North America Commercial Aviation Market Industry’s Growth Dynamics and Insights

                Discover the North American commercial aviation market's growth trajectory and key players. This in-depth analysis reveals market size, CAGR, and regional breakdowns, highlighting trends and challenges for passenger and freighter aircraft through 2033. Explore market segmentation, competitive landscapes, and future projections.

                July 2025
                Base Year: 2024
                No Of Pages: 197
                Price: $3800

                Future Prospects for Asia-Pacific Commercial Aircraft Cabin Seating Market Growth

                The Asia-Pacific commercial aircraft cabin seating market is booming, projected to reach $XX million by 2033 with a 7.32% CAGR. Driven by rising air travel and economic growth in key nations like China and India, this report analyzes market trends, key players (Safran, Recaro, Expliseat), and regional segmentation. Discover growth opportunities and challenges in this dynamic industry.

                July 2025
                Base Year: 2024
                No Of Pages: 197
                Price: $3800

                Aircraft Health Monitoring Systems Industry 2025-2033 Market Analysis: Trends, Dynamics, and Growth Opportunities

                Discover the booming Aircraft Health Monitoring Systems market! This in-depth analysis reveals a CAGR of 6% through 2033, driven by predictive maintenance, safety regulations, and technological advancements. Explore key players, regional trends, and future growth projections for this dynamic sector.

                July 2025
                Base Year: 2024
                No Of Pages: 234
                Price: $4750

                Aircraft Exhaust Systems Market Industry’s Future Growth Prospects

                The Aircraft Exhaust Systems Market is booming, projected to reach \$1.78 Billion by 2033 with a 6.49% CAGR. Driven by rising air travel and stringent emission regulations, this report analyzes market trends, key players (Safran, Triumph Group, GKN Aerospace), and regional growth (North America, Europe, Asia-Pacific). Discover key insights and future projections for this expanding sector.

                July 2025
                Base Year: 2024
                No Of Pages: 234
                Price: $4750

                Active Protection Systems Market Market’s Growth Catalysts

                The Active Protection Systems (APS) market is booming, projected to reach $7 billion by 2033 with a 6.06% CAGR. This in-depth analysis explores market drivers, trends, restraints, key players (Thales, General Dynamics, Rheinmetall), and regional breakdowns (North America, Europe, Asia-Pacific). Discover the future of military vehicle protection.

                July 2025
                Base Year: 2024
                No Of Pages: 234
                Price: $4750

                Consumer-Centric Trends in Middle-East and Africa Aircraft MRO Industry Industry

                The Middle East & Africa Aircraft MRO market is booming, with a CAGR exceeding 4% through 2033. Driven by rising air travel and fleet expansion, this report analyzes market size, key players (Ethiopian Airlines, Lufthansa Technik AG, etc.), regional trends, and growth opportunities in commercial, military, and general aviation sectors. Discover the challenges and potential within this dynamic industry.

                July 2025
                Base Year: 2024
                No Of Pages: 234
                Price: $4750

                Southeast Asia Commercial Aircraft MRO Market Future-Proof Strategies: Market Trends 2025-2033

                The Southeast Asia Commercial Aircraft MRO market is booming, projected to reach $3.77 billion by 2025, with a CAGR of 11.47%. Discover key drivers, trends, and challenges shaping this dynamic industry, including insights into leading companies and regional market share. Explore growth opportunities in airframe, engine, and component MRO across narrowbody and widebody aircraft.

                July 2025
                Base Year: 2024
                No Of Pages: 234
                Price: $4750

                Turboprop Engine Market Trends and Forecast 2025-2033

                The turboprop engine market is booming, projected to reach \$31.89 billion by 2033 with a CAGR of 3.71%. Explore key drivers, trends, and regional market shares for this high-growth sector, dominated by Honeywell, Safran, and others. Discover the impact of technological advancements and increasing demand for fuel-efficient aircraft.

                July 2025
                Base Year: 2024
                No Of Pages: 234
                Price: $4750

                Unveiling Low Cost Carrier Market Growth Patterns: CAGR Analysis and Forecasts 2025-2033

                Discover the booming low-cost carrier market! Explore its 10% CAGR, key drivers, regional trends, leading companies like Ryanair & Southwest, and future projections to 2033. Get insights into market segmentation, challenges, and opportunities in this dynamic industry.

                July 2025
                Base Year: 2024
                No Of Pages: 234
                Price: $4750

                Commercial Aircraft Floor Panels Market 2025-2033 Analysis: Trends, Competitor Dynamics, and Growth Opportunities

                The global commercial aircraft floor panels market is booming, projected to reach \$392.64 million by 2025 and grow at a CAGR of 4.67% until 2033. Driven by increasing air travel and demand for lightweight, durable materials, key players like Airbus and Boeing are shaping this lucrative sector. Explore market trends, segment analysis, and regional insights.

                July 2025
                Base Year: 2024
                No Of Pages: 234
                Price: $4750

                Electronically Scanned Array Radar Market 2025-2033 Analysis: Trends, Competitor Dynamics, and Growth Opportunities

                The Electronically Scanned Array (ESA) Radar Market is booming, with a CAGR of 6.45%! Discover key trends, leading companies like Raytheon and Thales, and regional market insights in this comprehensive analysis projecting growth to 2033. Learn about active vs. passive ESA, land, air, and sea applications, and the impact of AI and autonomous systems.

                July 2025
                Base Year: 2024
                No Of Pages: 234
                Price: $4750

                Decoding Aircraft Engine Blades Market’s Market Size Potential by 2033

                Discover the booming Aircraft Engine Blades market, projected to surpass $XX million by 2033 with a CAGR exceeding 5.5%! This in-depth analysis explores market drivers, trends, restraints, and key players like Raytheon, GE, and Safran, covering segments like blade type, application, and materials. Get insights into regional market shares and future growth predictions.

                July 2025
                Base Year: 2024
                No Of Pages: 234
                Price: $4750

                Flight Data Monitoring Industry 2025-2033 Market Analysis: Trends, Dynamics, and Growth Opportunities

                The Flight Data Monitoring (FDM) market is booming, exceeding a $1.5 Billion valuation in 2025 and projected for significant growth through 2033. Discover key drivers, trends, and regional market shares in this in-depth analysis covering major players and technological advancements in flight safety and operational efficiency.

                July 2025
                Base Year: 2024
                No Of Pages: 234
                Price: $4750

                Military Transport Aircraft Market Market Expansion: Growth Outlook 2025-2033

                The Military Transport Aircraft Market is booming, projected to reach $43.56 billion by 2033 with a 7.09% CAGR. Discover key drivers, trends, and regional insights, including major players like Boeing and Lockheed Martin. Analyze market segmentation and future growth projections in this comprehensive report.

                July 2025
                Base Year: 2024
                No Of Pages: 234
                Price: $4750

                Analyzing Competitor Moves: Eastern Europe Defense Market Growth Outlook 2025-2033

                The Eastern European defense market is booming, projected to reach [estimated 2033 value] by 2033, driven by geopolitical tensions and modernization efforts. Discover key trends, growth drivers, and leading companies shaping this dynamic sector.

                July 2025
                Base Year: 2024
                No Of Pages: 210
                Price: $4750
                • Home
                • About Us
                • Industries
                  • Aerospace & Defense
                  • Agriculture
                  • Animal Nutrition & Wellness
                  • Automotive
                  • Chemicals & Materials
                  • Consumer Goods and Services
                  • Energy & Power
                  • Financial Services and Investment Intelligence
                  • Food & Beverage
                  • Home and Property Improvement
                  • Hospitality and Tourism
                  • Logistics
                  • Manufacturing Products and Services
                  • Packaging
                  • Professional and Commercial Services
                  • Real Estate and Construction
                  • Retail
                  • Technology, Media and Telecom
                  • Healthcare
                • Services
                • Contact
                Main Logo
                • Home
                • About Us
                • Industries
                  • Aerospace & Defense
                  • Agriculture
                  • Animal Nutrition & Wellness
                  • Automotive
                  • Chemicals & Materials
                  • Consumer Goods and Services
                  • Energy & Power
                  • Financial Services and Investment Intelligence
                  • Food & Beverage
                  • Home and Property Improvement
                  • Hospitality and Tourism
                  • Logistics
                  • Manufacturing Products and Services
                  • Packaging
                  • Professional and Commercial Services
                  • Real Estate and Construction
                  • Retail
                  • Technology, Media and Telecom
                  • Healthcare
                • Services
                • Contact
                +17162654855
                [email protected]

                +17162654855

                [email protected]

                Business Address

                Head Office

                Office no. A 5010, fifth floor, Solitaire Business Hub, Near Phoenix mall, Pune, Maharashtra 411014

                Contact Information

                Craig Francis

                Business Development Head

                +17162654855

                [email protected]

                Connect With Us

                Secure Payment Partners

                payment image
                RetailLogisticsPackagingAutomotiveHealthcareAgricultureEnergy & PowerFood & BeverageAerospace & DefenseChemicals & MaterialsHospitality and TourismAnimal Nutrition & WellnessConsumer Goods and ServicesReal Estate and ConstructionHome and Property ImprovementTechnology, Media and TelecomManufacturing Products and ServicesFinancial Services and Investment Intelligence

                © 2025 All rights reserved


                Privacy Policy
                Terms and Conditions
                FAQ