
Key Insights
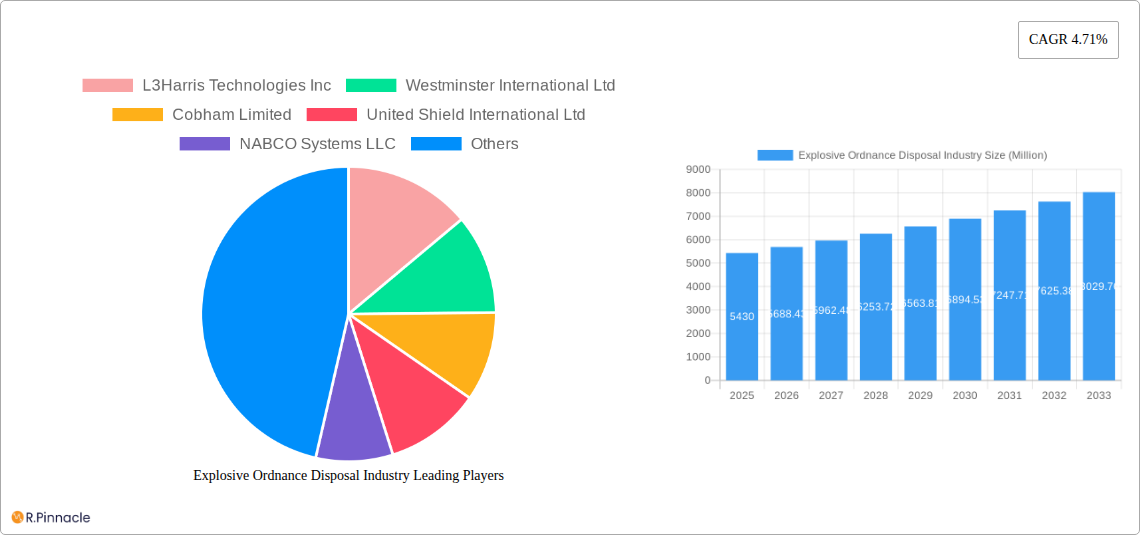
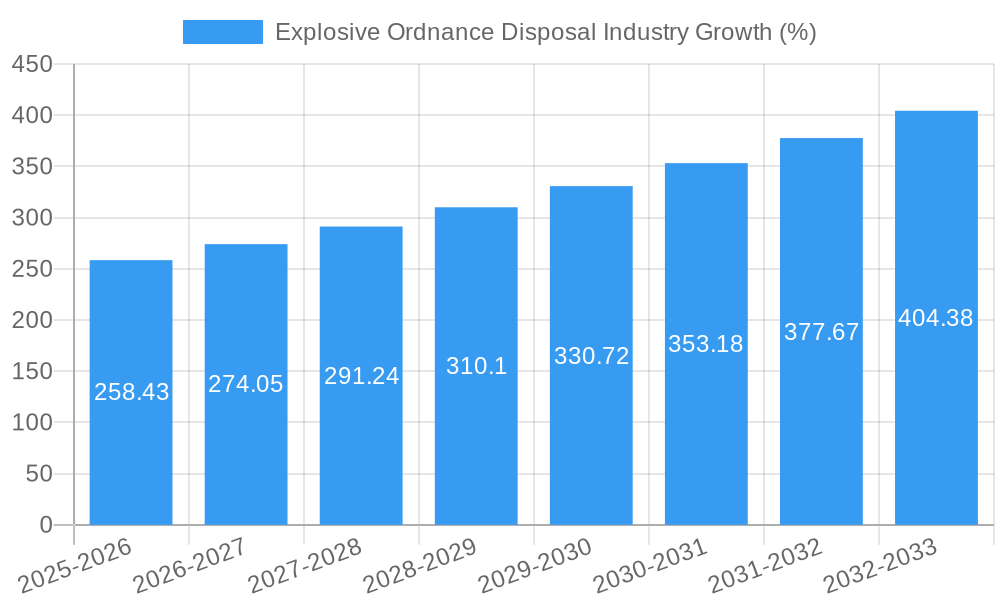
The Explosive Ordnance Disposal (EOD) industry, valued at $5.43 billion in 2025, is poised for substantial growth, projected to expand at a Compound Annual Growth Rate (CAGR) of 4.71% from 2025 to 2033. This growth is driven by several key factors. Increased global geopolitical instability and the persistent threat of terrorism are leading to heightened demand for advanced EOD equipment and services. Technological advancements, such as the development of more sophisticated robots, detectors, and protective suits, are enhancing EOD capabilities and driving market expansion. Furthermore, rising government investments in defense and security infrastructure, particularly in North America and Asia-Pacific regions experiencing heightened security concerns, are significantly contributing to market growth. The increasing adoption of unmanned aerial vehicles (UAVs) for reconnaissance and disposal tasks represents a notable emerging trend, adding another layer of complexity and opportunity within the sector.
However, the market faces certain restraints. The high cost of advanced EOD technologies can limit adoption, particularly in resource-constrained regions. The need for highly skilled personnel to operate and maintain complex EOD systems also poses a challenge. Regulatory hurdles and stringent safety standards governing the development and deployment of EOD equipment can further impede market growth. Despite these challenges, the long-term outlook for the EOD industry remains positive, driven by sustained global demand for enhanced security measures and continuous technological innovation. Market segmentation reveals significant potential within the EOD suits and blankets, EOD robots, and explosive detectors categories, with the military and law enforcement sectors being the primary end-users. The competitive landscape includes established players like L3Harris Technologies Inc, Northrop Grumman Corporation, and Teledyne FLIR LLC, alongside specialized companies such as Westminster International Ltd and NABCO Systems LLC, suggesting a dynamic mix of innovation and established expertise.
Explosive Ordnance Disposal (EOD) Industry Market Report: 2019-2033
This comprehensive report provides an in-depth analysis of the Explosive Ordnance Disposal (EOD) industry, projecting a market value exceeding $XX Million by 2033. The study covers the period 2019-2033, with a base year of 2025 and a forecast period of 2025-2033. This report is essential for industry professionals, investors, and policymakers seeking actionable insights into this critical sector.
Explosive Ordnance Disposal Industry Market Structure & Innovation Trends
The EOD industry is characterized by a moderately concentrated market structure, with key players like L3Harris Technologies Inc, Northrop Grumman Corporation, and Teledyne FLIR LLC holding significant market share. However, smaller, specialized companies like Westminster International Ltd and United Shield International Ltd also contribute significantly to innovation and niche market segments. The estimated market share for L3Harris Technologies Inc in 2025 is xx%. Mergers and acquisitions (M&A) activity has been notable, with deal values exceeding $XX Million in the last five years, primarily driven by the need to expand technological capabilities and geographic reach. Innovation is fueled by the constant evolution of explosive threats and the demand for more sophisticated detection and disposal technologies. Regulatory frameworks, particularly concerning export controls and safety standards, significantly influence market dynamics. Product substitutes, such as advanced robotic systems, are increasingly impacting the demand for traditional EOD tools. The end-user demographic is primarily comprised of military and law enforcement agencies globally, with evolving needs based on regional conflict dynamics and counter-terrorism strategies.
Explosive Ordnance Disposal Industry Market Dynamics & Trends
The EOD market is experiencing robust growth, projected at a Compound Annual Growth Rate (CAGR) of xx% during the forecast period (2025-2033). Key growth drivers include increasing global conflict and terrorism, the rising demand for advanced EOD technologies in civilian applications (e.g., bomb threat response), and substantial government investments in defense modernization. Technological disruptions, such as the development of AI-powered robots and improved explosive detection sensors, are reshaping the competitive landscape. Consumer preferences are shifting towards lighter, more agile, and user-friendly EOD equipment, driving the adoption of advanced materials and miniaturization techniques. Competitive dynamics are characterized by intense R&D investments, strategic partnerships, and a focus on delivering highly specialized solutions to cater to diverse end-user needs. Market penetration of AI-powered EOD robots is estimated at xx% in 2025 and projected to reach xx% by 2033.
Dominant Regions & Segments in Explosive Ordnance Disposal Industry
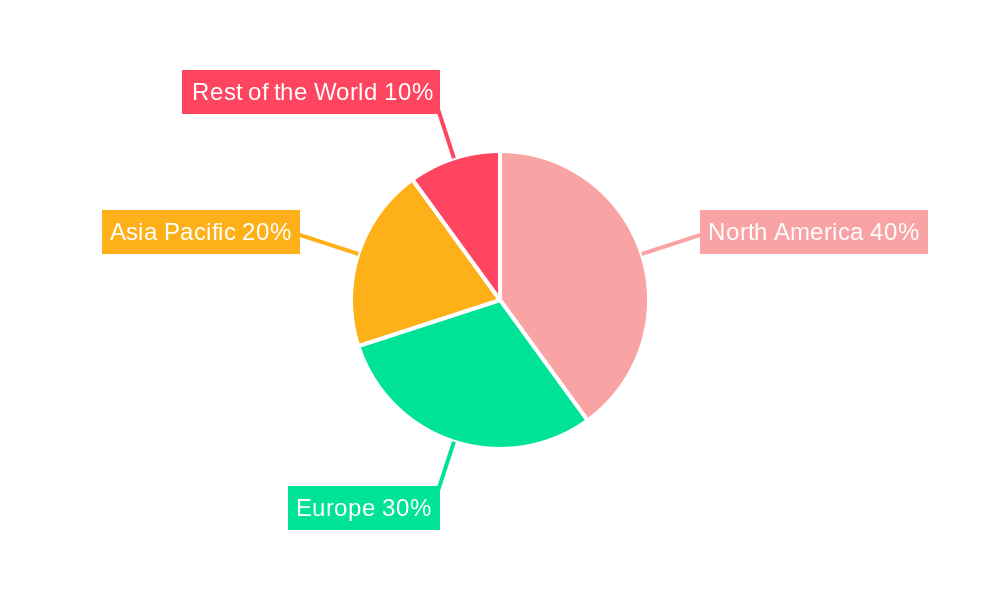
North America currently holds the largest market share in the EOD industry, driven by substantial defense spending and a robust technological base. However, the Asia-Pacific region is projected to witness the fastest growth rate over the forecast period, fueled by increasing defense budgets and counter-terrorism efforts.
- Key Drivers for North America: High defense spending, advanced technological capabilities, stringent regulatory frameworks.
- Key Drivers for Asia-Pacific: Rising defense budgets, increasing geopolitical instability, growing demand for EOD solutions in civilian applications.
Within segments:
- End User: The Military segment dominates the market, followed by Law Enforcement.
- Type: EOD Robots hold the largest segment share, followed by Explosive Detectors. The market for EOD suits and blankets is also experiencing steady growth driven by increasing demand for enhanced operator safety.
Explosive Ordnance Disposal Industry Product Innovations
Recent product developments include the integration of AI and machine learning in EOD robots, enabling greater autonomy and precision in explosive handling. Miniaturization of explosive detectors is enhancing their portability and ease of use in diverse environments. New materials and designs are improving the durability and safety of EOD suits and blankets. These innovations are improving operational efficiency, reducing risks to EOD personnel, and enhancing overall effectiveness.
Report Scope & Segmentation Analysis
This report provides a detailed segmentation of the EOD industry across two key dimensions: End User (Military and Law Enforcement) and Type (EOD Suits and Blankets, EOD Robots, Explosive Detectors, and Other Types). Each segment's growth projections, market size, and competitive dynamics are comprehensively analyzed, providing a granular understanding of market opportunities and challenges within each area. For example, the EOD robots segment is projected to reach $XX Million by 2033, driven by increasing demand for automated solutions and technological advancements.
Key Drivers of Explosive Ordnance Disposal Industry Growth
The growth of the EOD industry is propelled by several factors: the escalating global threat of terrorism and conflict, necessitating enhanced security measures; significant investments in national defense by governments worldwide; and the continuous advancement of EOD technologies, leading to more efficient and safer operations. Stringent regulatory frameworks related to explosive handling and disposal also contribute to industry growth by promoting the adoption of advanced and compliant EOD solutions.
Challenges in the Explosive Ordnance Disposal Industry Sector
The EOD industry faces challenges such as the high cost of advanced technologies, the complexities of regulatory compliance, and the potential for supply chain disruptions. Furthermore, intense competition among established players and the emergence of new entrants can impact profitability and market share. These factors can significantly impact industry growth, requiring companies to adapt their strategies and invest in innovation and efficient supply chain management.
Emerging Opportunities in Explosive Ordnance Disposal Industry
Emerging opportunities lie in the development of AI-powered autonomous EOD systems, the integration of advanced sensor technologies for enhanced explosive detection, and the expansion into new markets such as infrastructure security and counter-improvised explosive device (CIED) operations. The growing focus on enhancing operator safety is also creating opportunities for innovative EOD suit and blanket designs.
Leading Players in the Explosive Ordnance Disposal Industry Market
- L3Harris Technologies Inc (L3Harris Technologies Inc)
- Westminster International Ltd
- Cobham Limited (Cobham Limited)
- United Shield International Ltd
- NABCO Systems LLC
- Garrett Metal Detectors (Garrett Metal Detectors)
- Reamda Ltd
- ABP
- Med-Eng Holdings ULC (Cadre Holdings Inc )
- Northrop Grumman Corporation (Northrop Grumman Corporation)
- Scanna MSC
- Teledyne FLIR LLC (Teledyne FLIR LLC)
Key Developments in Explosive Ordnance Disposal Industry Industry
- 2023: L3Harris Technologies Inc. launched a new generation of EOD robots with enhanced AI capabilities.
- 2022: Northrop Grumman Corporation acquired a smaller EOD technology company, expanding its product portfolio.
- 2021: New regulations on EOD equipment safety were implemented in several key markets.
Future Outlook for Explosive Ordnance Disposal Industry Market
The EOD industry is poised for continued growth, driven by persistent global security concerns and advancements in technology. Strategic opportunities exist for companies to leverage AI, robotics, and advanced sensor technologies to develop innovative and effective EOD solutions. The increasing demand for enhanced operator safety and the expansion into new civilian applications will further fuel market expansion in the coming years.
Explosive Ordnance Disposal Industry Segmentation
-
1. Type
- 1.1. EOD Suits and Blankets
- 1.2. EOD Robots
- 1.3. Explosive Detectors
- 1.4. Other Types
-
2. End User
- 2.1. Military
- 2.2. Law Enforcement
Explosive Ordnance Disposal Industry Segmentation By Geography
-
1. North America
- 1.1. United States
- 1.2. Canada
-
2. Europe
- 2.1. Germany
- 2.2. United Kingdom
- 2.3. France
- 2.4. Russia
- 2.5. Rest of Europe
-
3. Asia Pacific
- 3.1. India
- 3.2. China
- 3.3. Japan
- 3.4. South Korea
- 3.5. Rest of Asia Pacific
- 4. Rest of the World
Explosive Ordnance Disposal Industry REPORT HIGHLIGHTS
| Aspects | Details |
|---|---|
| Study Period | 2019-2033 |
| Base Year | 2024 |
| Estimated Year | 2025 |
| Forecast Period | 2025-2033 |
| Historical Period | 2019-2024 |
| Growth Rate | CAGR of 4.71% from 2019-2033 |
| Segmentation |
|
Table of Contents
- 1. Introduction
- 1.1. Research Scope
- 1.2. Market Segmentation
- 1.3. Research Methodology
- 1.4. Definitions and Assumptions
- 2. Executive Summary
- 2.1. Introduction
- 3. Market Dynamics
- 3.1. Introduction
- 3.2. Market Drivers
- 3.2.1. Increase in Internet of Things (IoT) and Autonomous Systems; Rise in Demand for Military and Defense Satellite Communication Solutions
- 3.3. Market Restrains
- 3.3.1. Cybersecurity Threats to Satellite Communication; Interference in Transmission of Data
- 3.4. Market Trends
- 3.4.1. Military Segment will Showcase Significant Growth Due to Adoption of Unmanned Systems for EOD Operations
- 4. Market Factor Analysis
- 4.1. Porters Five Forces
- 4.2. Supply/Value Chain
- 4.3. PESTEL analysis
- 4.4. Market Entropy
- 4.5. Patent/Trademark Analysis
- 5. Global Explosive Ordnance Disposal Industry Analysis, Insights and Forecast, 2019-2031
- 5.1. Market Analysis, Insights and Forecast - by Type
- 5.1.1. EOD Suits and Blankets
- 5.1.2. EOD Robots
- 5.1.3. Explosive Detectors
- 5.1.4. Other Types
- 5.2. Market Analysis, Insights and Forecast - by End User
- 5.2.1. Military
- 5.2.2. Law Enforcement
- 5.3. Market Analysis, Insights and Forecast - by Region
- 5.3.1. North America
- 5.3.2. Europe
- 5.3.3. Asia Pacific
- 5.3.4. Rest of the World
- 5.1. Market Analysis, Insights and Forecast - by Type
- 6. North America Explosive Ordnance Disposal Industry Analysis, Insights and Forecast, 2019-2031
- 6.1. Market Analysis, Insights and Forecast - by Type
- 6.1.1. EOD Suits and Blankets
- 6.1.2. EOD Robots
- 6.1.3. Explosive Detectors
- 6.1.4. Other Types
- 6.2. Market Analysis, Insights and Forecast - by End User
- 6.2.1. Military
- 6.2.2. Law Enforcement
- 6.1. Market Analysis, Insights and Forecast - by Type
- 7. Europe Explosive Ordnance Disposal Industry Analysis, Insights and Forecast, 2019-2031
- 7.1. Market Analysis, Insights and Forecast - by Type
- 7.1.1. EOD Suits and Blankets
- 7.1.2. EOD Robots
- 7.1.3. Explosive Detectors
- 7.1.4. Other Types
- 7.2. Market Analysis, Insights and Forecast - by End User
- 7.2.1. Military
- 7.2.2. Law Enforcement
- 7.1. Market Analysis, Insights and Forecast - by Type
- 8. Asia Pacific Explosive Ordnance Disposal Industry Analysis, Insights and Forecast, 2019-2031
- 8.1. Market Analysis, Insights and Forecast - by Type
- 8.1.1. EOD Suits and Blankets
- 8.1.2. EOD Robots
- 8.1.3. Explosive Detectors
- 8.1.4. Other Types
- 8.2. Market Analysis, Insights and Forecast - by End User
- 8.2.1. Military
- 8.2.2. Law Enforcement
- 8.1. Market Analysis, Insights and Forecast - by Type
- 9. Rest of the World Explosive Ordnance Disposal Industry Analysis, Insights and Forecast, 2019-2031
- 9.1. Market Analysis, Insights and Forecast - by Type
- 9.1.1. EOD Suits and Blankets
- 9.1.2. EOD Robots
- 9.1.3. Explosive Detectors
- 9.1.4. Other Types
- 9.2. Market Analysis, Insights and Forecast - by End User
- 9.2.1. Military
- 9.2.2. Law Enforcement
- 9.1. Market Analysis, Insights and Forecast - by Type
- 10. North America Explosive Ordnance Disposal Industry Analysis, Insights and Forecast, 2019-2031
- 10.1. Market Analysis, Insights and Forecast - By Country/Sub-region
- 10.1.1 United States
- 10.1.2 Canada
- 11. Europe Explosive Ordnance Disposal Industry Analysis, Insights and Forecast, 2019-2031
- 11.1. Market Analysis, Insights and Forecast - By Country/Sub-region
- 11.1.1 Germany
- 11.1.2 United Kingdom
- 11.1.3 France
- 11.1.4 Russia
- 11.1.5 Rest of Europe
- 12. Asia Pacific Explosive Ordnance Disposal Industry Analysis, Insights and Forecast, 2019-2031
- 12.1. Market Analysis, Insights and Forecast - By Country/Sub-region
- 12.1.1 India
- 12.1.2 China
- 12.1.3 Japan
- 12.1.4 South Korea
- 12.1.5 Rest of Asia Pacific
- 13. Rest of the World Explosive Ordnance Disposal Industry Analysis, Insights and Forecast, 2019-2031
- 13.1. Market Analysis, Insights and Forecast - By Country/Sub-region
- 13.1.1.
- 14. Competitive Analysis
- 14.1. Global Market Share Analysis 2024
- 14.2. Company Profiles
- 14.2.1 L3Harris Technologies Inc
- 14.2.1.1. Overview
- 14.2.1.2. Products
- 14.2.1.3. SWOT Analysis
- 14.2.1.4. Recent Developments
- 14.2.1.5. Financials (Based on Availability)
- 14.2.2 Westminster International Ltd
- 14.2.2.1. Overview
- 14.2.2.2. Products
- 14.2.2.3. SWOT Analysis
- 14.2.2.4. Recent Developments
- 14.2.2.5. Financials (Based on Availability)
- 14.2.3 Cobham Limited
- 14.2.3.1. Overview
- 14.2.3.2. Products
- 14.2.3.3. SWOT Analysis
- 14.2.3.4. Recent Developments
- 14.2.3.5. Financials (Based on Availability)
- 14.2.4 United Shield International Ltd
- 14.2.4.1. Overview
- 14.2.4.2. Products
- 14.2.4.3. SWOT Analysis
- 14.2.4.4. Recent Developments
- 14.2.4.5. Financials (Based on Availability)
- 14.2.5 NABCO Systems LLC
- 14.2.5.1. Overview
- 14.2.5.2. Products
- 14.2.5.3. SWOT Analysis
- 14.2.5.4. Recent Developments
- 14.2.5.5. Financials (Based on Availability)
- 14.2.6 Garrett Metal Detectors
- 14.2.6.1. Overview
- 14.2.6.2. Products
- 14.2.6.3. SWOT Analysis
- 14.2.6.4. Recent Developments
- 14.2.6.5. Financials (Based on Availability)
- 14.2.7 Reamda Ltd
- 14.2.7.1. Overview
- 14.2.7.2. Products
- 14.2.7.3. SWOT Analysis
- 14.2.7.4. Recent Developments
- 14.2.7.5. Financials (Based on Availability)
- 14.2.8 ABP
- 14.2.8.1. Overview
- 14.2.8.2. Products
- 14.2.8.3. SWOT Analysis
- 14.2.8.4. Recent Developments
- 14.2.8.5. Financials (Based on Availability)
- 14.2.9 Med-Eng Holdings ULC (Cadre Holdings Inc )
- 14.2.9.1. Overview
- 14.2.9.2. Products
- 14.2.9.3. SWOT Analysis
- 14.2.9.4. Recent Developments
- 14.2.9.5. Financials (Based on Availability)
- 14.2.10 Northrop Grumman Corporation
- 14.2.10.1. Overview
- 14.2.10.2. Products
- 14.2.10.3. SWOT Analysis
- 14.2.10.4. Recent Developments
- 14.2.10.5. Financials (Based on Availability)
- 14.2.11 Scanna MSC
- 14.2.11.1. Overview
- 14.2.11.2. Products
- 14.2.11.3. SWOT Analysis
- 14.2.11.4. Recent Developments
- 14.2.11.5. Financials (Based on Availability)
- 14.2.12 Teledyne FLIR LLC
- 14.2.12.1. Overview
- 14.2.12.2. Products
- 14.2.12.3. SWOT Analysis
- 14.2.12.4. Recent Developments
- 14.2.12.5. Financials (Based on Availability)
- 14.2.1 L3Harris Technologies Inc
List of Figures
- Figure 1: Global Explosive Ordnance Disposal Industry Revenue Breakdown (Million, %) by Region 2024 & 2032
- Figure 2: North America Explosive Ordnance Disposal Industry Revenue (Million), by Country 2024 & 2032
- Figure 3: North America Explosive Ordnance Disposal Industry Revenue Share (%), by Country 2024 & 2032
- Figure 4: Europe Explosive Ordnance Disposal Industry Revenue (Million), by Country 2024 & 2032
- Figure 5: Europe Explosive Ordnance Disposal Industry Revenue Share (%), by Country 2024 & 2032
- Figure 6: Asia Pacific Explosive Ordnance Disposal Industry Revenue (Million), by Country 2024 & 2032
- Figure 7: Asia Pacific Explosive Ordnance Disposal Industry Revenue Share (%), by Country 2024 & 2032
- Figure 8: Rest of the World Explosive Ordnance Disposal Industry Revenue (Million), by Country 2024 & 2032
- Figure 9: Rest of the World Explosive Ordnance Disposal Industry Revenue Share (%), by Country 2024 & 2032
- Figure 10: North America Explosive Ordnance Disposal Industry Revenue (Million), by Type 2024 & 2032
- Figure 11: North America Explosive Ordnance Disposal Industry Revenue Share (%), by Type 2024 & 2032
- Figure 12: North America Explosive Ordnance Disposal Industry Revenue (Million), by End User 2024 & 2032
- Figure 13: North America Explosive Ordnance Disposal Industry Revenue Share (%), by End User 2024 & 2032
- Figure 14: North America Explosive Ordnance Disposal Industry Revenue (Million), by Country 2024 & 2032
- Figure 15: North America Explosive Ordnance Disposal Industry Revenue Share (%), by Country 2024 & 2032
- Figure 16: Europe Explosive Ordnance Disposal Industry Revenue (Million), by Type 2024 & 2032
- Figure 17: Europe Explosive Ordnance Disposal Industry Revenue Share (%), by Type 2024 & 2032
- Figure 18: Europe Explosive Ordnance Disposal Industry Revenue (Million), by End User 2024 & 2032
- Figure 19: Europe Explosive Ordnance Disposal Industry Revenue Share (%), by End User 2024 & 2032
- Figure 20: Europe Explosive Ordnance Disposal Industry Revenue (Million), by Country 2024 & 2032
- Figure 21: Europe Explosive Ordnance Disposal Industry Revenue Share (%), by Country 2024 & 2032
- Figure 22: Asia Pacific Explosive Ordnance Disposal Industry Revenue (Million), by Type 2024 & 2032
- Figure 23: Asia Pacific Explosive Ordnance Disposal Industry Revenue Share (%), by Type 2024 & 2032
- Figure 24: Asia Pacific Explosive Ordnance Disposal Industry Revenue (Million), by End User 2024 & 2032
- Figure 25: Asia Pacific Explosive Ordnance Disposal Industry Revenue Share (%), by End User 2024 & 2032
- Figure 26: Asia Pacific Explosive Ordnance Disposal Industry Revenue (Million), by Country 2024 & 2032
- Figure 27: Asia Pacific Explosive Ordnance Disposal Industry Revenue Share (%), by Country 2024 & 2032
- Figure 28: Rest of the World Explosive Ordnance Disposal Industry Revenue (Million), by Type 2024 & 2032
- Figure 29: Rest of the World Explosive Ordnance Disposal Industry Revenue Share (%), by Type 2024 & 2032
- Figure 30: Rest of the World Explosive Ordnance Disposal Industry Revenue (Million), by End User 2024 & 2032
- Figure 31: Rest of the World Explosive Ordnance Disposal Industry Revenue Share (%), by End User 2024 & 2032
- Figure 32: Rest of the World Explosive Ordnance Disposal Industry Revenue (Million), by Country 2024 & 2032
- Figure 33: Rest of the World Explosive Ordnance Disposal Industry Revenue Share (%), by Country 2024 & 2032
List of Tables
- Table 1: Global Explosive Ordnance Disposal Industry Revenue Million Forecast, by Region 2019 & 2032
- Table 2: Global Explosive Ordnance Disposal Industry Revenue Million Forecast, by Type 2019 & 2032
- Table 3: Global Explosive Ordnance Disposal Industry Revenue Million Forecast, by End User 2019 & 2032
- Table 4: Global Explosive Ordnance Disposal Industry Revenue Million Forecast, by Region 2019 & 2032
- Table 5: Global Explosive Ordnance Disposal Industry Revenue Million Forecast, by Country 2019 & 2032
- Table 6: United States Explosive Ordnance Disposal Industry Revenue (Million) Forecast, by Application 2019 & 2032
- Table 7: Canada Explosive Ordnance Disposal Industry Revenue (Million) Forecast, by Application 2019 & 2032
- Table 8: Global Explosive Ordnance Disposal Industry Revenue Million Forecast, by Country 2019 & 2032
- Table 9: Germany Explosive Ordnance Disposal Industry Revenue (Million) Forecast, by Application 2019 & 2032
- Table 10: United Kingdom Explosive Ordnance Disposal Industry Revenue (Million) Forecast, by Application 2019 & 2032
- Table 11: France Explosive Ordnance Disposal Industry Revenue (Million) Forecast, by Application 2019 & 2032
- Table 12: Russia Explosive Ordnance Disposal Industry Revenue (Million) Forecast, by Application 2019 & 2032
- Table 13: Rest of Europe Explosive Ordnance Disposal Industry Revenue (Million) Forecast, by Application 2019 & 2032
- Table 14: Global Explosive Ordnance Disposal Industry Revenue Million Forecast, by Country 2019 & 2032
- Table 15: India Explosive Ordnance Disposal Industry Revenue (Million) Forecast, by Application 2019 & 2032
- Table 16: China Explosive Ordnance Disposal Industry Revenue (Million) Forecast, by Application 2019 & 2032
- Table 17: Japan Explosive Ordnance Disposal Industry Revenue (Million) Forecast, by Application 2019 & 2032
- Table 18: South Korea Explosive Ordnance Disposal Industry Revenue (Million) Forecast, by Application 2019 & 2032
- Table 19: Rest of Asia Pacific Explosive Ordnance Disposal Industry Revenue (Million) Forecast, by Application 2019 & 2032
- Table 20: Global Explosive Ordnance Disposal Industry Revenue Million Forecast, by Country 2019 & 2032
- Table 21: Explosive Ordnance Disposal Industry Revenue (Million) Forecast, by Application 2019 & 2032
- Table 22: Global Explosive Ordnance Disposal Industry Revenue Million Forecast, by Type 2019 & 2032
- Table 23: Global Explosive Ordnance Disposal Industry Revenue Million Forecast, by End User 2019 & 2032
- Table 24: Global Explosive Ordnance Disposal Industry Revenue Million Forecast, by Country 2019 & 2032
- Table 25: United States Explosive Ordnance Disposal Industry Revenue (Million) Forecast, by Application 2019 & 2032
- Table 26: Canada Explosive Ordnance Disposal Industry Revenue (Million) Forecast, by Application 2019 & 2032
- Table 27: Global Explosive Ordnance Disposal Industry Revenue Million Forecast, by Type 2019 & 2032
- Table 28: Global Explosive Ordnance Disposal Industry Revenue Million Forecast, by End User 2019 & 2032
- Table 29: Global Explosive Ordnance Disposal Industry Revenue Million Forecast, by Country 2019 & 2032
- Table 30: Germany Explosive Ordnance Disposal Industry Revenue (Million) Forecast, by Application 2019 & 2032
- Table 31: United Kingdom Explosive Ordnance Disposal Industry Revenue (Million) Forecast, by Application 2019 & 2032
- Table 32: France Explosive Ordnance Disposal Industry Revenue (Million) Forecast, by Application 2019 & 2032
- Table 33: Russia Explosive Ordnance Disposal Industry Revenue (Million) Forecast, by Application 2019 & 2032
- Table 34: Rest of Europe Explosive Ordnance Disposal Industry Revenue (Million) Forecast, by Application 2019 & 2032
- Table 35: Global Explosive Ordnance Disposal Industry Revenue Million Forecast, by Type 2019 & 2032
- Table 36: Global Explosive Ordnance Disposal Industry Revenue Million Forecast, by End User 2019 & 2032
- Table 37: Global Explosive Ordnance Disposal Industry Revenue Million Forecast, by Country 2019 & 2032
- Table 38: India Explosive Ordnance Disposal Industry Revenue (Million) Forecast, by Application 2019 & 2032
- Table 39: China Explosive Ordnance Disposal Industry Revenue (Million) Forecast, by Application 2019 & 2032
- Table 40: Japan Explosive Ordnance Disposal Industry Revenue (Million) Forecast, by Application 2019 & 2032
- Table 41: South Korea Explosive Ordnance Disposal Industry Revenue (Million) Forecast, by Application 2019 & 2032
- Table 42: Rest of Asia Pacific Explosive Ordnance Disposal Industry Revenue (Million) Forecast, by Application 2019 & 2032
- Table 43: Global Explosive Ordnance Disposal Industry Revenue Million Forecast, by Type 2019 & 2032
- Table 44: Global Explosive Ordnance Disposal Industry Revenue Million Forecast, by End User 2019 & 2032
- Table 45: Global Explosive Ordnance Disposal Industry Revenue Million Forecast, by Country 2019 & 2032
Frequently Asked Questions
1. What is the projected Compound Annual Growth Rate (CAGR) of the Explosive Ordnance Disposal Industry?
The projected CAGR is approximately 4.71%.
2. Which companies are prominent players in the Explosive Ordnance Disposal Industry?
Key companies in the market include L3Harris Technologies Inc, Westminster International Ltd, Cobham Limited, United Shield International Ltd, NABCO Systems LLC, Garrett Metal Detectors, Reamda Ltd, ABP, Med-Eng Holdings ULC (Cadre Holdings Inc ), Northrop Grumman Corporation, Scanna MSC, Teledyne FLIR LLC.
3. What are the main segments of the Explosive Ordnance Disposal Industry?
The market segments include Type, End User.
4. Can you provide details about the market size?
The market size is estimated to be USD 5.43 Million as of 2022.
5. What are some drivers contributing to market growth?
Increase in Internet of Things (IoT) and Autonomous Systems; Rise in Demand for Military and Defense Satellite Communication Solutions.
6. What are the notable trends driving market growth?
Military Segment will Showcase Significant Growth Due to Adoption of Unmanned Systems for EOD Operations.
7. Are there any restraints impacting market growth?
Cybersecurity Threats to Satellite Communication; Interference in Transmission of Data.
8. Can you provide examples of recent developments in the market?
N/A
9. What pricing options are available for accessing the report?
Pricing options include single-user, multi-user, and enterprise licenses priced at USD 4750, USD 5250, and USD 8750 respectively.
10. Is the market size provided in terms of value or volume?
The market size is provided in terms of value, measured in Million.
11. Are there any specific market keywords associated with the report?
Yes, the market keyword associated with the report is "Explosive Ordnance Disposal Industry," which aids in identifying and referencing the specific market segment covered.
12. How do I determine which pricing option suits my needs best?
The pricing options vary based on user requirements and access needs. Individual users may opt for single-user licenses, while businesses requiring broader access may choose multi-user or enterprise licenses for cost-effective access to the report.
13. Are there any additional resources or data provided in the Explosive Ordnance Disposal Industry report?
While the report offers comprehensive insights, it's advisable to review the specific contents or supplementary materials provided to ascertain if additional resources or data are available.
14. How can I stay updated on further developments or reports in the Explosive Ordnance Disposal Industry?
To stay informed about further developments, trends, and reports in the Explosive Ordnance Disposal Industry, consider subscribing to industry newsletters, following relevant companies and organizations, or regularly checking reputable industry news sources and publications.
Methodology
Step 1 - Identification of Relevant Samples Size from Population Database


Step 2 - Approaches for Defining Global Market Size (Value, Volume* & Price*)

Note*: In applicable scenarios
Step 3 - Data Sources
Primary Research
- Web Analytics
- Survey Reports
- Research Institute
- Latest Research Reports
- Opinion Leaders
Secondary Research
- Annual Reports
- White Paper
- Latest Press Release
- Industry Association
- Paid Database
- Investor Presentations

Step 4 - Data Triangulation
Involves using different sources of information in order to increase the validity of a study
These sources are likely to be stakeholders in a program - participants, other researchers, program staff, other community members, and so on.
Then we put all data in single framework & apply various statistical tools to find out the dynamic on the market.
During the analysis stage, feedback from the stakeholder groups would be compared to determine areas of agreement as well as areas of divergence


