
Key Insights
The US fish and seafood market, a substantial sector within the broader food industry, exhibits robust growth potential. Driven by increasing consumer demand for healthy and protein-rich diets, coupled with rising awareness of the nutritional benefits of seafood, the market is experiencing a steady expansion. The preference for convenient, ready-to-eat options like canned and processed seafood fuels market growth, particularly within busy urban lifestyles. While frozen seafood maintains a significant market share due to its extended shelf life and affordability, the demand for fresh/chilled seafood is also on the rise, indicating a growing consumer willingness to pay a premium for quality and freshness. Key distribution channels include both on-trade (restaurants, hotels) and off-trade (grocery stores, supermarkets), with the latter segment exhibiting stronger growth due to increasing e-commerce penetration and home delivery services.
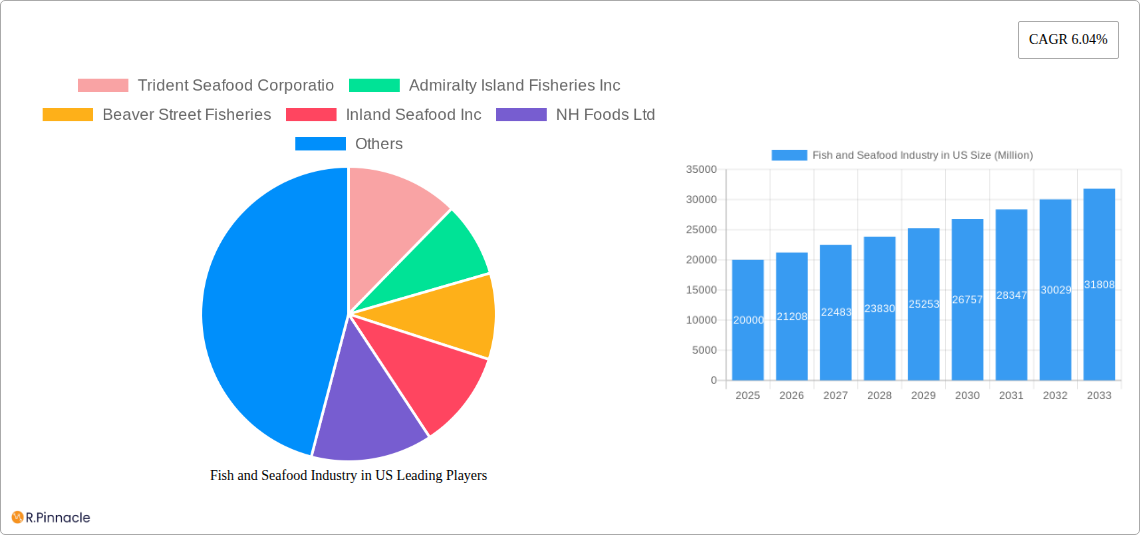
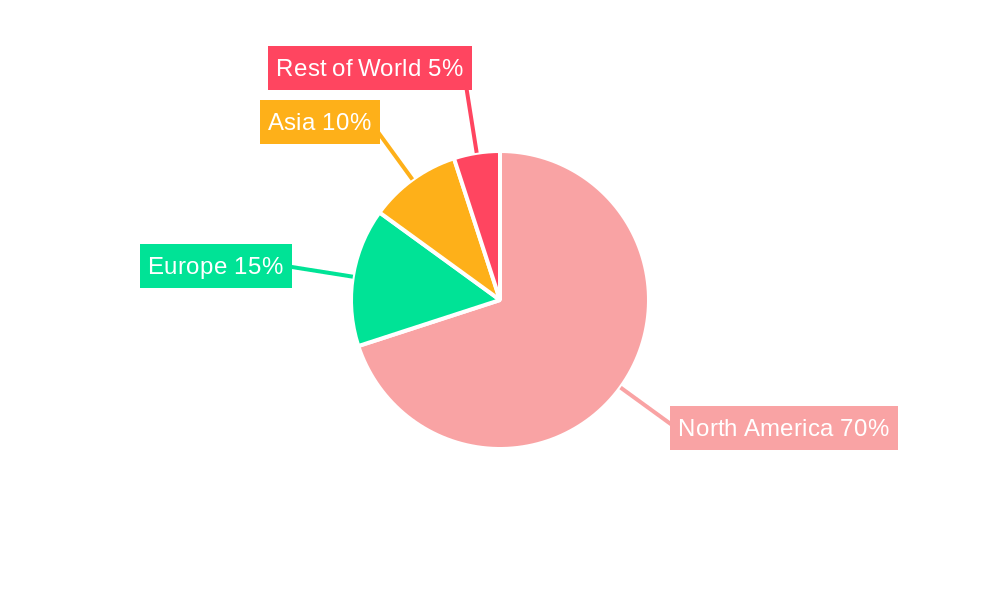
Significant regional variations exist within the US market. Coastal regions naturally exhibit higher consumption rates, while inland areas show gradual increases influenced by improved distribution networks and rising awareness campaigns highlighting seafood's health benefits. The market is also influenced by factors such as fluctuating seafood prices (tied to global supply chains and environmental conditions), stringent regulatory frameworks concerning sustainable fishing practices, and evolving consumer preferences toward ethically sourced and sustainably harvested products. Competition among major players like Trident Seafood Corporation, High Liner Foods Inc., and Thai Union Group PCL is fierce, leading to innovation in product offerings, packaging, and marketing strategies to capture market share. Future growth will likely be shaped by the success of sustainable fishing initiatives, the development of innovative seafood processing technologies, and effective strategies to address consumer concerns about seafood safety and traceability.
Fish and Seafood Industry in US: A Comprehensive Market Report (2019-2033)
This in-depth report provides a comprehensive analysis of the US fish and seafood industry, covering market structure, dynamics, key players, and future outlook. The study period spans from 2019 to 2033, with 2025 as the base and estimated year. This report is crucial for industry professionals, investors, and anyone seeking to understand this dynamic market.
Fish and Seafood Industry in US Market Structure & Innovation Trends
This section analyzes the competitive landscape, innovation drivers, and regulatory environment of the US fish and seafood market (2019-2024). The market is characterized by a mix of large multinational corporations and smaller regional players. Market concentration is moderate, with the top five companies holding approximately xx% market share in 2024 (estimated). Innovation is driven by consumer demand for sustainable and healthy seafood options, leading to advancements in aquaculture, processing techniques, and packaging. Regulatory frameworks, including those related to sustainability and food safety, significantly impact market operations. Product substitutes, such as plant-based seafood alternatives, are gaining traction, presenting both challenges and opportunities. End-user demographics are shifting, with increasing demand from health-conscious consumers. Mergers and acquisitions (M&A) are common, with recent deals valued at an estimated xx Million USD annually. Examples include Inland Seafood’s acquisition of Lonestar Seafood in January 2023.
- Market Concentration: Moderate, with top 5 players holding xx% market share (2024 est.).
- Innovation Drivers: Sustainability, health consciousness, technological advancements.
- Regulatory Framework: Stringent food safety and sustainability regulations.
- M&A Activity: Significant, with annual deal values estimated at xx Million USD.
Fish and Seafood Industry in US Market Dynamics & Trends
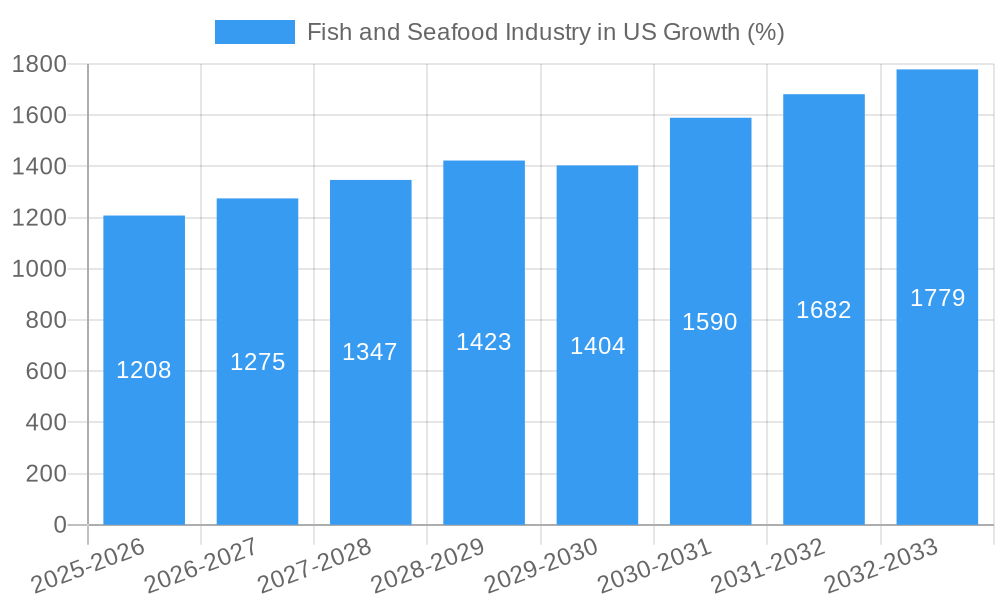
The US fish and seafood market exhibits robust growth, driven by increasing consumer demand for seafood, expanding distribution channels, and product diversification. Technological advancements in aquaculture and processing enhance efficiency and sustainability. Consumer preferences are shifting towards convenience, health, and ethically sourced products. Competitive dynamics are shaped by price competition, branding, and innovation. The Compound Annual Growth Rate (CAGR) for the forecast period (2025-2033) is projected at xx%, with market penetration of xx% by 2033. Specific trends include increasing demand for frozen and processed seafood, growth of online sales, and the emergence of plant-based alternatives.
Dominant Regions & Segments in Fish and Seafood Industry in US
The Pacific Northwest remains a dominant region due to its robust fishing industry and established infrastructure. However, growth is also observed in other regions due to expanding distribution networks and increased consumer demand.
Dominant Segments:
- Type: Frozen fish constitutes the largest segment, followed by fresh/chilled and canned seafood.
- Form: Frozen seafood dominates due to its extended shelf life and convenience.
- Distribution Channel: Off-trade (retail) accounts for a larger market share compared to on-trade (food service).
Key Drivers for Dominance:
- Pacific Northwest: Established fishing infrastructure, abundant resources.
- Frozen Seafood: Extended shelf life, convenience for consumers and retailers.
- Off-trade: Wider reach and accessibility for consumers.
Fish and Seafood Industry in US Product Innovations
Recent innovations focus on sustainable aquaculture practices, value-added processed products, and convenient packaging. Technological advancements in processing and preservation techniques improve product quality and extend shelf life. Market fit is driven by consumer preferences for health, convenience, and sustainability. The introduction of new product ranges like Trident Seafood’s "Prized Fish" exemplifies this trend.
Report Scope & Segmentation Analysis
This report comprehensively segments the US fish and seafood market by type (fish, shrimp, other seafood), form (canned, fresh/chilled, frozen, processed), and distribution channel (off-trade, on-trade). Each segment is analyzed, including growth projections, market sizes, and competitive dynamics. For instance, the frozen seafood segment is projected to exhibit the highest growth rate due to convenience and longer shelf life.
Key Drivers of Fish and Seafood Industry in US Growth
Several factors drive market growth:
- Rising consumer demand: Increasing awareness of the health benefits of seafood.
- Technological advancements: Improvements in aquaculture and processing.
- Favorable regulatory environment: Support for sustainable fishing practices.
- Expanding distribution channels: E-commerce and retail expansion.
Challenges in the Fish and Seafood Industry in US Sector
The industry faces challenges such as:
- Supply chain disruptions: Volatility in seafood supply and transportation costs.
- Sustainability concerns: Pressure to adopt sustainable fishing practices.
- Price volatility: Fluctuating raw material costs and market demand.
- Competition: Emergence of plant-based seafood alternatives.
Emerging Opportunities in Fish and Seafood Industry in US
Opportunities lie in:
- Sustainable aquaculture: Growing demand for sustainably sourced seafood.
- Value-added products: Increased demand for convenience and ready-to-eat meals.
- Premiumization: Focus on high-quality, sustainably sourced seafood.
- E-commerce growth: Expansion of online seafood sales.
Leading Players in the Fish and Seafood Industry in US Market
- Trident Seafood Corporation
- Admiralty Island Fisheries Inc
- Beaver Street Fisheries
- Inland Seafood Inc
- NH Foods Ltd
- High Liner Foods Inc
- Sysco Corporation
- The Kraft Heinz Company
- Thai Union Group PCL
- Mowi ASA
Key Developments in Fish and Seafood Industry in US Industry
- May 2023: Trident Seafood Corporation launched a new "Prized Fish" product range in collaboration with Copper River Prince William Sound Marketing Association.
- April 2023: Inland Seafood opened a new facility in Jefferson Parish, Louisiana, creating 55 jobs.
- January 2023: Inland Seafood acquired Lonestar Seafood, expanding its presence in the western US.
Future Outlook for Fish and Seafood Industry in US Market
The US fish and seafood market is poised for continued growth, driven by increasing consumer demand, innovation, and sustainability initiatives. Strategic opportunities lie in investing in sustainable aquaculture, developing value-added products, and expanding e-commerce channels. The market is expected to experience substantial growth in the coming years, with significant potential for expansion in both domestic and international markets.
Fish and Seafood Industry in US Segmentation
-
1. Type
- 1.1. Fish
- 1.2. Shrimp
- 1.3. Other Seafood
-
2. Form
- 2.1. Canned
- 2.2. Fresh / Chilled
- 2.3. Frozen
- 2.4. Processed
-
3. Distribution Channel
-
3.1. Off-Trade
- 3.1.1. Convenience Stores
- 3.1.2. Online Channel
- 3.1.3. Supermarkets and Hypermarkets
- 3.1.4. Others
- 3.2. On-Trade
-
3.1. Off-Trade
Fish and Seafood Industry in US Segmentation By Geography
-
1. North America
- 1.1. United States
- 1.2. Canada
- 1.3. Mexico
-
2. South America
- 2.1. Brazil
- 2.2. Argentina
- 2.3. Rest of South America
-
3. Europe
- 3.1. United Kingdom
- 3.2. Germany
- 3.3. France
- 3.4. Italy
- 3.5. Spain
- 3.6. Russia
- 3.7. Benelux
- 3.8. Nordics
- 3.9. Rest of Europe
-
4. Middle East & Africa
- 4.1. Turkey
- 4.2. Israel
- 4.3. GCC
- 4.4. North Africa
- 4.5. South Africa
- 4.6. Rest of Middle East & Africa
-
5. Asia Pacific
- 5.1. China
- 5.2. India
- 5.3. Japan
- 5.4. South Korea
- 5.5. ASEAN
- 5.6. Oceania
- 5.7. Rest of Asia Pacific
Fish and Seafood Industry in US REPORT HIGHLIGHTS
| Aspects | Details |
|---|---|
| Study Period | 2019-2033 |
| Base Year | 2024 |
| Estimated Year | 2025 |
| Forecast Period | 2025-2033 |
| Historical Period | 2019-2024 |
| Growth Rate | CAGR of 6.04% from 2019-2033 |
| Segmentation |
|
Table of Contents
- 1. Introduction
- 1.1. Research Scope
- 1.2. Market Segmentation
- 1.3. Research Methodology
- 1.4. Definitions and Assumptions
- 2. Executive Summary
- 2.1. Introduction
- 3. Market Dynamics
- 3.1. Introduction
- 3.2. Market Drivers
- 3.2.1. Increasing Focus on Maintaining Health and Well-Being; Launching Supplements For Specific Purposes and Targeted Population
- 3.3. Market Restrains
- 3.3.1. Supplement Consumption and Their Side-effects; Inclination Towards Substitute Products
- 3.4. Market Trends
- 3.4.1. OTHER KEY INDUSTRY TRENDS COVERED IN THE REPORT
- 4. Market Factor Analysis
- 4.1. Porters Five Forces
- 4.2. Supply/Value Chain
- 4.3. PESTEL analysis
- 4.4. Market Entropy
- 4.5. Patent/Trademark Analysis
- 5. Global Fish and Seafood Industry in US Analysis, Insights and Forecast, 2019-2031
- 5.1. Market Analysis, Insights and Forecast - by Type
- 5.1.1. Fish
- 5.1.2. Shrimp
- 5.1.3. Other Seafood
- 5.2. Market Analysis, Insights and Forecast - by Form
- 5.2.1. Canned
- 5.2.2. Fresh / Chilled
- 5.2.3. Frozen
- 5.2.4. Processed
- 5.3. Market Analysis, Insights and Forecast - by Distribution Channel
- 5.3.1. Off-Trade
- 5.3.1.1. Convenience Stores
- 5.3.1.2. Online Channel
- 5.3.1.3. Supermarkets and Hypermarkets
- 5.3.1.4. Others
- 5.3.2. On-Trade
- 5.3.1. Off-Trade
- 5.4. Market Analysis, Insights and Forecast - by Region
- 5.4.1. North America
- 5.4.2. South America
- 5.4.3. Europe
- 5.4.4. Middle East & Africa
- 5.4.5. Asia Pacific
- 5.1. Market Analysis, Insights and Forecast - by Type
- 6. North America Fish and Seafood Industry in US Analysis, Insights and Forecast, 2019-2031
- 6.1. Market Analysis, Insights and Forecast - by Type
- 6.1.1. Fish
- 6.1.2. Shrimp
- 6.1.3. Other Seafood
- 6.2. Market Analysis, Insights and Forecast - by Form
- 6.2.1. Canned
- 6.2.2. Fresh / Chilled
- 6.2.3. Frozen
- 6.2.4. Processed
- 6.3. Market Analysis, Insights and Forecast - by Distribution Channel
- 6.3.1. Off-Trade
- 6.3.1.1. Convenience Stores
- 6.3.1.2. Online Channel
- 6.3.1.3. Supermarkets and Hypermarkets
- 6.3.1.4. Others
- 6.3.2. On-Trade
- 6.3.1. Off-Trade
- 6.1. Market Analysis, Insights and Forecast - by Type
- 7. South America Fish and Seafood Industry in US Analysis, Insights and Forecast, 2019-2031
- 7.1. Market Analysis, Insights and Forecast - by Type
- 7.1.1. Fish
- 7.1.2. Shrimp
- 7.1.3. Other Seafood
- 7.2. Market Analysis, Insights and Forecast - by Form
- 7.2.1. Canned
- 7.2.2. Fresh / Chilled
- 7.2.3. Frozen
- 7.2.4. Processed
- 7.3. Market Analysis, Insights and Forecast - by Distribution Channel
- 7.3.1. Off-Trade
- 7.3.1.1. Convenience Stores
- 7.3.1.2. Online Channel
- 7.3.1.3. Supermarkets and Hypermarkets
- 7.3.1.4. Others
- 7.3.2. On-Trade
- 7.3.1. Off-Trade
- 7.1. Market Analysis, Insights and Forecast - by Type
- 8. Europe Fish and Seafood Industry in US Analysis, Insights and Forecast, 2019-2031
- 8.1. Market Analysis, Insights and Forecast - by Type
- 8.1.1. Fish
- 8.1.2. Shrimp
- 8.1.3. Other Seafood
- 8.2. Market Analysis, Insights and Forecast - by Form
- 8.2.1. Canned
- 8.2.2. Fresh / Chilled
- 8.2.3. Frozen
- 8.2.4. Processed
- 8.3. Market Analysis, Insights and Forecast - by Distribution Channel
- 8.3.1. Off-Trade
- 8.3.1.1. Convenience Stores
- 8.3.1.2. Online Channel
- 8.3.1.3. Supermarkets and Hypermarkets
- 8.3.1.4. Others
- 8.3.2. On-Trade
- 8.3.1. Off-Trade
- 8.1. Market Analysis, Insights and Forecast - by Type
- 9. Middle East & Africa Fish and Seafood Industry in US Analysis, Insights and Forecast, 2019-2031
- 9.1. Market Analysis, Insights and Forecast - by Type
- 9.1.1. Fish
- 9.1.2. Shrimp
- 9.1.3. Other Seafood
- 9.2. Market Analysis, Insights and Forecast - by Form
- 9.2.1. Canned
- 9.2.2. Fresh / Chilled
- 9.2.3. Frozen
- 9.2.4. Processed
- 9.3. Market Analysis, Insights and Forecast - by Distribution Channel
- 9.3.1. Off-Trade
- 9.3.1.1. Convenience Stores
- 9.3.1.2. Online Channel
- 9.3.1.3. Supermarkets and Hypermarkets
- 9.3.1.4. Others
- 9.3.2. On-Trade
- 9.3.1. Off-Trade
- 9.1. Market Analysis, Insights and Forecast - by Type
- 10. Asia Pacific Fish and Seafood Industry in US Analysis, Insights and Forecast, 2019-2031
- 10.1. Market Analysis, Insights and Forecast - by Type
- 10.1.1. Fish
- 10.1.2. Shrimp
- 10.1.3. Other Seafood
- 10.2. Market Analysis, Insights and Forecast - by Form
- 10.2.1. Canned
- 10.2.2. Fresh / Chilled
- 10.2.3. Frozen
- 10.2.4. Processed
- 10.3. Market Analysis, Insights and Forecast - by Distribution Channel
- 10.3.1. Off-Trade
- 10.3.1.1. Convenience Stores
- 10.3.1.2. Online Channel
- 10.3.1.3. Supermarkets and Hypermarkets
- 10.3.1.4. Others
- 10.3.2. On-Trade
- 10.3.1. Off-Trade
- 10.1. Market Analysis, Insights and Forecast - by Type
- 11. United States Fish and Seafood Industry in US Analysis, Insights and Forecast, 2019-2031
- 12. Canada Fish and Seafood Industry in US Analysis, Insights and Forecast, 2019-2031
- 13. Mexico Fish and Seafood Industry in US Analysis, Insights and Forecast, 2019-2031
- 14. Rest of North America Fish and Seafood Industry in US Analysis, Insights and Forecast, 2019-2031
- 15. Competitive Analysis
- 15.1. Global Market Share Analysis 2024
- 15.2. Company Profiles
- 15.2.1 Trident Seafood Corporatio
- 15.2.1.1. Overview
- 15.2.1.2. Products
- 15.2.1.3. SWOT Analysis
- 15.2.1.4. Recent Developments
- 15.2.1.5. Financials (Based on Availability)
- 15.2.2 Admiralty Island Fisheries Inc
- 15.2.2.1. Overview
- 15.2.2.2. Products
- 15.2.2.3. SWOT Analysis
- 15.2.2.4. Recent Developments
- 15.2.2.5. Financials (Based on Availability)
- 15.2.3 Beaver Street Fisheries
- 15.2.3.1. Overview
- 15.2.3.2. Products
- 15.2.3.3. SWOT Analysis
- 15.2.3.4. Recent Developments
- 15.2.3.5. Financials (Based on Availability)
- 15.2.4 Inland Seafood Inc
- 15.2.4.1. Overview
- 15.2.4.2. Products
- 15.2.4.3. SWOT Analysis
- 15.2.4.4. Recent Developments
- 15.2.4.5. Financials (Based on Availability)
- 15.2.5 NH Foods Ltd
- 15.2.5.1. Overview
- 15.2.5.2. Products
- 15.2.5.3. SWOT Analysis
- 15.2.5.4. Recent Developments
- 15.2.5.5. Financials (Based on Availability)
- 15.2.6 High Liner Foods Inc
- 15.2.6.1. Overview
- 15.2.6.2. Products
- 15.2.6.3. SWOT Analysis
- 15.2.6.4. Recent Developments
- 15.2.6.5. Financials (Based on Availability)
- 15.2.7 Sysco Corporation
- 15.2.7.1. Overview
- 15.2.7.2. Products
- 15.2.7.3. SWOT Analysis
- 15.2.7.4. Recent Developments
- 15.2.7.5. Financials (Based on Availability)
- 15.2.8 The Kraft Heinz Company
- 15.2.8.1. Overview
- 15.2.8.2. Products
- 15.2.8.3. SWOT Analysis
- 15.2.8.4. Recent Developments
- 15.2.8.5. Financials (Based on Availability)
- 15.2.9 Thai Union Group PCL
- 15.2.9.1. Overview
- 15.2.9.2. Products
- 15.2.9.3. SWOT Analysis
- 15.2.9.4. Recent Developments
- 15.2.9.5. Financials (Based on Availability)
- 15.2.10 Mowi ASA
- 15.2.10.1. Overview
- 15.2.10.2. Products
- 15.2.10.3. SWOT Analysis
- 15.2.10.4. Recent Developments
- 15.2.10.5. Financials (Based on Availability)
- 15.2.1 Trident Seafood Corporatio
List of Figures
- Figure 1: Global Fish and Seafood Industry in US Revenue Breakdown (Million, %) by Region 2024 & 2032
- Figure 2: North America Fish and Seafood Industry in US Revenue (Million), by Country 2024 & 2032
- Figure 3: North America Fish and Seafood Industry in US Revenue Share (%), by Country 2024 & 2032
- Figure 4: North America Fish and Seafood Industry in US Revenue (Million), by Type 2024 & 2032
- Figure 5: North America Fish and Seafood Industry in US Revenue Share (%), by Type 2024 & 2032
- Figure 6: North America Fish and Seafood Industry in US Revenue (Million), by Form 2024 & 2032
- Figure 7: North America Fish and Seafood Industry in US Revenue Share (%), by Form 2024 & 2032
- Figure 8: North America Fish and Seafood Industry in US Revenue (Million), by Distribution Channel 2024 & 2032
- Figure 9: North America Fish and Seafood Industry in US Revenue Share (%), by Distribution Channel 2024 & 2032
- Figure 10: North America Fish and Seafood Industry in US Revenue (Million), by Country 2024 & 2032
- Figure 11: North America Fish and Seafood Industry in US Revenue Share (%), by Country 2024 & 2032
- Figure 12: South America Fish and Seafood Industry in US Revenue (Million), by Type 2024 & 2032
- Figure 13: South America Fish and Seafood Industry in US Revenue Share (%), by Type 2024 & 2032
- Figure 14: South America Fish and Seafood Industry in US Revenue (Million), by Form 2024 & 2032
- Figure 15: South America Fish and Seafood Industry in US Revenue Share (%), by Form 2024 & 2032
- Figure 16: South America Fish and Seafood Industry in US Revenue (Million), by Distribution Channel 2024 & 2032
- Figure 17: South America Fish and Seafood Industry in US Revenue Share (%), by Distribution Channel 2024 & 2032
- Figure 18: South America Fish and Seafood Industry in US Revenue (Million), by Country 2024 & 2032
- Figure 19: South America Fish and Seafood Industry in US Revenue Share (%), by Country 2024 & 2032
- Figure 20: Europe Fish and Seafood Industry in US Revenue (Million), by Type 2024 & 2032
- Figure 21: Europe Fish and Seafood Industry in US Revenue Share (%), by Type 2024 & 2032
- Figure 22: Europe Fish and Seafood Industry in US Revenue (Million), by Form 2024 & 2032
- Figure 23: Europe Fish and Seafood Industry in US Revenue Share (%), by Form 2024 & 2032
- Figure 24: Europe Fish and Seafood Industry in US Revenue (Million), by Distribution Channel 2024 & 2032
- Figure 25: Europe Fish and Seafood Industry in US Revenue Share (%), by Distribution Channel 2024 & 2032
- Figure 26: Europe Fish and Seafood Industry in US Revenue (Million), by Country 2024 & 2032
- Figure 27: Europe Fish and Seafood Industry in US Revenue Share (%), by Country 2024 & 2032
- Figure 28: Middle East & Africa Fish and Seafood Industry in US Revenue (Million), by Type 2024 & 2032
- Figure 29: Middle East & Africa Fish and Seafood Industry in US Revenue Share (%), by Type 2024 & 2032
- Figure 30: Middle East & Africa Fish and Seafood Industry in US Revenue (Million), by Form 2024 & 2032
- Figure 31: Middle East & Africa Fish and Seafood Industry in US Revenue Share (%), by Form 2024 & 2032
- Figure 32: Middle East & Africa Fish and Seafood Industry in US Revenue (Million), by Distribution Channel 2024 & 2032
- Figure 33: Middle East & Africa Fish and Seafood Industry in US Revenue Share (%), by Distribution Channel 2024 & 2032
- Figure 34: Middle East & Africa Fish and Seafood Industry in US Revenue (Million), by Country 2024 & 2032
- Figure 35: Middle East & Africa Fish and Seafood Industry in US Revenue Share (%), by Country 2024 & 2032
- Figure 36: Asia Pacific Fish and Seafood Industry in US Revenue (Million), by Type 2024 & 2032
- Figure 37: Asia Pacific Fish and Seafood Industry in US Revenue Share (%), by Type 2024 & 2032
- Figure 38: Asia Pacific Fish and Seafood Industry in US Revenue (Million), by Form 2024 & 2032
- Figure 39: Asia Pacific Fish and Seafood Industry in US Revenue Share (%), by Form 2024 & 2032
- Figure 40: Asia Pacific Fish and Seafood Industry in US Revenue (Million), by Distribution Channel 2024 & 2032
- Figure 41: Asia Pacific Fish and Seafood Industry in US Revenue Share (%), by Distribution Channel 2024 & 2032
- Figure 42: Asia Pacific Fish and Seafood Industry in US Revenue (Million), by Country 2024 & 2032
- Figure 43: Asia Pacific Fish and Seafood Industry in US Revenue Share (%), by Country 2024 & 2032
List of Tables
- Table 1: Global Fish and Seafood Industry in US Revenue Million Forecast, by Region 2019 & 2032
- Table 2: Global Fish and Seafood Industry in US Revenue Million Forecast, by Type 2019 & 2032
- Table 3: Global Fish and Seafood Industry in US Revenue Million Forecast, by Form 2019 & 2032
- Table 4: Global Fish and Seafood Industry in US Revenue Million Forecast, by Distribution Channel 2019 & 2032
- Table 5: Global Fish and Seafood Industry in US Revenue Million Forecast, by Region 2019 & 2032
- Table 6: Global Fish and Seafood Industry in US Revenue Million Forecast, by Country 2019 & 2032
- Table 7: United States Fish and Seafood Industry in US Revenue (Million) Forecast, by Application 2019 & 2032
- Table 8: Canada Fish and Seafood Industry in US Revenue (Million) Forecast, by Application 2019 & 2032
- Table 9: Mexico Fish and Seafood Industry in US Revenue (Million) Forecast, by Application 2019 & 2032
- Table 10: Rest of North America Fish and Seafood Industry in US Revenue (Million) Forecast, by Application 2019 & 2032
- Table 11: Global Fish and Seafood Industry in US Revenue Million Forecast, by Type 2019 & 2032
- Table 12: Global Fish and Seafood Industry in US Revenue Million Forecast, by Form 2019 & 2032
- Table 13: Global Fish and Seafood Industry in US Revenue Million Forecast, by Distribution Channel 2019 & 2032
- Table 14: Global Fish and Seafood Industry in US Revenue Million Forecast, by Country 2019 & 2032
- Table 15: United States Fish and Seafood Industry in US Revenue (Million) Forecast, by Application 2019 & 2032
- Table 16: Canada Fish and Seafood Industry in US Revenue (Million) Forecast, by Application 2019 & 2032
- Table 17: Mexico Fish and Seafood Industry in US Revenue (Million) Forecast, by Application 2019 & 2032
- Table 18: Global Fish and Seafood Industry in US Revenue Million Forecast, by Type 2019 & 2032
- Table 19: Global Fish and Seafood Industry in US Revenue Million Forecast, by Form 2019 & 2032
- Table 20: Global Fish and Seafood Industry in US Revenue Million Forecast, by Distribution Channel 2019 & 2032
- Table 21: Global Fish and Seafood Industry in US Revenue Million Forecast, by Country 2019 & 2032
- Table 22: Brazil Fish and Seafood Industry in US Revenue (Million) Forecast, by Application 2019 & 2032
- Table 23: Argentina Fish and Seafood Industry in US Revenue (Million) Forecast, by Application 2019 & 2032
- Table 24: Rest of South America Fish and Seafood Industry in US Revenue (Million) Forecast, by Application 2019 & 2032
- Table 25: Global Fish and Seafood Industry in US Revenue Million Forecast, by Type 2019 & 2032
- Table 26: Global Fish and Seafood Industry in US Revenue Million Forecast, by Form 2019 & 2032
- Table 27: Global Fish and Seafood Industry in US Revenue Million Forecast, by Distribution Channel 2019 & 2032
- Table 28: Global Fish and Seafood Industry in US Revenue Million Forecast, by Country 2019 & 2032
- Table 29: United Kingdom Fish and Seafood Industry in US Revenue (Million) Forecast, by Application 2019 & 2032
- Table 30: Germany Fish and Seafood Industry in US Revenue (Million) Forecast, by Application 2019 & 2032
- Table 31: France Fish and Seafood Industry in US Revenue (Million) Forecast, by Application 2019 & 2032
- Table 32: Italy Fish and Seafood Industry in US Revenue (Million) Forecast, by Application 2019 & 2032
- Table 33: Spain Fish and Seafood Industry in US Revenue (Million) Forecast, by Application 2019 & 2032
- Table 34: Russia Fish and Seafood Industry in US Revenue (Million) Forecast, by Application 2019 & 2032
- Table 35: Benelux Fish and Seafood Industry in US Revenue (Million) Forecast, by Application 2019 & 2032
- Table 36: Nordics Fish and Seafood Industry in US Revenue (Million) Forecast, by Application 2019 & 2032
- Table 37: Rest of Europe Fish and Seafood Industry in US Revenue (Million) Forecast, by Application 2019 & 2032
- Table 38: Global Fish and Seafood Industry in US Revenue Million Forecast, by Type 2019 & 2032
- Table 39: Global Fish and Seafood Industry in US Revenue Million Forecast, by Form 2019 & 2032
- Table 40: Global Fish and Seafood Industry in US Revenue Million Forecast, by Distribution Channel 2019 & 2032
- Table 41: Global Fish and Seafood Industry in US Revenue Million Forecast, by Country 2019 & 2032
- Table 42: Turkey Fish and Seafood Industry in US Revenue (Million) Forecast, by Application 2019 & 2032
- Table 43: Israel Fish and Seafood Industry in US Revenue (Million) Forecast, by Application 2019 & 2032
- Table 44: GCC Fish and Seafood Industry in US Revenue (Million) Forecast, by Application 2019 & 2032
- Table 45: North Africa Fish and Seafood Industry in US Revenue (Million) Forecast, by Application 2019 & 2032
- Table 46: South Africa Fish and Seafood Industry in US Revenue (Million) Forecast, by Application 2019 & 2032
- Table 47: Rest of Middle East & Africa Fish and Seafood Industry in US Revenue (Million) Forecast, by Application 2019 & 2032
- Table 48: Global Fish and Seafood Industry in US Revenue Million Forecast, by Type 2019 & 2032
- Table 49: Global Fish and Seafood Industry in US Revenue Million Forecast, by Form 2019 & 2032
- Table 50: Global Fish and Seafood Industry in US Revenue Million Forecast, by Distribution Channel 2019 & 2032
- Table 51: Global Fish and Seafood Industry in US Revenue Million Forecast, by Country 2019 & 2032
- Table 52: China Fish and Seafood Industry in US Revenue (Million) Forecast, by Application 2019 & 2032
- Table 53: India Fish and Seafood Industry in US Revenue (Million) Forecast, by Application 2019 & 2032
- Table 54: Japan Fish and Seafood Industry in US Revenue (Million) Forecast, by Application 2019 & 2032
- Table 55: South Korea Fish and Seafood Industry in US Revenue (Million) Forecast, by Application 2019 & 2032
- Table 56: ASEAN Fish and Seafood Industry in US Revenue (Million) Forecast, by Application 2019 & 2032
- Table 57: Oceania Fish and Seafood Industry in US Revenue (Million) Forecast, by Application 2019 & 2032
- Table 58: Rest of Asia Pacific Fish and Seafood Industry in US Revenue (Million) Forecast, by Application 2019 & 2032
Frequently Asked Questions
1. What is the projected Compound Annual Growth Rate (CAGR) of the Fish and Seafood Industry in US?
The projected CAGR is approximately 6.04%.
2. Which companies are prominent players in the Fish and Seafood Industry in US?
Key companies in the market include Trident Seafood Corporatio, Admiralty Island Fisheries Inc, Beaver Street Fisheries, Inland Seafood Inc, NH Foods Ltd, High Liner Foods Inc, Sysco Corporation, The Kraft Heinz Company, Thai Union Group PCL, Mowi ASA.
3. What are the main segments of the Fish and Seafood Industry in US?
The market segments include Type, Form, Distribution Channel.
4. Can you provide details about the market size?
The market size is estimated to be USD XX Million as of 2022.
5. What are some drivers contributing to market growth?
Increasing Focus on Maintaining Health and Well-Being; Launching Supplements For Specific Purposes and Targeted Population.
6. What are the notable trends driving market growth?
OTHER KEY INDUSTRY TRENDS COVERED IN THE REPORT.
7. Are there any restraints impacting market growth?
Supplement Consumption and Their Side-effects; Inclination Towards Substitute Products.
8. Can you provide examples of recent developments in the market?
May 2023: Trident Seafood Corporation has collaborated with Copper River Prince William Sound Marketing Association to introduce new Prized Fish product range in the United Staes Market.April 2023: Inland Seafood opened a new facility of its own in Jefferson Parish. They invested approximately USD 4 million in order to purchase and renovate a 14,000-square-foot facility in Elmwood, bringing 55 jobs to Jefferson Parish.January 2023: In order to expand their operations in the western part of the United States Inland Seafood acquired Texas-based Lonestar Seafood. The Texas-based supplier is famous for the quality of lobsters they supply.
9. What pricing options are available for accessing the report?
Pricing options include single-user, multi-user, and enterprise licenses priced at USD 3800, USD 4500, and USD 5800 respectively.
10. Is the market size provided in terms of value or volume?
The market size is provided in terms of value, measured in Million.
11. Are there any specific market keywords associated with the report?
Yes, the market keyword associated with the report is "Fish and Seafood Industry in US," which aids in identifying and referencing the specific market segment covered.
12. How do I determine which pricing option suits my needs best?
The pricing options vary based on user requirements and access needs. Individual users may opt for single-user licenses, while businesses requiring broader access may choose multi-user or enterprise licenses for cost-effective access to the report.
13. Are there any additional resources or data provided in the Fish and Seafood Industry in US report?
While the report offers comprehensive insights, it's advisable to review the specific contents or supplementary materials provided to ascertain if additional resources or data are available.
14. How can I stay updated on further developments or reports in the Fish and Seafood Industry in US?
To stay informed about further developments, trends, and reports in the Fish and Seafood Industry in US, consider subscribing to industry newsletters, following relevant companies and organizations, or regularly checking reputable industry news sources and publications.
Methodology
Step 1 - Identification of Relevant Samples Size from Population Database


Step 2 - Approaches for Defining Global Market Size (Value, Volume* & Price*)

Note*: In applicable scenarios
Step 3 - Data Sources
Primary Research
- Web Analytics
- Survey Reports
- Research Institute
- Latest Research Reports
- Opinion Leaders
Secondary Research
- Annual Reports
- White Paper
- Latest Press Release
- Industry Association
- Paid Database
- Investor Presentations

Step 4 - Data Triangulation
Involves using different sources of information in order to increase the validity of a study
These sources are likely to be stakeholders in a program - participants, other researchers, program staff, other community members, and so on.
Then we put all data in single framework & apply various statistical tools to find out the dynamic on the market.
During the analysis stage, feedback from the stakeholder groups would be compared to determine areas of agreement as well as areas of divergence


