Key Insights
The Philippine food service industry is projected to reach 12.64 million by 2025, driven by a compound annual growth rate (CAGR) of 15.1%. This expansion is fueled by a growing young demographic, increasing disposable incomes, and rapid urbanization, leading to diverse culinary preferences and consumption patterns. Dominant players like Jollibee Foods Corporation and Golden Arches Development Corporation underscore brand loyalty, while a substantial number of independent establishments signal a thriving market for niche businesses. Key growth segments include quick-service restaurants (QSRs), cafes, and bars, catering to a wide range of consumer needs and budgets. Leisure and tourism are significant drivers, amplified by increased domestic and international travel. Despite challenges like inflation and market competition, the industry's fundamental growth trajectory remains robust. Evolving consumer behaviors, including a rise in online ordering and delivery, alongside a growing emphasis on hygiene and sustainability, are shaping the sector's future. The forecast period (2025-2033) anticipates sustained expansion, with strategic investments and innovation pivotal for market leadership.
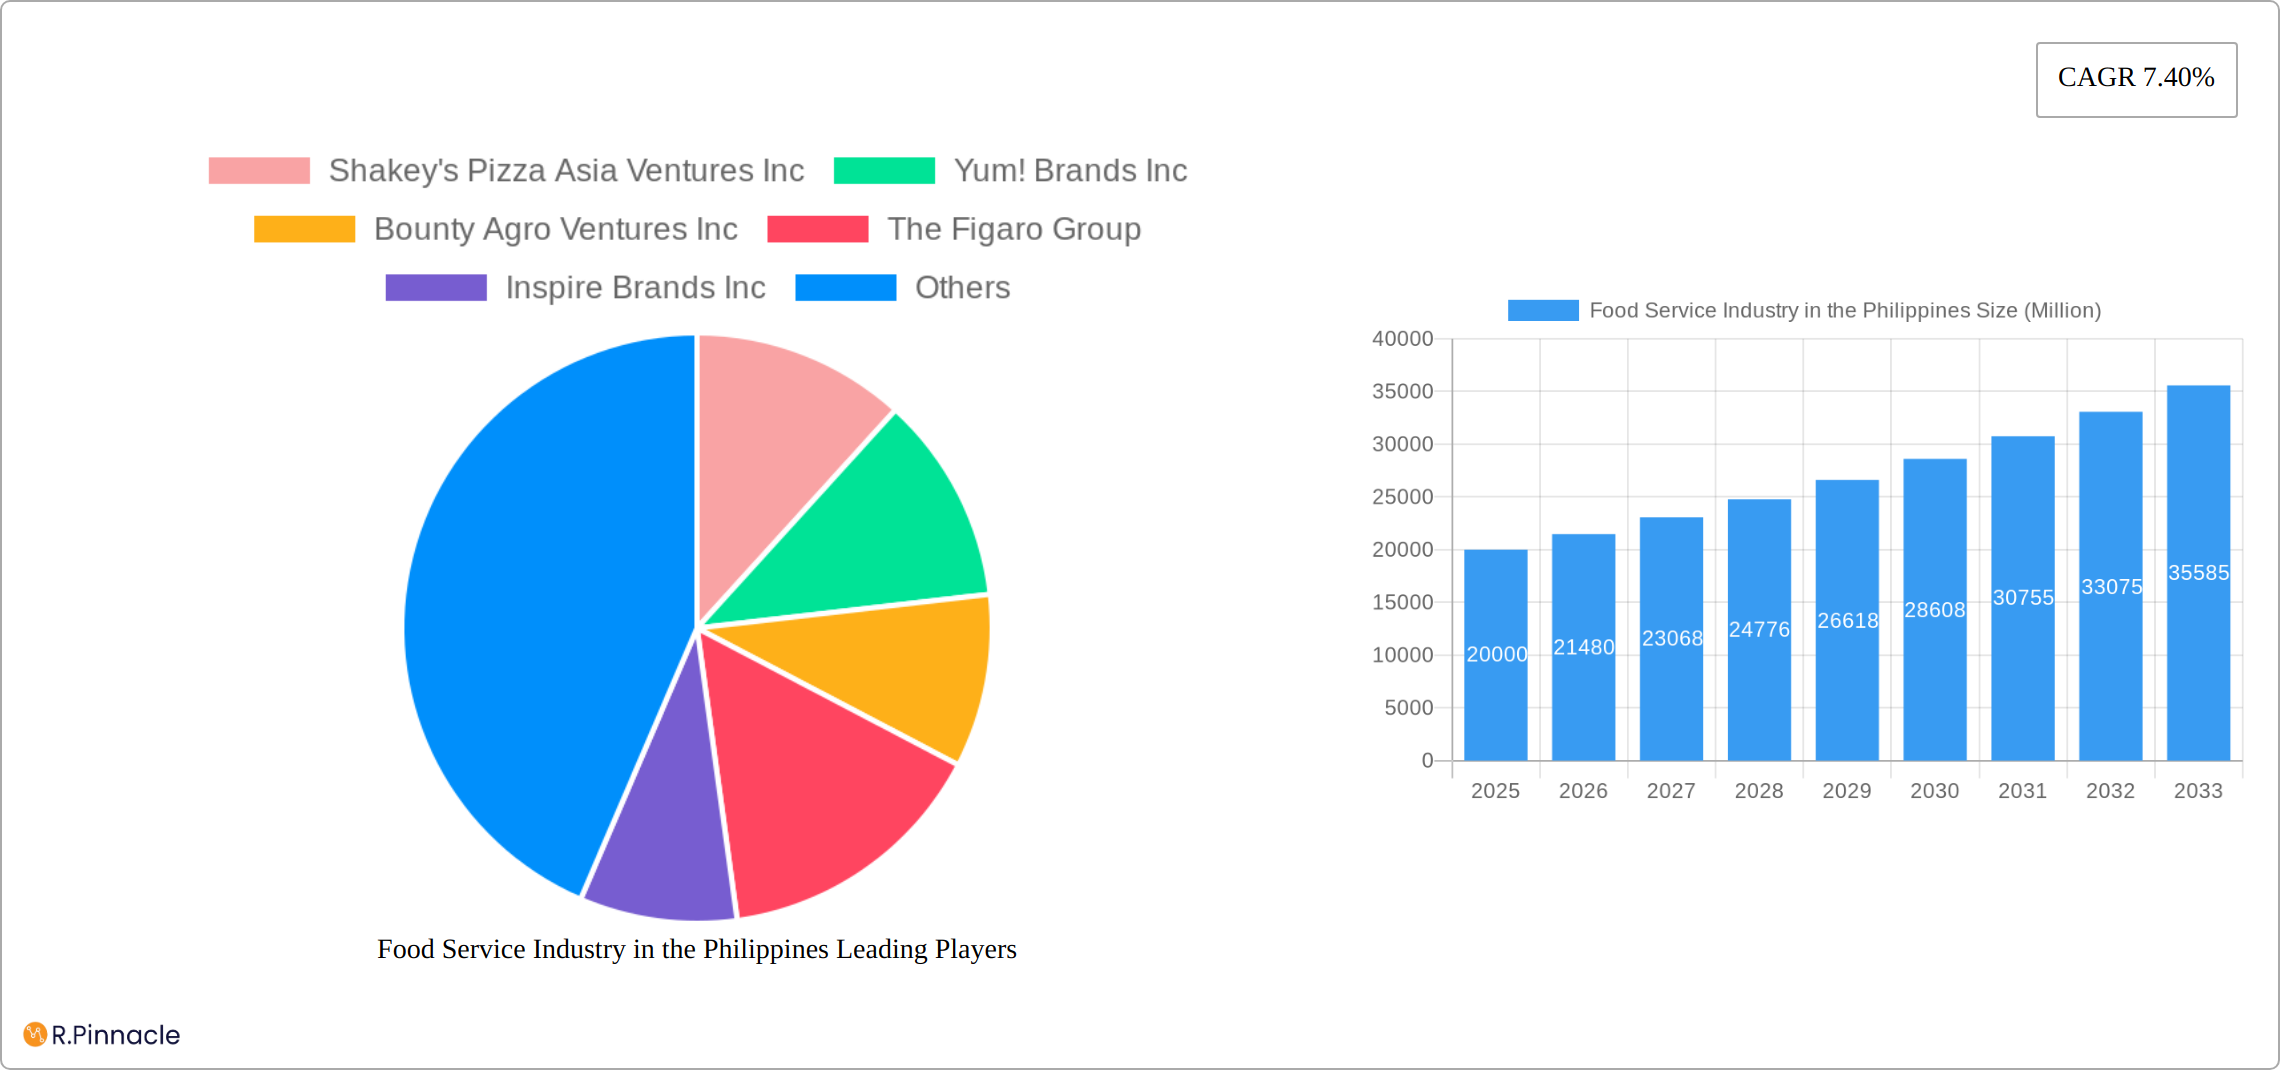
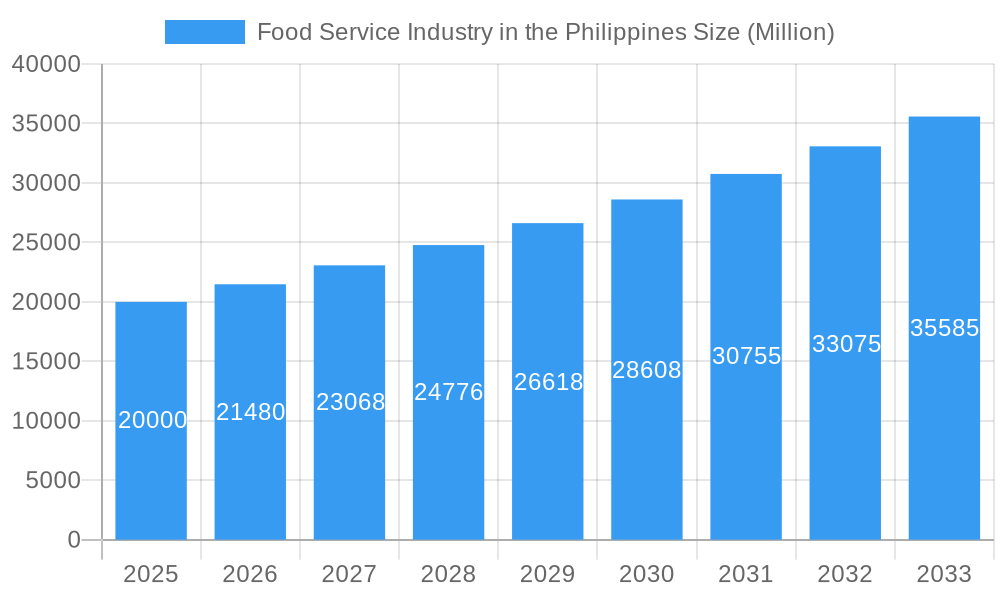
Food Service Industry in the Philippines Market Size (In Million)
Industry segmentation offers critical insights into growth opportunities. Location-based analysis highlights the strategic importance of high-traffic areas such as leisure destinations, hospitality venues, and retail centers. The "Foodservice Type" segment reveals a growing appetite for diverse global cuisines beyond traditional Filipino offerings. The co-existence of both chained and independent outlets reflects varied market strategies and competitive dynamics. While specific regional data would enhance granular analysis, current trends strongly indicate a positive outlook for the Philippines' food service sector, attracting both domestic and international investment. Future research should prioritize detailed regional data to optimize business strategies within this dynamic market.
Food Service Industry in the Philippines Company Market Share
This report delivers a comprehensive analysis of the Philippine food service industry, providing essential insights for investors, industry professionals, and strategic planners. Covering the period 2019-2033 with a focus on the 2025 market size estimate, it forecasts key trends and growth opportunities through extensive data analysis. Identify leading companies, emerging segments, and critical challenges within this dynamic market. The total market value is projected at 12.64 million in 2025.
Food Service Industry in the Philippines Market Structure & Innovation Trends
This section analyzes the competitive landscape, innovative forces, regulatory environment, and market dynamics of the Philippine food service industry. The market is characterized by a mix of international chains and homegrown brands, leading to diverse offerings.
Market Concentration: Jollibee Foods Corporation and Golden Arches Development Corporation (McDonald's) hold significant market share, while other players like Shakey's Pizza Asia Ventures Inc. and Max's Group Inc. contribute substantially. The combined market share of the top five players is estimated at xx%. Smaller independent outlets constitute a substantial portion of the market.
Innovation Drivers: Consumer demand for diverse cuisines, health-conscious options, and convenient services drives innovation. Technological advancements, including online ordering and delivery platforms, are significantly impacting the sector.
Regulatory Framework: The regulatory environment plays a crucial role, affecting food safety standards, licensing, and operational procedures. Changes in regulations can influence market dynamics and profitability.
Product Substitutes: Home-cooked meals and ready-to-eat options pose a competitive threat to the food service industry.
End-User Demographics: The growing young adult population with high disposable income fuels demand in the quick-service restaurant (QSR) segment. Changing lifestyles and preferences are influencing food choices, driving demand for diverse and convenient offerings.
M&A Activities: The food service industry in the Philippines has witnessed significant mergers and acquisitions (M&A) activity in recent years, with deals valued at approximately xx Million in the last five years. These activities have involved both domestic and international players consolidating market share and expanding their reach. Examples include [mention specific M&A examples if available, otherwise provide predicted examples].
Food Service Industry in the Philippines Market Dynamics & Trends
The Philippine food service market is a vibrant and rapidly evolving landscape, shaped by a complex interplay of market dynamics and emerging trends. This section delves into the key factors driving growth, the impact of technological disruptions, shifting consumer preferences, and the competitive pressures defining this dynamic sector.
Robust growth in the Philippine food service industry is fueled by several interconnected factors. A burgeoning young population with rising disposable incomes is a significant contributor, translating into increased spending on dining experiences. Rapid urbanization continues to concentrate populations in urban centers, creating a higher density of potential customers and fueling demand for convenient dining options. The increasing popularity of casual dining and quick-service restaurants (QSRs) reflects busy lifestyles and the convenience-seeking nature of modern consumers. This trend is further amplified by the proliferation of online food delivery platforms, significantly expanding reach and accessibility. Quantitatively, the market exhibited a CAGR of [Insert precise CAGR for 2019-2024]% during the historical period (2019-2024) and is projected to maintain a CAGR of [Insert precise CAGR for 2025-2033]% during the forecast period (2025-2033). However, this growth is not without challenges. Intense competition, both from established players and new entrants, necessitates continuous innovation and strategic adaptation. The evolving preferences of Filipino consumers, who increasingly prioritize healthier options, personalized experiences, and sustainable practices, demand a flexible and responsive approach from food service businesses. Furthermore, macroeconomic factors such as economic fluctuations, tourism patterns, and evolving government regulations contribute to the overall market complexity.
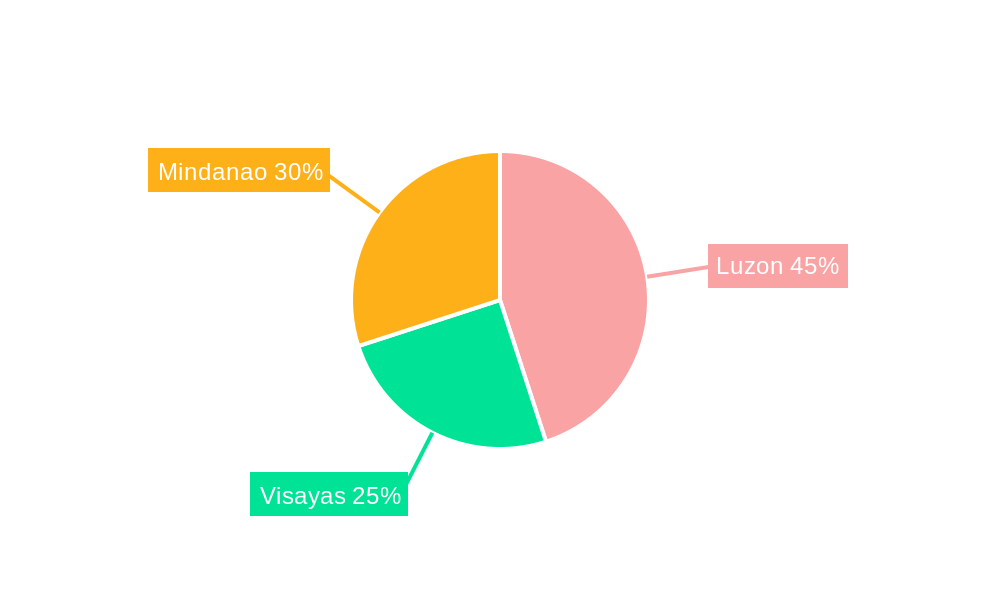
Dominant Regions & Segments in Food Service Industry in the Philippines
This section identifies the leading regions and segments within the Philippine food service market.
Dominant Regions: Metro Manila and other major urban centers, due to high population density, disposable income, and tourist traffic, significantly contribute to market dominance. The presence of established brands and extensive infrastructure enhances their leading position.
- Key Drivers:
- High population density and purchasing power
- Robust tourism sector
- Well-developed infrastructure supporting the sector
Dominant Segments:
- Location: Retail and Standalone outlets hold significant market share due to easy accessibility and widespread availability.
- Foodservice Type: QSR cuisines, particularly Filipino and Western-style fast food, dominate, owing to their affordability and popularity.
- Outlet: Chained outlets, due to brand recognition, consistency, and marketing capabilities, contribute significantly to overall market share.
Further analysis reveals that the combination of Retail location, QSR cuisine, and Chained Outlets represents the most dominant segment, accounting for an estimated xx% of the total market value in 2025. Detailed analysis of each segment is provided in the following section.
Food Service Industry in the Philippines Product Innovations
The Philippine food service sector is characterized by a dynamic landscape of product innovation. This includes the introduction of exciting fusion cuisines that blend traditional Filipino flavors with international culinary influences, appealing to diverse palates. The growing emphasis on health and wellness is reflected in the increasing availability of healthier menu options, catering to the rising health consciousness among consumers. Technological advancements, particularly in online ordering and delivery platforms, have streamlined operational efficiency and improved customer convenience. Beyond mere transactions, the industry is focusing on enhancing customer engagement through personalized experiences, loyalty programs, and customized offerings designed to foster long-term relationships and build brand loyalty. These innovations are proving crucial in differentiating businesses and securing a competitive advantage in a crowded marketplace.
Report Scope & Segmentation Analysis
This report provides a comprehensive segmentation of the Philippine food service market, categorized by location (Leisure, Lodging, Retail, Standalone, Travel), food service type (Cafes & Bars, Other QSR Cuisines), and outlet type (Chained Outlets, Independent Outlets). Detailed growth projections and market size estimations are provided for each segment, highlighting the competitive dynamics and prevailing trends within each category. A nuanced understanding of these segments reveals diverse growth trajectories and competitive landscapes, reflecting varying consumer preferences and market structures. For instance, the Leisure segment is poised for significant growth fueled by the burgeoning tourism industry, while Chained Outlets benefit from established brand recognition and economies of scale. Conversely, Independent Outlets may experience comparatively slower growth due to resource constraints and limitations in marketing reach. The full report includes a detailed analysis of market sizes and growth projections for each segment, providing valuable insights for strategic decision-making.
Key Drivers of Food Service Industry in the Philippines Growth
The remarkable growth trajectory of the Philippine food service industry is driven by a confluence of powerful factors. A rapidly expanding young population with increasing disposable incomes represents a significant engine of growth, leading to higher spending on dining-out experiences. This is further amplified by the trend of rapid urbanization and the concomitant shift in lifestyles, with individuals increasingly opting for convenient dining solutions. Government initiatives aimed at improving infrastructure and promoting tourism also play a pivotal role in stimulating growth within the sector. These combined forces create a fertile environment for sustained expansion.
Challenges in the Food Service Industry in the Philippines Sector
The industry faces challenges such as high operating costs, including labor costs and increasing food prices, which affect profit margins. Competition, both from established players and new entrants, is intense. Maintaining food safety standards and complying with regulatory requirements poses a challenge. Supply chain disruptions can also significantly impact operations and profitability.
Emerging Opportunities in Food Service Industry in the Philippines
Numerous opportunities abound for businesses seeking to capitalize on the growth potential of the Philippine food service industry. These include expanding into currently underserved markets, offering specialized cuisines that cater to niche preferences, focusing on healthy and sustainable options to align with evolving consumer values, and integrating advanced technologies to enhance the overall customer experience. The continuing rise of food delivery services presents a significant avenue for expansion, while leveraging digital marketing and loyalty programs offers powerful tools for improving customer engagement and retention, ensuring sustained success in this competitive environment.
Leading Players in the Food Service Industry in the Philippines Market
- Jollibee Foods Corporation
- Golden Arches Development Corporation
- Shakey's Pizza Asia Ventures Inc
- Yum! Brands Inc
- Bounty Agro Ventures Inc
- The Figaro Group
- Inspire Brands Inc
- Seven & I Holdings Co Ltd
- Mary Grace Foods Inc
- Maxs Group Inc
- Udenna Group
- Domino's Pizza Inc
- Berjaya Corporation Bhd
- Starbucks Corporation
- Restaurant Brands International Inc
Key Developments in Food Service Industry in the Philippines Industry
- October 2023: Starbucks launched two new ice cream-based drinks in the Philippines, enhancing its menu offerings and potentially attracting new customer segments.
- May 2023: Inspire Brands, Inc. expanded its Butternut portfolio with six new butter variants, catering to diverse consumer preferences and potentially increasing market share.
- April 2023: The Figaro Coffee Group launched Cafe Portofino, a new café concept, aiming to diversify its brand portfolio and appeal to a broader customer base. These developments highlight the industry's dynamism and its ongoing efforts to innovate and meet changing consumer demands.
Future Outlook for Food Service Industry in the Philippines Market
The future outlook for the Philippine food service industry remains positive, with continued growth projected. Strategic investments in technology, innovative menu offerings, and expansion into new markets will be crucial for success. Companies that adapt to evolving consumer preferences, such as a focus on healthy options and personalized experiences, are expected to gain a competitive edge. The industry's growth will be influenced by factors such as economic stability, tourism trends, and regulatory changes. The overall market is poised for significant expansion, presenting lucrative opportunities for both established players and new entrants.
Food Service Industry in the Philippines Segmentation
-
1. Foodservice Type
-
1.1. Cafes & Bars
-
1.1.1. By Cuisine
- 1.1.1.1. Bars & Pubs
- 1.1.1.2. Juice/Smoothie/Desserts Bars
- 1.1.1.3. Specialist Coffee & Tea Shops
-
1.1.1. By Cuisine
- 1.2. Cloud Kitchen
-
1.3. Full Service Restaurants
- 1.3.1. Asian
- 1.3.2. European
- 1.3.3. Latin American
- 1.3.4. Middle Eastern
- 1.3.5. North American
- 1.3.6. Other FSR Cuisines
-
1.4. Quick Service Restaurants
- 1.4.1. Bakeries
- 1.4.2. Burger
- 1.4.3. Ice Cream
- 1.4.4. Meat-based Cuisines
- 1.4.5. Pizza
- 1.4.6. Other QSR Cuisines
-
1.1. Cafes & Bars
-
2. Outlet
- 2.1. Chained Outlets
- 2.2. Independent Outlets
-
3. Location
- 3.1. Leisure
- 3.2. Lodging
- 3.3. Retail
- 3.4. Standalone
- 3.5. Travel
Food Service Industry in the Philippines Segmentation By Geography
-
1. North America
- 1.1. United States
- 1.2. Canada
- 1.3. Mexico
-
2. South America
- 2.1. Brazil
- 2.2. Argentina
- 2.3. Rest of South America
-
3. Europe
- 3.1. United Kingdom
- 3.2. Germany
- 3.3. France
- 3.4. Italy
- 3.5. Spain
- 3.6. Russia
- 3.7. Benelux
- 3.8. Nordics
- 3.9. Rest of Europe
-
4. Middle East & Africa
- 4.1. Turkey
- 4.2. Israel
- 4.3. GCC
- 4.4. North Africa
- 4.5. South Africa
- 4.6. Rest of Middle East & Africa
-
5. Asia Pacific
- 5.1. China
- 5.2. India
- 5.3. Japan
- 5.4. South Korea
- 5.5. ASEAN
- 5.6. Oceania
- 5.7. Rest of Asia Pacific
Food Service Industry in the Philippines Regional Market Share
Geographic Coverage of Food Service Industry in the Philippines
Food Service Industry in the Philippines REPORT HIGHLIGHTS
| Aspects | Details |
|---|---|
| Study Period | 2020-2034 |
| Base Year | 2025 |
| Estimated Year | 2026 |
| Forecast Period | 2026-2034 |
| Historical Period | 2020-2025 |
| Growth Rate | CAGR of 15.1% from 2020-2034 |
| Segmentation |
|
Table of Contents
- 1. Introduction
- 1.1. Research Scope
- 1.2. Market Segmentation
- 1.3. Research Methodology
- 1.4. Definitions and Assumptions
- 2. Executive Summary
- 2.1. Introduction
- 3. Market Dynamics
- 3.1. Introduction
- 3.2. Market Drivers
- 3.2.1. Rising Trend of Ingestible Beauty Products; Growing demand for Nutrient-Enriched Cosmetic Products
- 3.3. Market Restrains
- 3.3.1. Availability of Counterfeit Beauty Supplements Products
- 3.4. Market Trends
- 3.4.1. Quick service restaurants held a dominating share in the market owing expansion of franchise outlets and menu innovations
- 4. Market Factor Analysis
- 4.1. Porters Five Forces
- 4.2. Supply/Value Chain
- 4.3. PESTEL analysis
- 4.4. Market Entropy
- 4.5. Patent/Trademark Analysis
- 5. Global Food Service Industry in the Philippines Analysis, Insights and Forecast, 2020-2032
- 5.1. Market Analysis, Insights and Forecast - by Foodservice Type
- 5.1.1. Cafes & Bars
- 5.1.1.1. By Cuisine
- 5.1.1.1.1. Bars & Pubs
- 5.1.1.1.2. Juice/Smoothie/Desserts Bars
- 5.1.1.1.3. Specialist Coffee & Tea Shops
- 5.1.1.1. By Cuisine
- 5.1.2. Cloud Kitchen
- 5.1.3. Full Service Restaurants
- 5.1.3.1. Asian
- 5.1.3.2. European
- 5.1.3.3. Latin American
- 5.1.3.4. Middle Eastern
- 5.1.3.5. North American
- 5.1.3.6. Other FSR Cuisines
- 5.1.4. Quick Service Restaurants
- 5.1.4.1. Bakeries
- 5.1.4.2. Burger
- 5.1.4.3. Ice Cream
- 5.1.4.4. Meat-based Cuisines
- 5.1.4.5. Pizza
- 5.1.4.6. Other QSR Cuisines
- 5.1.1. Cafes & Bars
- 5.2. Market Analysis, Insights and Forecast - by Outlet
- 5.2.1. Chained Outlets
- 5.2.2. Independent Outlets
- 5.3. Market Analysis, Insights and Forecast - by Location
- 5.3.1. Leisure
- 5.3.2. Lodging
- 5.3.3. Retail
- 5.3.4. Standalone
- 5.3.5. Travel
- 5.4. Market Analysis, Insights and Forecast - by Region
- 5.4.1. North America
- 5.4.2. South America
- 5.4.3. Europe
- 5.4.4. Middle East & Africa
- 5.4.5. Asia Pacific
- 5.1. Market Analysis, Insights and Forecast - by Foodservice Type
- 6. North America Food Service Industry in the Philippines Analysis, Insights and Forecast, 2020-2032
- 6.1. Market Analysis, Insights and Forecast - by Foodservice Type
- 6.1.1. Cafes & Bars
- 6.1.1.1. By Cuisine
- 6.1.1.1.1. Bars & Pubs
- 6.1.1.1.2. Juice/Smoothie/Desserts Bars
- 6.1.1.1.3. Specialist Coffee & Tea Shops
- 6.1.1.1. By Cuisine
- 6.1.2. Cloud Kitchen
- 6.1.3. Full Service Restaurants
- 6.1.3.1. Asian
- 6.1.3.2. European
- 6.1.3.3. Latin American
- 6.1.3.4. Middle Eastern
- 6.1.3.5. North American
- 6.1.3.6. Other FSR Cuisines
- 6.1.4. Quick Service Restaurants
- 6.1.4.1. Bakeries
- 6.1.4.2. Burger
- 6.1.4.3. Ice Cream
- 6.1.4.4. Meat-based Cuisines
- 6.1.4.5. Pizza
- 6.1.4.6. Other QSR Cuisines
- 6.1.1. Cafes & Bars
- 6.2. Market Analysis, Insights and Forecast - by Outlet
- 6.2.1. Chained Outlets
- 6.2.2. Independent Outlets
- 6.3. Market Analysis, Insights and Forecast - by Location
- 6.3.1. Leisure
- 6.3.2. Lodging
- 6.3.3. Retail
- 6.3.4. Standalone
- 6.3.5. Travel
- 6.1. Market Analysis, Insights and Forecast - by Foodservice Type
- 7. South America Food Service Industry in the Philippines Analysis, Insights and Forecast, 2020-2032
- 7.1. Market Analysis, Insights and Forecast - by Foodservice Type
- 7.1.1. Cafes & Bars
- 7.1.1.1. By Cuisine
- 7.1.1.1.1. Bars & Pubs
- 7.1.1.1.2. Juice/Smoothie/Desserts Bars
- 7.1.1.1.3. Specialist Coffee & Tea Shops
- 7.1.1.1. By Cuisine
- 7.1.2. Cloud Kitchen
- 7.1.3. Full Service Restaurants
- 7.1.3.1. Asian
- 7.1.3.2. European
- 7.1.3.3. Latin American
- 7.1.3.4. Middle Eastern
- 7.1.3.5. North American
- 7.1.3.6. Other FSR Cuisines
- 7.1.4. Quick Service Restaurants
- 7.1.4.1. Bakeries
- 7.1.4.2. Burger
- 7.1.4.3. Ice Cream
- 7.1.4.4. Meat-based Cuisines
- 7.1.4.5. Pizza
- 7.1.4.6. Other QSR Cuisines
- 7.1.1. Cafes & Bars
- 7.2. Market Analysis, Insights and Forecast - by Outlet
- 7.2.1. Chained Outlets
- 7.2.2. Independent Outlets
- 7.3. Market Analysis, Insights and Forecast - by Location
- 7.3.1. Leisure
- 7.3.2. Lodging
- 7.3.3. Retail
- 7.3.4. Standalone
- 7.3.5. Travel
- 7.1. Market Analysis, Insights and Forecast - by Foodservice Type
- 8. Europe Food Service Industry in the Philippines Analysis, Insights and Forecast, 2020-2032
- 8.1. Market Analysis, Insights and Forecast - by Foodservice Type
- 8.1.1. Cafes & Bars
- 8.1.1.1. By Cuisine
- 8.1.1.1.1. Bars & Pubs
- 8.1.1.1.2. Juice/Smoothie/Desserts Bars
- 8.1.1.1.3. Specialist Coffee & Tea Shops
- 8.1.1.1. By Cuisine
- 8.1.2. Cloud Kitchen
- 8.1.3. Full Service Restaurants
- 8.1.3.1. Asian
- 8.1.3.2. European
- 8.1.3.3. Latin American
- 8.1.3.4. Middle Eastern
- 8.1.3.5. North American
- 8.1.3.6. Other FSR Cuisines
- 8.1.4. Quick Service Restaurants
- 8.1.4.1. Bakeries
- 8.1.4.2. Burger
- 8.1.4.3. Ice Cream
- 8.1.4.4. Meat-based Cuisines
- 8.1.4.5. Pizza
- 8.1.4.6. Other QSR Cuisines
- 8.1.1. Cafes & Bars
- 8.2. Market Analysis, Insights and Forecast - by Outlet
- 8.2.1. Chained Outlets
- 8.2.2. Independent Outlets
- 8.3. Market Analysis, Insights and Forecast - by Location
- 8.3.1. Leisure
- 8.3.2. Lodging
- 8.3.3. Retail
- 8.3.4. Standalone
- 8.3.5. Travel
- 8.1. Market Analysis, Insights and Forecast - by Foodservice Type
- 9. Middle East & Africa Food Service Industry in the Philippines Analysis, Insights and Forecast, 2020-2032
- 9.1. Market Analysis, Insights and Forecast - by Foodservice Type
- 9.1.1. Cafes & Bars
- 9.1.1.1. By Cuisine
- 9.1.1.1.1. Bars & Pubs
- 9.1.1.1.2. Juice/Smoothie/Desserts Bars
- 9.1.1.1.3. Specialist Coffee & Tea Shops
- 9.1.1.1. By Cuisine
- 9.1.2. Cloud Kitchen
- 9.1.3. Full Service Restaurants
- 9.1.3.1. Asian
- 9.1.3.2. European
- 9.1.3.3. Latin American
- 9.1.3.4. Middle Eastern
- 9.1.3.5. North American
- 9.1.3.6. Other FSR Cuisines
- 9.1.4. Quick Service Restaurants
- 9.1.4.1. Bakeries
- 9.1.4.2. Burger
- 9.1.4.3. Ice Cream
- 9.1.4.4. Meat-based Cuisines
- 9.1.4.5. Pizza
- 9.1.4.6. Other QSR Cuisines
- 9.1.1. Cafes & Bars
- 9.2. Market Analysis, Insights and Forecast - by Outlet
- 9.2.1. Chained Outlets
- 9.2.2. Independent Outlets
- 9.3. Market Analysis, Insights and Forecast - by Location
- 9.3.1. Leisure
- 9.3.2. Lodging
- 9.3.3. Retail
- 9.3.4. Standalone
- 9.3.5. Travel
- 9.1. Market Analysis, Insights and Forecast - by Foodservice Type
- 10. Asia Pacific Food Service Industry in the Philippines Analysis, Insights and Forecast, 2020-2032
- 10.1. Market Analysis, Insights and Forecast - by Foodservice Type
- 10.1.1. Cafes & Bars
- 10.1.1.1. By Cuisine
- 10.1.1.1.1. Bars & Pubs
- 10.1.1.1.2. Juice/Smoothie/Desserts Bars
- 10.1.1.1.3. Specialist Coffee & Tea Shops
- 10.1.1.1. By Cuisine
- 10.1.2. Cloud Kitchen
- 10.1.3. Full Service Restaurants
- 10.1.3.1. Asian
- 10.1.3.2. European
- 10.1.3.3. Latin American
- 10.1.3.4. Middle Eastern
- 10.1.3.5. North American
- 10.1.3.6. Other FSR Cuisines
- 10.1.4. Quick Service Restaurants
- 10.1.4.1. Bakeries
- 10.1.4.2. Burger
- 10.1.4.3. Ice Cream
- 10.1.4.4. Meat-based Cuisines
- 10.1.4.5. Pizza
- 10.1.4.6. Other QSR Cuisines
- 10.1.1. Cafes & Bars
- 10.2. Market Analysis, Insights and Forecast - by Outlet
- 10.2.1. Chained Outlets
- 10.2.2. Independent Outlets
- 10.3. Market Analysis, Insights and Forecast - by Location
- 10.3.1. Leisure
- 10.3.2. Lodging
- 10.3.3. Retail
- 10.3.4. Standalone
- 10.3.5. Travel
- 10.1. Market Analysis, Insights and Forecast - by Foodservice Type
- 11. Competitive Analysis
- 11.1. Global Market Share Analysis 2025
- 11.2. Company Profiles
- 11.2.1 Shakey's Pizza Asia Ventures Inc
- 11.2.1.1. Overview
- 11.2.1.2. Products
- 11.2.1.3. SWOT Analysis
- 11.2.1.4. Recent Developments
- 11.2.1.5. Financials (Based on Availability)
- 11.2.2 Yum! Brands Inc
- 11.2.2.1. Overview
- 11.2.2.2. Products
- 11.2.2.3. SWOT Analysis
- 11.2.2.4. Recent Developments
- 11.2.2.5. Financials (Based on Availability)
- 11.2.3 Bounty Agro Ventures Inc
- 11.2.3.1. Overview
- 11.2.3.2. Products
- 11.2.3.3. SWOT Analysis
- 11.2.3.4. Recent Developments
- 11.2.3.5. Financials (Based on Availability)
- 11.2.4 The Figaro Group
- 11.2.4.1. Overview
- 11.2.4.2. Products
- 11.2.4.3. SWOT Analysis
- 11.2.4.4. Recent Developments
- 11.2.4.5. Financials (Based on Availability)
- 11.2.5 Inspire Brands Inc
- 11.2.5.1. Overview
- 11.2.5.2. Products
- 11.2.5.3. SWOT Analysis
- 11.2.5.4. Recent Developments
- 11.2.5.5. Financials (Based on Availability)
- 11.2.6 Seven & I Holdings Co Ltd
- 11.2.6.1. Overview
- 11.2.6.2. Products
- 11.2.6.3. SWOT Analysis
- 11.2.6.4. Recent Developments
- 11.2.6.5. Financials (Based on Availability)
- 11.2.7 Mary Grace Foods Inc
- 11.2.7.1. Overview
- 11.2.7.2. Products
- 11.2.7.3. SWOT Analysis
- 11.2.7.4. Recent Developments
- 11.2.7.5. Financials (Based on Availability)
- 11.2.8 Jollibee Foods Corporation
- 11.2.8.1. Overview
- 11.2.8.2. Products
- 11.2.8.3. SWOT Analysis
- 11.2.8.4. Recent Developments
- 11.2.8.5. Financials (Based on Availability)
- 11.2.9 Maxs Group Inc
- 11.2.9.1. Overview
- 11.2.9.2. Products
- 11.2.9.3. SWOT Analysis
- 11.2.9.4. Recent Developments
- 11.2.9.5. Financials (Based on Availability)
- 11.2.10 Udenna Group
- 11.2.10.1. Overview
- 11.2.10.2. Products
- 11.2.10.3. SWOT Analysis
- 11.2.10.4. Recent Developments
- 11.2.10.5. Financials (Based on Availability)
- 11.2.11 Golden Arches Development Corporation
- 11.2.11.1. Overview
- 11.2.11.2. Products
- 11.2.11.3. SWOT Analysis
- 11.2.11.4. Recent Developments
- 11.2.11.5. Financials (Based on Availability)
- 11.2.12 Domino's Pizza Inc
- 11.2.12.1. Overview
- 11.2.12.2. Products
- 11.2.12.3. SWOT Analysis
- 11.2.12.4. Recent Developments
- 11.2.12.5. Financials (Based on Availability)
- 11.2.13 Berjaya Corporation Bhd
- 11.2.13.1. Overview
- 11.2.13.2. Products
- 11.2.13.3. SWOT Analysis
- 11.2.13.4. Recent Developments
- 11.2.13.5. Financials (Based on Availability)
- 11.2.14 Starbucks Corporation
- 11.2.14.1. Overview
- 11.2.14.2. Products
- 11.2.14.3. SWOT Analysis
- 11.2.14.4. Recent Developments
- 11.2.14.5. Financials (Based on Availability)
- 11.2.15 Restaurant Brands International Inc
- 11.2.15.1. Overview
- 11.2.15.2. Products
- 11.2.15.3. SWOT Analysis
- 11.2.15.4. Recent Developments
- 11.2.15.5. Financials (Based on Availability)
- 11.2.1 Shakey's Pizza Asia Ventures Inc
List of Figures
- Figure 1: Global Food Service Industry in the Philippines Revenue Breakdown (million, %) by Region 2025 & 2033
- Figure 2: North America Food Service Industry in the Philippines Revenue (million), by Foodservice Type 2025 & 2033
- Figure 3: North America Food Service Industry in the Philippines Revenue Share (%), by Foodservice Type 2025 & 2033
- Figure 4: North America Food Service Industry in the Philippines Revenue (million), by Outlet 2025 & 2033
- Figure 5: North America Food Service Industry in the Philippines Revenue Share (%), by Outlet 2025 & 2033
- Figure 6: North America Food Service Industry in the Philippines Revenue (million), by Location 2025 & 2033
- Figure 7: North America Food Service Industry in the Philippines Revenue Share (%), by Location 2025 & 2033
- Figure 8: North America Food Service Industry in the Philippines Revenue (million), by Country 2025 & 2033
- Figure 9: North America Food Service Industry in the Philippines Revenue Share (%), by Country 2025 & 2033
- Figure 10: South America Food Service Industry in the Philippines Revenue (million), by Foodservice Type 2025 & 2033
- Figure 11: South America Food Service Industry in the Philippines Revenue Share (%), by Foodservice Type 2025 & 2033
- Figure 12: South America Food Service Industry in the Philippines Revenue (million), by Outlet 2025 & 2033
- Figure 13: South America Food Service Industry in the Philippines Revenue Share (%), by Outlet 2025 & 2033
- Figure 14: South America Food Service Industry in the Philippines Revenue (million), by Location 2025 & 2033
- Figure 15: South America Food Service Industry in the Philippines Revenue Share (%), by Location 2025 & 2033
- Figure 16: South America Food Service Industry in the Philippines Revenue (million), by Country 2025 & 2033
- Figure 17: South America Food Service Industry in the Philippines Revenue Share (%), by Country 2025 & 2033
- Figure 18: Europe Food Service Industry in the Philippines Revenue (million), by Foodservice Type 2025 & 2033
- Figure 19: Europe Food Service Industry in the Philippines Revenue Share (%), by Foodservice Type 2025 & 2033
- Figure 20: Europe Food Service Industry in the Philippines Revenue (million), by Outlet 2025 & 2033
- Figure 21: Europe Food Service Industry in the Philippines Revenue Share (%), by Outlet 2025 & 2033
- Figure 22: Europe Food Service Industry in the Philippines Revenue (million), by Location 2025 & 2033
- Figure 23: Europe Food Service Industry in the Philippines Revenue Share (%), by Location 2025 & 2033
- Figure 24: Europe Food Service Industry in the Philippines Revenue (million), by Country 2025 & 2033
- Figure 25: Europe Food Service Industry in the Philippines Revenue Share (%), by Country 2025 & 2033
- Figure 26: Middle East & Africa Food Service Industry in the Philippines Revenue (million), by Foodservice Type 2025 & 2033
- Figure 27: Middle East & Africa Food Service Industry in the Philippines Revenue Share (%), by Foodservice Type 2025 & 2033
- Figure 28: Middle East & Africa Food Service Industry in the Philippines Revenue (million), by Outlet 2025 & 2033
- Figure 29: Middle East & Africa Food Service Industry in the Philippines Revenue Share (%), by Outlet 2025 & 2033
- Figure 30: Middle East & Africa Food Service Industry in the Philippines Revenue (million), by Location 2025 & 2033
- Figure 31: Middle East & Africa Food Service Industry in the Philippines Revenue Share (%), by Location 2025 & 2033
- Figure 32: Middle East & Africa Food Service Industry in the Philippines Revenue (million), by Country 2025 & 2033
- Figure 33: Middle East & Africa Food Service Industry in the Philippines Revenue Share (%), by Country 2025 & 2033
- Figure 34: Asia Pacific Food Service Industry in the Philippines Revenue (million), by Foodservice Type 2025 & 2033
- Figure 35: Asia Pacific Food Service Industry in the Philippines Revenue Share (%), by Foodservice Type 2025 & 2033
- Figure 36: Asia Pacific Food Service Industry in the Philippines Revenue (million), by Outlet 2025 & 2033
- Figure 37: Asia Pacific Food Service Industry in the Philippines Revenue Share (%), by Outlet 2025 & 2033
- Figure 38: Asia Pacific Food Service Industry in the Philippines Revenue (million), by Location 2025 & 2033
- Figure 39: Asia Pacific Food Service Industry in the Philippines Revenue Share (%), by Location 2025 & 2033
- Figure 40: Asia Pacific Food Service Industry in the Philippines Revenue (million), by Country 2025 & 2033
- Figure 41: Asia Pacific Food Service Industry in the Philippines Revenue Share (%), by Country 2025 & 2033
List of Tables
- Table 1: Global Food Service Industry in the Philippines Revenue million Forecast, by Foodservice Type 2020 & 2033
- Table 2: Global Food Service Industry in the Philippines Revenue million Forecast, by Outlet 2020 & 2033
- Table 3: Global Food Service Industry in the Philippines Revenue million Forecast, by Location 2020 & 2033
- Table 4: Global Food Service Industry in the Philippines Revenue million Forecast, by Region 2020 & 2033
- Table 5: Global Food Service Industry in the Philippines Revenue million Forecast, by Foodservice Type 2020 & 2033
- Table 6: Global Food Service Industry in the Philippines Revenue million Forecast, by Outlet 2020 & 2033
- Table 7: Global Food Service Industry in the Philippines Revenue million Forecast, by Location 2020 & 2033
- Table 8: Global Food Service Industry in the Philippines Revenue million Forecast, by Country 2020 & 2033
- Table 9: United States Food Service Industry in the Philippines Revenue (million) Forecast, by Application 2020 & 2033
- Table 10: Canada Food Service Industry in the Philippines Revenue (million) Forecast, by Application 2020 & 2033
- Table 11: Mexico Food Service Industry in the Philippines Revenue (million) Forecast, by Application 2020 & 2033
- Table 12: Global Food Service Industry in the Philippines Revenue million Forecast, by Foodservice Type 2020 & 2033
- Table 13: Global Food Service Industry in the Philippines Revenue million Forecast, by Outlet 2020 & 2033
- Table 14: Global Food Service Industry in the Philippines Revenue million Forecast, by Location 2020 & 2033
- Table 15: Global Food Service Industry in the Philippines Revenue million Forecast, by Country 2020 & 2033
- Table 16: Brazil Food Service Industry in the Philippines Revenue (million) Forecast, by Application 2020 & 2033
- Table 17: Argentina Food Service Industry in the Philippines Revenue (million) Forecast, by Application 2020 & 2033
- Table 18: Rest of South America Food Service Industry in the Philippines Revenue (million) Forecast, by Application 2020 & 2033
- Table 19: Global Food Service Industry in the Philippines Revenue million Forecast, by Foodservice Type 2020 & 2033
- Table 20: Global Food Service Industry in the Philippines Revenue million Forecast, by Outlet 2020 & 2033
- Table 21: Global Food Service Industry in the Philippines Revenue million Forecast, by Location 2020 & 2033
- Table 22: Global Food Service Industry in the Philippines Revenue million Forecast, by Country 2020 & 2033
- Table 23: United Kingdom Food Service Industry in the Philippines Revenue (million) Forecast, by Application 2020 & 2033
- Table 24: Germany Food Service Industry in the Philippines Revenue (million) Forecast, by Application 2020 & 2033
- Table 25: France Food Service Industry in the Philippines Revenue (million) Forecast, by Application 2020 & 2033
- Table 26: Italy Food Service Industry in the Philippines Revenue (million) Forecast, by Application 2020 & 2033
- Table 27: Spain Food Service Industry in the Philippines Revenue (million) Forecast, by Application 2020 & 2033
- Table 28: Russia Food Service Industry in the Philippines Revenue (million) Forecast, by Application 2020 & 2033
- Table 29: Benelux Food Service Industry in the Philippines Revenue (million) Forecast, by Application 2020 & 2033
- Table 30: Nordics Food Service Industry in the Philippines Revenue (million) Forecast, by Application 2020 & 2033
- Table 31: Rest of Europe Food Service Industry in the Philippines Revenue (million) Forecast, by Application 2020 & 2033
- Table 32: Global Food Service Industry in the Philippines Revenue million Forecast, by Foodservice Type 2020 & 2033
- Table 33: Global Food Service Industry in the Philippines Revenue million Forecast, by Outlet 2020 & 2033
- Table 34: Global Food Service Industry in the Philippines Revenue million Forecast, by Location 2020 & 2033
- Table 35: Global Food Service Industry in the Philippines Revenue million Forecast, by Country 2020 & 2033
- Table 36: Turkey Food Service Industry in the Philippines Revenue (million) Forecast, by Application 2020 & 2033
- Table 37: Israel Food Service Industry in the Philippines Revenue (million) Forecast, by Application 2020 & 2033
- Table 38: GCC Food Service Industry in the Philippines Revenue (million) Forecast, by Application 2020 & 2033
- Table 39: North Africa Food Service Industry in the Philippines Revenue (million) Forecast, by Application 2020 & 2033
- Table 40: South Africa Food Service Industry in the Philippines Revenue (million) Forecast, by Application 2020 & 2033
- Table 41: Rest of Middle East & Africa Food Service Industry in the Philippines Revenue (million) Forecast, by Application 2020 & 2033
- Table 42: Global Food Service Industry in the Philippines Revenue million Forecast, by Foodservice Type 2020 & 2033
- Table 43: Global Food Service Industry in the Philippines Revenue million Forecast, by Outlet 2020 & 2033
- Table 44: Global Food Service Industry in the Philippines Revenue million Forecast, by Location 2020 & 2033
- Table 45: Global Food Service Industry in the Philippines Revenue million Forecast, by Country 2020 & 2033
- Table 46: China Food Service Industry in the Philippines Revenue (million) Forecast, by Application 2020 & 2033
- Table 47: India Food Service Industry in the Philippines Revenue (million) Forecast, by Application 2020 & 2033
- Table 48: Japan Food Service Industry in the Philippines Revenue (million) Forecast, by Application 2020 & 2033
- Table 49: South Korea Food Service Industry in the Philippines Revenue (million) Forecast, by Application 2020 & 2033
- Table 50: ASEAN Food Service Industry in the Philippines Revenue (million) Forecast, by Application 2020 & 2033
- Table 51: Oceania Food Service Industry in the Philippines Revenue (million) Forecast, by Application 2020 & 2033
- Table 52: Rest of Asia Pacific Food Service Industry in the Philippines Revenue (million) Forecast, by Application 2020 & 2033
Frequently Asked Questions
1. What is the projected Compound Annual Growth Rate (CAGR) of the Food Service Industry in the Philippines?
The projected CAGR is approximately 15.1%.
2. Which companies are prominent players in the Food Service Industry in the Philippines?
Key companies in the market include Shakey's Pizza Asia Ventures Inc, Yum! Brands Inc, Bounty Agro Ventures Inc, The Figaro Group, Inspire Brands Inc, Seven & I Holdings Co Ltd, Mary Grace Foods Inc, Jollibee Foods Corporation, Maxs Group Inc, Udenna Group, Golden Arches Development Corporation, Domino's Pizza Inc, Berjaya Corporation Bhd, Starbucks Corporation, Restaurant Brands International Inc.
3. What are the main segments of the Food Service Industry in the Philippines?
The market segments include Foodservice Type, Outlet, Location.
4. Can you provide details about the market size?
The market size is estimated to be USD 12.64 million as of 2022.
5. What are some drivers contributing to market growth?
Rising Trend of Ingestible Beauty Products; Growing demand for Nutrient-Enriched Cosmetic Products.
6. What are the notable trends driving market growth?
Quick service restaurants held a dominating share in the market owing expansion of franchise outlets and menu innovations.
7. Are there any restraints impacting market growth?
Availability of Counterfeit Beauty Supplements Products.
8. Can you provide examples of recent developments in the market?
October 2023: Starbucks launched two new drinks with the addition of ice cream in the Philippines.May 2023: Inspire Brands, Inc. launched new butter variants to its Butternut portfolio. These variants include the Plain Butternut, Choco Almond Butternut, Ube Cheese Butternut, Strawberry Butternut, Cheesy Butternut, and Choco Butternut.April 2023: The Figaro Coffee Group increased its brand portfolio and launched a new café concept brand called Cafe Portofino.
9. What pricing options are available for accessing the report?
Pricing options include single-user, multi-user, and enterprise licenses priced at USD 3800, USD 4500, and USD 5800 respectively.
10. Is the market size provided in terms of value or volume?
The market size is provided in terms of value, measured in million.
11. Are there any specific market keywords associated with the report?
Yes, the market keyword associated with the report is "Food Service Industry in the Philippines," which aids in identifying and referencing the specific market segment covered.
12. How do I determine which pricing option suits my needs best?
The pricing options vary based on user requirements and access needs. Individual users may opt for single-user licenses, while businesses requiring broader access may choose multi-user or enterprise licenses for cost-effective access to the report.
13. Are there any additional resources or data provided in the Food Service Industry in the Philippines report?
While the report offers comprehensive insights, it's advisable to review the specific contents or supplementary materials provided to ascertain if additional resources or data are available.
14. How can I stay updated on further developments or reports in the Food Service Industry in the Philippines?
To stay informed about further developments, trends, and reports in the Food Service Industry in the Philippines, consider subscribing to industry newsletters, following relevant companies and organizations, or regularly checking reputable industry news sources and publications.
Methodology
Step 1 - Identification of Relevant Samples Size from Population Database


Step 2 - Approaches for Defining Global Market Size (Value, Volume* & Price*)

Note*: In applicable scenarios
Step 3 - Data Sources
Primary Research
- Web Analytics
- Survey Reports
- Research Institute
- Latest Research Reports
- Opinion Leaders
Secondary Research
- Annual Reports
- White Paper
- Latest Press Release
- Industry Association
- Paid Database
- Investor Presentations

Step 4 - Data Triangulation
Involves using different sources of information in order to increase the validity of a study
These sources are likely to be stakeholders in a program - participants, other researchers, program staff, other community members, and so on.
Then we put all data in single framework & apply various statistical tools to find out the dynamic on the market.
During the analysis stage, feedback from the stakeholder groups would be compared to determine areas of agreement as well as areas of divergence

