

Key Insights
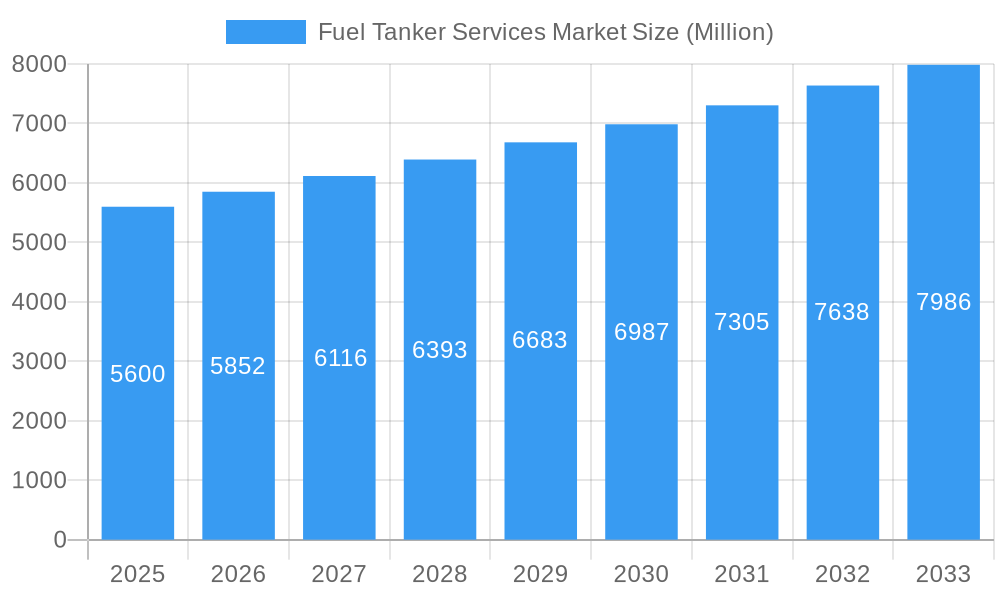
The global Fuel Tanker Services market, valued at $5.60 billion in 2025, is projected to experience robust growth, driven by increasing global fuel demand and expanding transportation infrastructure. A Compound Annual Growth Rate (CAGR) of 4.50% from 2025 to 2033 indicates a significant market expansion. Key growth drivers include rising urbanization and industrialization, leading to higher fuel consumption across various sectors. The increasing adoption of LNG as a cleaner fuel source is also contributing to market growth, particularly in regions with stringent environmental regulations. Market segmentation reveals that larger capacity tankers (above 40,000 liters) are gaining traction due to economies of scale, while the demand for stainless steel and aluminum alloy tankers is rising due to their corrosion resistance and suitability for specific fuel types. Retail petrol companies constitute a significant portion of the market, alongside refineries, underscoring the importance of efficient fuel transportation throughout the supply chain. Regional analysis shows that North America and Asia Pacific are major market players, fueled by their substantial economies and energy consumption levels. However, market growth may face certain challenges such as fluctuating fuel prices, stringent safety regulations, and geopolitical uncertainties, all of which could impact investment and operations in this sector.
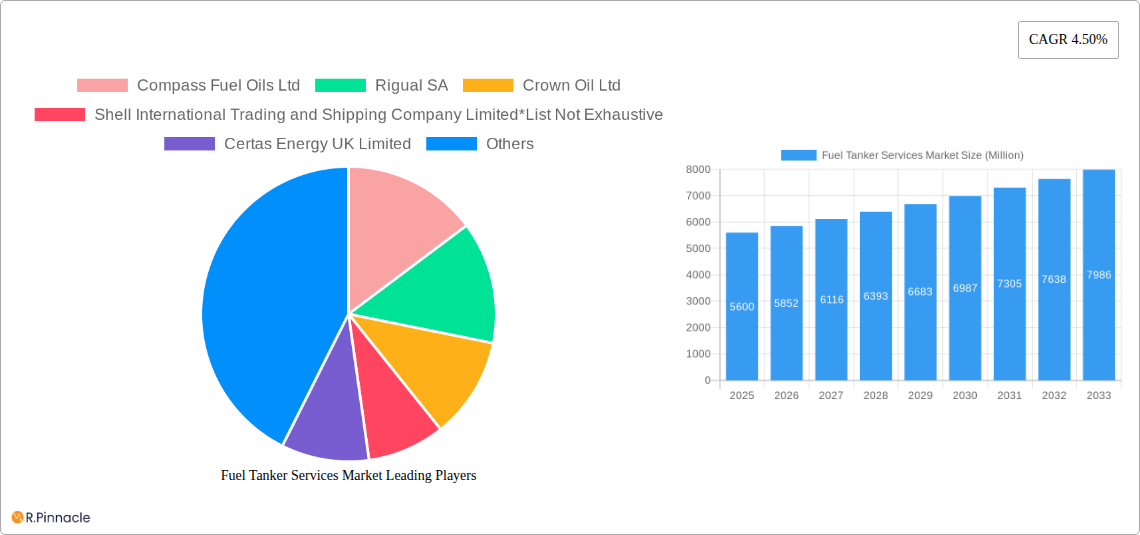
Fuel Tanker Services Market Market Size (In Billion)
The competitive landscape is characterized by a mix of established international players and regional operators. Companies like Compass Fuel Oils Ltd, Rigual SA, Crown Oil Ltd, Shell International Trading and Shipping Company Limited, and Certas Energy UK Limited are key participants. However, the market is likely to see increased competition from new entrants and mergers and acquisitions, driving innovation and efficiency improvements. The expansion of fuel transportation networks, particularly in developing economies, presents significant opportunities for growth. Further market segmentation based on factors such as distance traveled, fuel type hauled, and specialized tanker services will further enhance industry insights and enable more targeted strategic decisions. Advanced technologies such as GPS tracking, telematics, and predictive maintenance are expected to become increasingly integrated into fuel tanker services, improving operational efficiency and safety.
Fuel Tanker Services Market Company Market Share
Fuel Tanker Services Market: A Comprehensive Report (2019-2033)
This in-depth report provides a comprehensive analysis of the Fuel Tanker Services Market, offering invaluable insights for industry professionals, investors, and strategic decision-makers. The study covers the period from 2019 to 2033, with a focus on the forecast period from 2025 to 2033 and a base year of 2025. The report segments the market by capacity (Below 20000 Liters, 30000 - 40000 Liters, Above 40000 Liters), fuel type (Petrol, LNG, Other Fuels), operator (Retail Petrol Companies, Refineries), and material type (Carbon Steel, Stainless Steel, Aluminum Alloy), providing a granular understanding of market dynamics. Key players analyzed include Compass Fuel Oils Ltd, Rigual SA, Crown Oil Ltd, Shell International Trading and Shipping Company Limited, Certas Energy UK Limited, and others.
Fuel Tanker Services Market Structure & Innovation Trends
This section analyzes the competitive landscape of the Fuel Tanker Services Market, exploring market concentration, innovation drivers, regulatory frameworks, and mergers & acquisitions (M&A) activity. The market is moderately concentrated, with a few major players holding significant market share. However, the presence of numerous smaller operators indicates a competitive environment. Innovation is driven by the need for improved fuel efficiency, enhanced safety features, and sustainable transportation solutions. Stringent regulatory frameworks concerning emissions and safety standards significantly impact market operations. Product substitutes, such as pipelines and rail transport, pose a challenge, while the adoption of new materials and technologies presents opportunities for growth.
- Market Share: The top 5 players hold an estimated xx% market share in 2025.
- M&A Activity: Total M&A deal value in the historical period (2019-2024) is estimated at $xx Million. Recent deals like Compass Fuel Oils Ltd.'s acquisition reflect a trend of consolidation.
- Regulatory landscape: Stringent environmental regulations are driving demand for cleaner fuel transportation solutions.
Fuel Tanker Services Market Dynamics & Trends
The Fuel Tanker Services Market is experiencing significant growth, driven by increasing global fuel demand, expanding infrastructure development in emerging economies, and rising transportation needs. Technological advancements in fuel tanker design, materials, and safety systems are shaping market dynamics. Consumer preference for efficient and environmentally friendly fuel transportation is influencing market trends. The competitive landscape is characterized by intense rivalry among established players and the emergence of new entrants. The market is projected to witness a CAGR of xx% during the forecast period (2025-2033). Market penetration of advanced fuel tankers is expected to reach xx% by 2033.
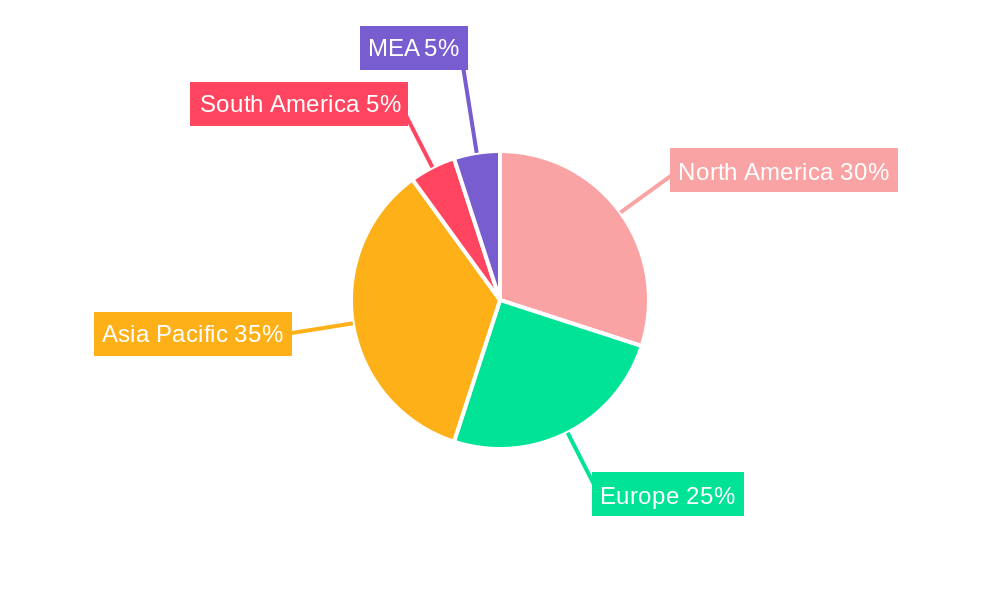
Dominant Regions & Segments in Fuel Tanker Services Market
The Fuel Tanker Services Market is geographically diverse, with significant regional variations in market size and growth rates. While specific regional dominance data requires further analysis for this report, the market is expected to be dominated by regions with robust economies and established fuel infrastructure. Within segments, the "Above 40000 Liters" capacity segment holds a significant market share due to economies of scale and long-haul transportation requirements. Petrol remains the dominant fuel type, although the LNG segment is experiencing notable growth, fueled by increasing environmental concerns. Refineries account for a substantial share of the operator segment. Carbon steel remains the prevalent material due to its cost-effectiveness, although stainless steel and aluminum alloys are gaining traction due to their corrosion resistance and lightweight properties.
- Key Drivers (Europe): Strong industrial output, efficient logistics networks.
- Key Drivers (North America): Growing demand from the oil and gas sector.
- Key Drivers (Asia Pacific): Rapid industrialization, infrastructure development.
Fuel Tanker Services Market Product Innovations
Recent product innovations focus on improving fuel efficiency, safety, and environmental performance. Advanced materials like lightweight alloys are being incorporated to reduce fuel consumption, while sophisticated safety systems enhance operational reliability. The integration of telematics and IoT technologies provides real-time monitoring and data analysis capabilities. These innovations align with the growing demand for sustainable and efficient fuel transportation solutions.
Report Scope & Segmentation Analysis
This comprehensive report delves into the intricacies of the Fuel Tanker Services Market, meticulously segmenting it by key parameters: capacity, fuel type, operator, and material type. For each segment, we offer granular data on market size, projected growth trajectories, and a thorough analysis of competitive landscapes. For instance, the "Below 20,000 Liters" capacity segment is notably characterized by a high degree of competition and a wide spectrum of applications, from local distribution to specialized industrial needs. In terms of fuel type, "Petrol" currently holds a dominant position, fueling a significant portion of market activity. However, emerging segments such as "LNG" and "Other Fuels" present substantial untapped growth potential, driven by evolving energy landscapes and regulatory shifts. The "Refineries" operator segment commands a significant market share, reflecting its central role in the fuel supply chain. Material-wise, "Carbon Steel" continues to be the prevalent choice due to its inherent cost-effectiveness. Nevertheless, segments like "Stainless Steel" and "Aluminum Alloy" are demonstrating steady growth, primarily propelled by specific application requirements such as enhanced durability, corrosion resistance, and weight optimization for specialized fuel types.
Key Drivers of Fuel Tanker Services Market Growth
The growth of the Fuel Tanker Services Market is primarily propelled by factors such as increasing global energy demand, continuous infrastructure development, and stringent regulations promoting efficient and safe fuel transportation. Technological advancements, including the use of advanced materials and IoT integration, are improving fuel efficiency and operational safety. Favorable economic policies in various regions further contribute to market expansion.
Challenges in the Fuel Tanker Services Market Sector
The Fuel Tanker Services Market is navigating a complex landscape of challenges that significantly influence its operational efficiency and profitability. Paramount among these are the inherent volatilities in fuel prices, which directly impact operational costs and pricing strategies. Furthermore, the ever-evolving and increasingly stringent environmental regulations necessitate continuous investment in compliance, fleet modernization, and sustainable practices, adding to the operational burden. The market also grapples with intense competition, leading to price pressures and the constant need for service differentiation. Beyond these, supply chain disruptions, exacerbated by geopolitical events or logistical bottlenecks, can lead to delays and increased costs. Fluctuating demand patterns, influenced by economic cycles and seasonal variations, further complicate planning and resource allocation. Adding to the operational complexities are rising insurance costs, a significant overhead, and the persistent challenge of securing and retaining skilled labor, including qualified drivers and maintenance personnel, which is crucial for maintaining safety and operational standards. Collectively, these factors create a dynamic and demanding environment for service providers.
Emerging Opportunities in Fuel Tanker Services Market
Emerging opportunities lie in the adoption of sustainable fuels, the integration of advanced technologies, and the expansion into new geographical markets. The growing demand for LNG and other alternative fuels presents a significant growth opportunity. Moreover, the adoption of digital technologies, such as telematics and IoT, enables improved operational efficiency and real-time monitoring, providing a competitive edge.
Leading Players in the Fuel Tanker Services Market Market
- Compass Fuel Oils Ltd
- Rigual SA
- Crown Oil Ltd
- Shell International Trading and Shipping Company Limited
- Certas Energy UK Limited
Key Developments in Fuel Tanker Services Market Industry
- January 2024: Compass Fuel Oils Ltd announced the acquisition of a new Arctic fuel tanker, expanding its fleet and capacity.
- December 2023: ReFuels initiated construction of a new CNG refueling facility, supporting sustainable transportation initiatives.
Future Outlook for Fuel Tanker Services Market Market
The Fuel Tanker Services Market is **poised for robust and sustained growth** in the coming years. This optimistic outlook is primarily fueled by the continuously increasing global energy demand, driven by population growth and economic development across various sectors. Simultaneously, the accelerated adoption of advanced technologies, including telematics for route optimization, real-time tracking for enhanced security and efficiency, and sophisticated fleet management systems, will further streamline operations and improve service delivery. A significant trend shaping the future is the growing emphasis on sustainable transportation solutions. This includes the increasing demand for tankers that can efficiently and safely transport alternative fuels like biofuels, hydrogen, and electric vehicle charging fluids, presenting new market opportunities. Furthermore, the expansion into new and emerging markets, particularly in developing economies with growing industrial and transportation needs, will contribute substantially to market expansion. Strategic initiatives such as strategic partnerships between logistics providers, fuel companies, and technology developers, alongside continuous investment in technological innovations and specialized training programs, will be instrumental for sustained growth and achieving a competitive edge in this dynamic and evolving market landscape.
Fuel Tanker Services Market Segmentation
-
1. Material Type
- 1.1. Carbon Steel
- 1.2. Stainless Steel
- 1.3. Aluminum Alloy
-
2. Capacity
- 2.1. Below 20000 Liters
- 2.2. 30000 - 40000 Liters
- 2.3. Above 40000 Liters
-
3. Fuel Type
- 3.1. Petrol
- 3.2. LNG
- 3.3. Other Fuels
-
4. Operator
- 4.1. Retail Petrol Companies
- 4.2. Refineries
Fuel Tanker Services Market Segmentation By Geography
-
1. North America
- 1.1. United States
- 1.2. Canada
- 1.3. Rest of North America
-
2. Europe
- 2.1. Germany
- 2.2. France
- 2.3. United Kingdom
- 2.4. Italy
- 2.5. Spain
- 2.6. NORDIC
- 2.7. Russia
- 2.8. Rest of Europe
-
3. Asia Pacific
- 3.1. China
- 3.2. India
- 3.3. Australia
- 3.4. Malaysia
- 3.5. Indonesia
- 3.6. Thailand
- 3.7. Vietnam
- 3.8. Rest of Asia Pacific
-
4. Middle East and Africa
- 4.1. Saudi Arabia
- 4.2. United Arab Emirates
- 4.3. South Africa
- 4.4. Nigeria
- 4.5. Rest of Middle East and Africa
- 4.6. Egypt
-
5. South America
- 5.1. Brazil
- 5.2. Argentina
- 5.3. Colombia
- 5.4. Rest of South America
Fuel Tanker Services Market Regional Market Share
Geographic Coverage of Fuel Tanker Services Market
Fuel Tanker Services Market REPORT HIGHLIGHTS
| Aspects | Details |
|---|---|
| Study Period | 2020-2034 |
| Base Year | 2025 |
| Estimated Year | 2026 |
| Forecast Period | 2026-2034 |
| Historical Period | 2020-2025 |
| Growth Rate | CAGR of 4.50% from 2020-2034 |
| Segmentation |
|
Table of Contents
- 1. Introduction
- 1.1. Research Scope
- 1.2. Market Segmentation
- 1.3. Research Objective
- 1.4. Definitions and Assumptions
- 2. Executive Summary
- 2.1. Market Snapshot
- 3. Market Dynamics
- 3.1. Market Drivers
- 3.2. Market Restrains
- 3.3. Market Trends
- 3.4. Market Opportunities
- 4. Market Factor Analysis
- 4.1. Porters Five Forces
- 4.1.1. Bargaining Power of Suppliers
- 4.1.2. Bargaining Power of Buyers
- 4.1.3. Threat of New Entrants
- 4.1.4. Threat of Substitutes
- 4.1.5. Competitive Rivalry
- 4.2. PESTEL analysis
- 4.3. BCG Analysis
- 4.3.1. Stars (High Growth, High Market Share)
- 4.3.2. Cash Cows (Low Growth, High Market Share)
- 4.3.3. Question Mark (High Growth, Low Market Share)
- 4.3.4. Dogs (Low Growth, Low Market Share)
- 4.4. Ansoff Matrix Analysis
- 4.5. Supply Chain Analysis
- 4.6. Regulatory Landscape
- 4.7. Current Market Potential and Opportunity Assessment (TAM–SAM–SOM Framework)
- 4.8. PRI Analyst Note
- 4.1. Porters Five Forces
- 5. Market Analysis, Insights and Forecast 2021-2033
- 5.1. Market Analysis, Insights and Forecast - by Material Type
- 5.1.1. Carbon Steel
- 5.1.2. Stainless Steel
- 5.1.3. Aluminum Alloy
- 5.2. Market Analysis, Insights and Forecast - by Capacity
- 5.2.1. Below 20000 Liters
- 5.2.2. 30000 - 40000 Liters
- 5.2.3. Above 40000 Liters
- 5.3. Market Analysis, Insights and Forecast - by Fuel Type
- 5.3.1. Petrol
- 5.3.2. LNG
- 5.3.3. Other Fuels
- 5.4. Market Analysis, Insights and Forecast - by Operator
- 5.4.1. Retail Petrol Companies
- 5.4.2. Refineries
- 5.5. Market Analysis, Insights and Forecast - by Region
- 5.5.1. North America
- 5.5.2. Europe
- 5.5.3. Asia Pacific
- 5.5.4. Middle East and Africa
- 5.5.5. South America
- 5.1. Market Analysis, Insights and Forecast - by Material Type
- 6. Global Fuel Tanker Services Market Analysis, Insights and Forecast, 2021-2033
- 6.1. Market Analysis, Insights and Forecast - by Material Type
- 6.1.1. Carbon Steel
- 6.1.2. Stainless Steel
- 6.1.3. Aluminum Alloy
- 6.2. Market Analysis, Insights and Forecast - by Capacity
- 6.2.1. Below 20000 Liters
- 6.2.2. 30000 - 40000 Liters
- 6.2.3. Above 40000 Liters
- 6.3. Market Analysis, Insights and Forecast - by Fuel Type
- 6.3.1. Petrol
- 6.3.2. LNG
- 6.3.3. Other Fuels
- 6.4. Market Analysis, Insights and Forecast - by Operator
- 6.4.1. Retail Petrol Companies
- 6.4.2. Refineries
- 6.1. Market Analysis, Insights and Forecast - by Material Type
- 7. North America Fuel Tanker Services Market Analysis, Insights and Forecast, 2020-2032
- 7.1. Market Analysis, Insights and Forecast - by Material Type
- 7.1.1. Carbon Steel
- 7.1.2. Stainless Steel
- 7.1.3. Aluminum Alloy
- 7.2. Market Analysis, Insights and Forecast - by Capacity
- 7.2.1. Below 20000 Liters
- 7.2.2. 30000 - 40000 Liters
- 7.2.3. Above 40000 Liters
- 7.3. Market Analysis, Insights and Forecast - by Fuel Type
- 7.3.1. Petrol
- 7.3.2. LNG
- 7.3.3. Other Fuels
- 7.4. Market Analysis, Insights and Forecast - by Operator
- 7.4.1. Retail Petrol Companies
- 7.4.2. Refineries
- 7.1. Market Analysis, Insights and Forecast - by Material Type
- 8. Europe Fuel Tanker Services Market Analysis, Insights and Forecast, 2020-2032
- 8.1. Market Analysis, Insights and Forecast - by Material Type
- 8.1.1. Carbon Steel
- 8.1.2. Stainless Steel
- 8.1.3. Aluminum Alloy
- 8.2. Market Analysis, Insights and Forecast - by Capacity
- 8.2.1. Below 20000 Liters
- 8.2.2. 30000 - 40000 Liters
- 8.2.3. Above 40000 Liters
- 8.3. Market Analysis, Insights and Forecast - by Fuel Type
- 8.3.1. Petrol
- 8.3.2. LNG
- 8.3.3. Other Fuels
- 8.4. Market Analysis, Insights and Forecast - by Operator
- 8.4.1. Retail Petrol Companies
- 8.4.2. Refineries
- 8.1. Market Analysis, Insights and Forecast - by Material Type
- 9. Asia Pacific Fuel Tanker Services Market Analysis, Insights and Forecast, 2020-2032
- 9.1. Market Analysis, Insights and Forecast - by Material Type
- 9.1.1. Carbon Steel
- 9.1.2. Stainless Steel
- 9.1.3. Aluminum Alloy
- 9.2. Market Analysis, Insights and Forecast - by Capacity
- 9.2.1. Below 20000 Liters
- 9.2.2. 30000 - 40000 Liters
- 9.2.3. Above 40000 Liters
- 9.3. Market Analysis, Insights and Forecast - by Fuel Type
- 9.3.1. Petrol
- 9.3.2. LNG
- 9.3.3. Other Fuels
- 9.4. Market Analysis, Insights and Forecast - by Operator
- 9.4.1. Retail Petrol Companies
- 9.4.2. Refineries
- 9.1. Market Analysis, Insights and Forecast - by Material Type
- 10. Middle East and Africa Fuel Tanker Services Market Analysis, Insights and Forecast, 2020-2032
- 10.1. Market Analysis, Insights and Forecast - by Material Type
- 10.1.1. Carbon Steel
- 10.1.2. Stainless Steel
- 10.1.3. Aluminum Alloy
- 10.2. Market Analysis, Insights and Forecast - by Capacity
- 10.2.1. Below 20000 Liters
- 10.2.2. 30000 - 40000 Liters
- 10.2.3. Above 40000 Liters
- 10.3. Market Analysis, Insights and Forecast - by Fuel Type
- 10.3.1. Petrol
- 10.3.2. LNG
- 10.3.3. Other Fuels
- 10.4. Market Analysis, Insights and Forecast - by Operator
- 10.4.1. Retail Petrol Companies
- 10.4.2. Refineries
- 10.1. Market Analysis, Insights and Forecast - by Material Type
- 11. South America Fuel Tanker Services Market Analysis, Insights and Forecast, 2020-2032
- 11.1. Market Analysis, Insights and Forecast - by Material Type
- 11.1.1. Carbon Steel
- 11.1.2. Stainless Steel
- 11.1.3. Aluminum Alloy
- 11.2. Market Analysis, Insights and Forecast - by Capacity
- 11.2.1. Below 20000 Liters
- 11.2.2. 30000 - 40000 Liters
- 11.2.3. Above 40000 Liters
- 11.3. Market Analysis, Insights and Forecast - by Fuel Type
- 11.3.1. Petrol
- 11.3.2. LNG
- 11.3.3. Other Fuels
- 11.4. Market Analysis, Insights and Forecast - by Operator
- 11.4.1. Retail Petrol Companies
- 11.4.2. Refineries
- 11.1. Market Analysis, Insights and Forecast - by Material Type
- 12. Competitive Analysis
- 12.1. Company Profiles
- 12.1.1 Compass Fuel Oils Ltd
- 12.1.1.1. Company Overview
- 12.1.1.2. Products
- 12.1.1.3. Company Financials
- 12.1.1.4. SWOT Analysis
- 12.1.2 Rigual SA
- 12.1.2.1. Company Overview
- 12.1.2.2. Products
- 12.1.2.3. Company Financials
- 12.1.2.4. SWOT Analysis
- 12.1.3 Crown Oil Ltd
- 12.1.3.1. Company Overview
- 12.1.3.2. Products
- 12.1.3.3. Company Financials
- 12.1.3.4. SWOT Analysis
- 12.1.4 Shell International Trading and Shipping Company Limited*List Not Exhaustive
- 12.1.4.1. Company Overview
- 12.1.4.2. Products
- 12.1.4.3. Company Financials
- 12.1.4.4. SWOT Analysis
- 12.1.5 Certas Energy UK Limited
- 12.1.5.1. Company Overview
- 12.1.5.2. Products
- 12.1.5.3. Company Financials
- 12.1.5.4. SWOT Analysis
- 12.1.1 Compass Fuel Oils Ltd
- 12.2. Market Entropy
- 12.2.1 Company's Key Areas Served
- 12.2.2 Recent Developments
- 12.3. Company Market Share Analysis 2025
- 12.3.1 Top 5 Companies Market Share Analysis
- 12.3.2 Top 3 Companies Market Share Analysis
- 12.4. List of Potential Customers
- 13. Research Methodology
List of Figures
- Figure 1: Global Fuel Tanker Services Market Revenue Breakdown (Million, %) by Region 2025 & 2033
- Figure 2: North America Fuel Tanker Services Market Revenue (Million), by Material Type 2025 & 2033
- Figure 3: North America Fuel Tanker Services Market Revenue Share (%), by Material Type 2025 & 2033
- Figure 4: North America Fuel Tanker Services Market Revenue (Million), by Capacity 2025 & 2033
- Figure 5: North America Fuel Tanker Services Market Revenue Share (%), by Capacity 2025 & 2033
- Figure 6: North America Fuel Tanker Services Market Revenue (Million), by Fuel Type 2025 & 2033
- Figure 7: North America Fuel Tanker Services Market Revenue Share (%), by Fuel Type 2025 & 2033
- Figure 8: North America Fuel Tanker Services Market Revenue (Million), by Operator 2025 & 2033
- Figure 9: North America Fuel Tanker Services Market Revenue Share (%), by Operator 2025 & 2033
- Figure 10: North America Fuel Tanker Services Market Revenue (Million), by Country 2025 & 2033
- Figure 11: North America Fuel Tanker Services Market Revenue Share (%), by Country 2025 & 2033
- Figure 12: Europe Fuel Tanker Services Market Revenue (Million), by Material Type 2025 & 2033
- Figure 13: Europe Fuel Tanker Services Market Revenue Share (%), by Material Type 2025 & 2033
- Figure 14: Europe Fuel Tanker Services Market Revenue (Million), by Capacity 2025 & 2033
- Figure 15: Europe Fuel Tanker Services Market Revenue Share (%), by Capacity 2025 & 2033
- Figure 16: Europe Fuel Tanker Services Market Revenue (Million), by Fuel Type 2025 & 2033
- Figure 17: Europe Fuel Tanker Services Market Revenue Share (%), by Fuel Type 2025 & 2033
- Figure 18: Europe Fuel Tanker Services Market Revenue (Million), by Operator 2025 & 2033
- Figure 19: Europe Fuel Tanker Services Market Revenue Share (%), by Operator 2025 & 2033
- Figure 20: Europe Fuel Tanker Services Market Revenue (Million), by Country 2025 & 2033
- Figure 21: Europe Fuel Tanker Services Market Revenue Share (%), by Country 2025 & 2033
- Figure 22: Asia Pacific Fuel Tanker Services Market Revenue (Million), by Material Type 2025 & 2033
- Figure 23: Asia Pacific Fuel Tanker Services Market Revenue Share (%), by Material Type 2025 & 2033
- Figure 24: Asia Pacific Fuel Tanker Services Market Revenue (Million), by Capacity 2025 & 2033
- Figure 25: Asia Pacific Fuel Tanker Services Market Revenue Share (%), by Capacity 2025 & 2033
- Figure 26: Asia Pacific Fuel Tanker Services Market Revenue (Million), by Fuel Type 2025 & 2033
- Figure 27: Asia Pacific Fuel Tanker Services Market Revenue Share (%), by Fuel Type 2025 & 2033
- Figure 28: Asia Pacific Fuel Tanker Services Market Revenue (Million), by Operator 2025 & 2033
- Figure 29: Asia Pacific Fuel Tanker Services Market Revenue Share (%), by Operator 2025 & 2033
- Figure 30: Asia Pacific Fuel Tanker Services Market Revenue (Million), by Country 2025 & 2033
- Figure 31: Asia Pacific Fuel Tanker Services Market Revenue Share (%), by Country 2025 & 2033
- Figure 32: Middle East and Africa Fuel Tanker Services Market Revenue (Million), by Material Type 2025 & 2033
- Figure 33: Middle East and Africa Fuel Tanker Services Market Revenue Share (%), by Material Type 2025 & 2033
- Figure 34: Middle East and Africa Fuel Tanker Services Market Revenue (Million), by Capacity 2025 & 2033
- Figure 35: Middle East and Africa Fuel Tanker Services Market Revenue Share (%), by Capacity 2025 & 2033
- Figure 36: Middle East and Africa Fuel Tanker Services Market Revenue (Million), by Fuel Type 2025 & 2033
- Figure 37: Middle East and Africa Fuel Tanker Services Market Revenue Share (%), by Fuel Type 2025 & 2033
- Figure 38: Middle East and Africa Fuel Tanker Services Market Revenue (Million), by Operator 2025 & 2033
- Figure 39: Middle East and Africa Fuel Tanker Services Market Revenue Share (%), by Operator 2025 & 2033
- Figure 40: Middle East and Africa Fuel Tanker Services Market Revenue (Million), by Country 2025 & 2033
- Figure 41: Middle East and Africa Fuel Tanker Services Market Revenue Share (%), by Country 2025 & 2033
- Figure 42: South America Fuel Tanker Services Market Revenue (Million), by Material Type 2025 & 2033
- Figure 43: South America Fuel Tanker Services Market Revenue Share (%), by Material Type 2025 & 2033
- Figure 44: South America Fuel Tanker Services Market Revenue (Million), by Capacity 2025 & 2033
- Figure 45: South America Fuel Tanker Services Market Revenue Share (%), by Capacity 2025 & 2033
- Figure 46: South America Fuel Tanker Services Market Revenue (Million), by Fuel Type 2025 & 2033
- Figure 47: South America Fuel Tanker Services Market Revenue Share (%), by Fuel Type 2025 & 2033
- Figure 48: South America Fuel Tanker Services Market Revenue (Million), by Operator 2025 & 2033
- Figure 49: South America Fuel Tanker Services Market Revenue Share (%), by Operator 2025 & 2033
- Figure 50: South America Fuel Tanker Services Market Revenue (Million), by Country 2025 & 2033
- Figure 51: South America Fuel Tanker Services Market Revenue Share (%), by Country 2025 & 2033
List of Tables
- Table 1: Global Fuel Tanker Services Market Revenue Million Forecast, by Material Type 2020 & 2033
- Table 2: Global Fuel Tanker Services Market Revenue Million Forecast, by Capacity 2020 & 2033
- Table 3: Global Fuel Tanker Services Market Revenue Million Forecast, by Fuel Type 2020 & 2033
- Table 4: Global Fuel Tanker Services Market Revenue Million Forecast, by Operator 2020 & 2033
- Table 5: Global Fuel Tanker Services Market Revenue Million Forecast, by Region 2020 & 2033
- Table 6: Global Fuel Tanker Services Market Revenue Million Forecast, by Material Type 2020 & 2033
- Table 7: Global Fuel Tanker Services Market Revenue Million Forecast, by Capacity 2020 & 2033
- Table 8: Global Fuel Tanker Services Market Revenue Million Forecast, by Fuel Type 2020 & 2033
- Table 9: Global Fuel Tanker Services Market Revenue Million Forecast, by Operator 2020 & 2033
- Table 10: Global Fuel Tanker Services Market Revenue Million Forecast, by Country 2020 & 2033
- Table 11: United States Fuel Tanker Services Market Revenue (Million) Forecast, by Application 2020 & 2033
- Table 12: Canada Fuel Tanker Services Market Revenue (Million) Forecast, by Application 2020 & 2033
- Table 13: Rest of North America Fuel Tanker Services Market Revenue (Million) Forecast, by Application 2020 & 2033
- Table 14: Global Fuel Tanker Services Market Revenue Million Forecast, by Material Type 2020 & 2033
- Table 15: Global Fuel Tanker Services Market Revenue Million Forecast, by Capacity 2020 & 2033
- Table 16: Global Fuel Tanker Services Market Revenue Million Forecast, by Fuel Type 2020 & 2033
- Table 17: Global Fuel Tanker Services Market Revenue Million Forecast, by Operator 2020 & 2033
- Table 18: Global Fuel Tanker Services Market Revenue Million Forecast, by Country 2020 & 2033
- Table 19: Germany Fuel Tanker Services Market Revenue (Million) Forecast, by Application 2020 & 2033
- Table 20: France Fuel Tanker Services Market Revenue (Million) Forecast, by Application 2020 & 2033
- Table 21: United Kingdom Fuel Tanker Services Market Revenue (Million) Forecast, by Application 2020 & 2033
- Table 22: Italy Fuel Tanker Services Market Revenue (Million) Forecast, by Application 2020 & 2033
- Table 23: Spain Fuel Tanker Services Market Revenue (Million) Forecast, by Application 2020 & 2033
- Table 24: NORDIC Fuel Tanker Services Market Revenue (Million) Forecast, by Application 2020 & 2033
- Table 25: Russia Fuel Tanker Services Market Revenue (Million) Forecast, by Application 2020 & 2033
- Table 26: Rest of Europe Fuel Tanker Services Market Revenue (Million) Forecast, by Application 2020 & 2033
- Table 27: Global Fuel Tanker Services Market Revenue Million Forecast, by Material Type 2020 & 2033
- Table 28: Global Fuel Tanker Services Market Revenue Million Forecast, by Capacity 2020 & 2033
- Table 29: Global Fuel Tanker Services Market Revenue Million Forecast, by Fuel Type 2020 & 2033
- Table 30: Global Fuel Tanker Services Market Revenue Million Forecast, by Operator 2020 & 2033
- Table 31: Global Fuel Tanker Services Market Revenue Million Forecast, by Country 2020 & 2033
- Table 32: China Fuel Tanker Services Market Revenue (Million) Forecast, by Application 2020 & 2033
- Table 33: India Fuel Tanker Services Market Revenue (Million) Forecast, by Application 2020 & 2033
- Table 34: Australia Fuel Tanker Services Market Revenue (Million) Forecast, by Application 2020 & 2033
- Table 35: Malaysia Fuel Tanker Services Market Revenue (Million) Forecast, by Application 2020 & 2033
- Table 36: Indonesia Fuel Tanker Services Market Revenue (Million) Forecast, by Application 2020 & 2033
- Table 37: Thailand Fuel Tanker Services Market Revenue (Million) Forecast, by Application 2020 & 2033
- Table 38: Vietnam Fuel Tanker Services Market Revenue (Million) Forecast, by Application 2020 & 2033
- Table 39: Rest of Asia Pacific Fuel Tanker Services Market Revenue (Million) Forecast, by Application 2020 & 2033
- Table 40: Global Fuel Tanker Services Market Revenue Million Forecast, by Material Type 2020 & 2033
- Table 41: Global Fuel Tanker Services Market Revenue Million Forecast, by Capacity 2020 & 2033
- Table 42: Global Fuel Tanker Services Market Revenue Million Forecast, by Fuel Type 2020 & 2033
- Table 43: Global Fuel Tanker Services Market Revenue Million Forecast, by Operator 2020 & 2033
- Table 44: Global Fuel Tanker Services Market Revenue Million Forecast, by Country 2020 & 2033
- Table 45: Saudi Arabia Fuel Tanker Services Market Revenue (Million) Forecast, by Application 2020 & 2033
- Table 46: United Arab Emirates Fuel Tanker Services Market Revenue (Million) Forecast, by Application 2020 & 2033
- Table 47: South Africa Fuel Tanker Services Market Revenue (Million) Forecast, by Application 2020 & 2033
- Table 48: Nigeria Fuel Tanker Services Market Revenue (Million) Forecast, by Application 2020 & 2033
- Table 49: Rest of Middle East and Africa Fuel Tanker Services Market Revenue (Million) Forecast, by Application 2020 & 2033
- Table 50: Egypt Fuel Tanker Services Market Revenue (Million) Forecast, by Application 2020 & 2033
- Table 51: Global Fuel Tanker Services Market Revenue Million Forecast, by Material Type 2020 & 2033
- Table 52: Global Fuel Tanker Services Market Revenue Million Forecast, by Capacity 2020 & 2033
- Table 53: Global Fuel Tanker Services Market Revenue Million Forecast, by Fuel Type 2020 & 2033
- Table 54: Global Fuel Tanker Services Market Revenue Million Forecast, by Operator 2020 & 2033
- Table 55: Global Fuel Tanker Services Market Revenue Million Forecast, by Country 2020 & 2033
- Table 56: Brazil Fuel Tanker Services Market Revenue (Million) Forecast, by Application 2020 & 2033
- Table 57: Argentina Fuel Tanker Services Market Revenue (Million) Forecast, by Application 2020 & 2033
- Table 58: Colombia Fuel Tanker Services Market Revenue (Million) Forecast, by Application 2020 & 2033
- Table 59: Rest of South America Fuel Tanker Services Market Revenue (Million) Forecast, by Application 2020 & 2033
Frequently Asked Questions
1. What is the projected Compound Annual Growth Rate (CAGR) of the Fuel Tanker Services Market?
The projected CAGR is approximately 4.50%.
2. Which companies are prominent players in the Fuel Tanker Services Market?
Key companies in the market include Compass Fuel Oils Ltd, Rigual SA, Crown Oil Ltd, Shell International Trading and Shipping Company Limited*List Not Exhaustive, Certas Energy UK Limited.
3. What are the main segments of the Fuel Tanker Services Market?
The market segments include Material Type, Capacity, Fuel Type, Operator.
4. Can you provide details about the market size?
The market size is estimated to be USD 5.60 Million as of 2022.
5. What are some drivers contributing to market growth?
4.; Increasing Demand for Sales of Commercial Vehicles4.; Increasing Deployment of Retail Fuel Outlets Across Various Countries.
6. What are the notable trends driving market growth?
The LNG Segment is Expected to Dominate the Market.
7. Are there any restraints impacting market growth?
4.; Growing Penetration and Demand for Electric Vehicles.
8. Can you provide examples of recent developments in the market?
January 2024: Compass Fuel Oils Ltd announced the acquisition of a new Arctic fuel tanker, marking a significant addition to their expanding fleet at their headquarters in Preston, United Kingdom. This latest addition underscores the company’s commitment to enhancing its capacity.
9. What pricing options are available for accessing the report?
Pricing options include single-user, multi-user, and enterprise licenses priced at USD 4750, USD 5250, and USD 8750 respectively.
10. Is the market size provided in terms of value or volume?
The market size is provided in terms of value, measured in Million.
11. Are there any specific market keywords associated with the report?
Yes, the market keyword associated with the report is "Fuel Tanker Services Market," which aids in identifying and referencing the specific market segment covered.
12. How do I determine which pricing option suits my needs best?
The pricing options vary based on user requirements and access needs. Individual users may opt for single-user licenses, while businesses requiring broader access may choose multi-user or enterprise licenses for cost-effective access to the report.
13. Are there any additional resources or data provided in the Fuel Tanker Services Market report?
While the report offers comprehensive insights, it's advisable to review the specific contents or supplementary materials provided to ascertain if additional resources or data are available.
14. How can I stay updated on further developments or reports in the Fuel Tanker Services Market?
To stay informed about further developments, trends, and reports in the Fuel Tanker Services Market, consider subscribing to industry newsletters, following relevant companies and organizations, or regularly checking reputable industry news sources and publications.
Methodology
Step 1 - Identification of Relevant Samples Size from Population Database


Step 2 - Approaches for Defining Global Market Size (Value, Volume* & Price*)

Note*: In applicable scenarios
Step 3 - Data Sources
Primary Research
- Web Analytics
- Survey Reports
- Research Institute
- Latest Research Reports
- Opinion Leaders
Secondary Research
- Annual Reports
- White Paper
- Latest Press Release
- Industry Association
- Paid Database
- Investor Presentations

Step 4 - Data Triangulation
Involves using different sources of information in order to increase the validity of a study
These sources are likely to be stakeholders in a program - participants, other researchers, program staff, other community members, and so on.
Then we put all data in single framework & apply various statistical tools to find out the dynamic on the market.
During the analysis stage, feedback from the stakeholder groups would be compared to determine areas of agreement as well as areas of divergence