
Key Insights
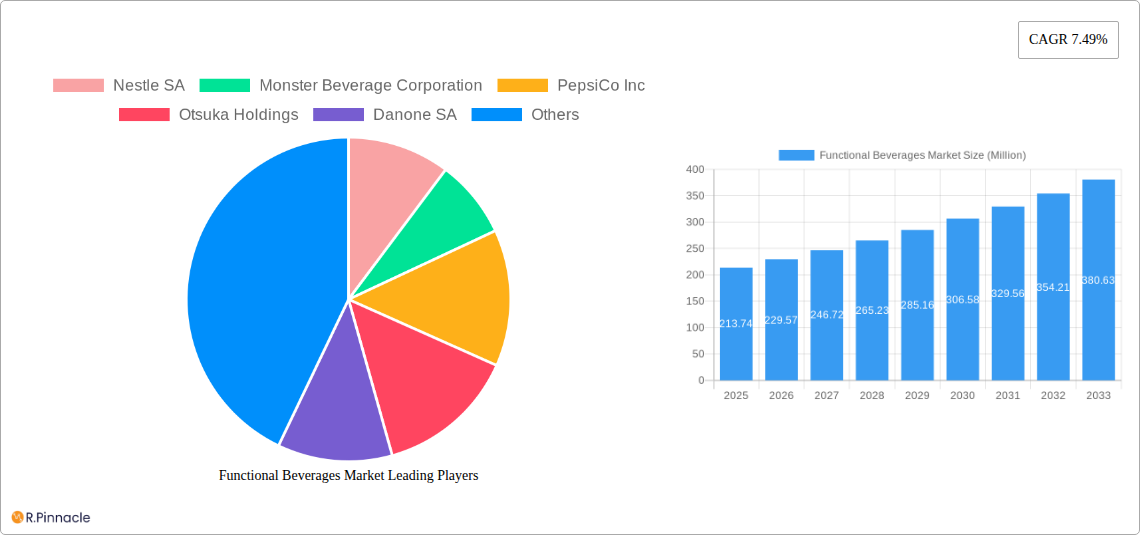
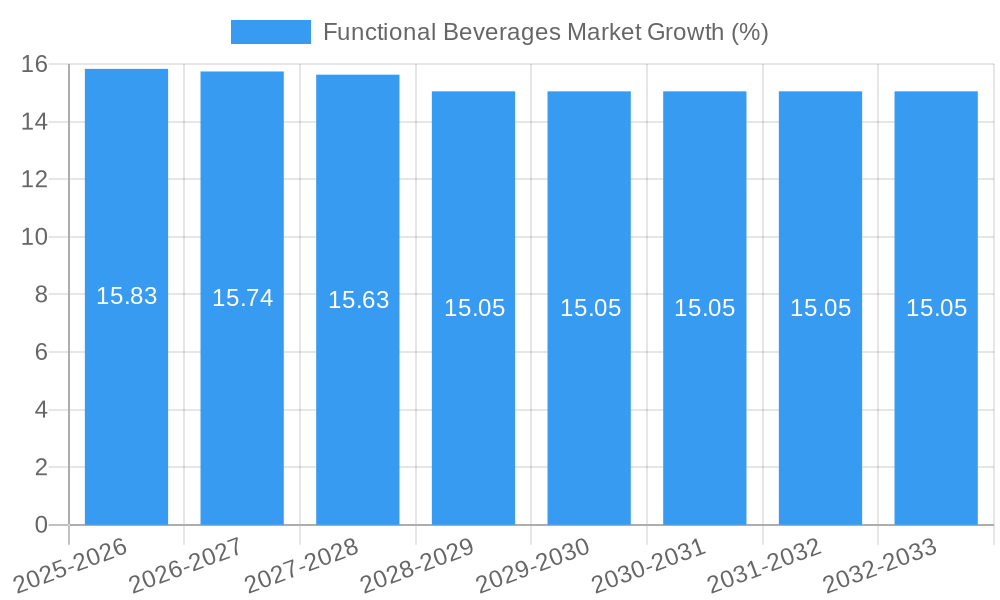
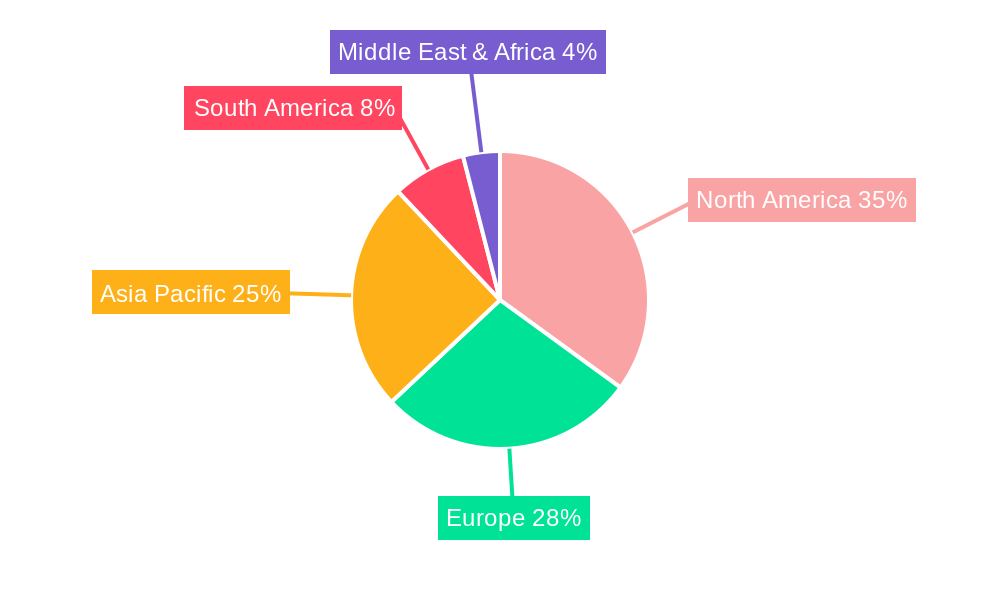
The functional beverages market, valued at $213.74 million in 2025, is projected to experience robust growth, driven by increasing health consciousness among consumers and the rising demand for convenient, nutrient-rich drinks. This market encompasses a diverse range of products, including energy drinks, sports drinks, fortified juices, dairy and dairy alternative beverages, and functional/fortified waters. Key growth drivers include the rising prevalence of lifestyle diseases, increasing disposable incomes, particularly in developing economies, and the expanding availability of these beverages through diverse distribution channels such as supermarkets, health stores, and online retailers. The market segmentation reveals that energy drinks and sports drinks currently dominate, though fortified juices and functional waters are showing significant growth potential due to their perceived health benefits. Major players like Nestle, PepsiCo, and Red Bull are actively innovating and expanding their product portfolios to cater to evolving consumer preferences, fueling further market expansion. Geographic distribution shows strong presence in North America and Europe, while the Asia-Pacific region is poised for substantial growth, driven by rising urbanization and changing dietary habits. The market's trajectory indicates continued expansion throughout the forecast period (2025-2033), with a Compound Annual Growth Rate (CAGR) of 7.49%, reflecting the enduring consumer focus on health and wellness.
The competitive landscape is highly dynamic, with established players facing increasing competition from smaller, specialized brands focusing on niche consumer segments and unique health benefits. Successful strategies involve product diversification, strategic partnerships, and targeted marketing campaigns highlighting the functional benefits of the beverages. While regulatory hurdles and fluctuating raw material prices present some challenges, the overall outlook for the functional beverage market remains positive, driven by the long-term trends of health-conscious consumption and the continuous development of innovative, appealing products. This market segment is expected to witness significant consolidation and further expansion into emerging markets over the next decade. The increasing adoption of online retail channels also contributes to the market's upward trajectory, offering convenient access for consumers and creating new opportunities for growth.
Functional Beverages Market: A Comprehensive Report (2019-2033)
This comprehensive report provides a detailed analysis of the global Functional Beverages Market, offering invaluable insights for industry professionals, investors, and strategic decision-makers. Covering the period 2019-2033, with a focus on 2025, this report unravels market dynamics, growth drivers, and emerging opportunities within this rapidly evolving sector. The market is expected to reach xx Million by 2033.
Functional Beverages Market Structure & Innovation Trends
The Functional Beverages Market is characterized by a moderately consolidated structure, with key players like Nestle SA, Monster Beverage Corporation, PepsiCo Inc., and Red Bull GmbH holding significant market share. However, the market also accommodates a diverse range of smaller players and emerging brands, creating a dynamic competitive landscape. Innovation is a primary driver, fueled by consumer demand for healthier, more functional beverages. This is evident in the increasing number of products incorporating vitamins, minerals, probiotics, and other beneficial ingredients. Regulatory frameworks, varying across different geographies, play a significant role in shaping product development and market access. The market witnesses continuous M&A activities, with deal values fluctuating depending on target companies and market conditions. For example, in 2024, M&A activity in the sector reached an estimated xx Million. Substitutes for functional beverages include traditional beverages and dietary supplements. The end-user demographics are broad, encompassing health-conscious individuals, athletes, and age groups seeking convenient nutritional solutions.
- Market Concentration: Moderately consolidated, with significant players holding substantial market share.
- Innovation Drivers: Consumer demand for healthier options, technological advancements in ingredient processing and packaging.
- Regulatory Frameworks: Vary across regions, impacting product development and labeling.
- Product Substitutes: Traditional beverages, dietary supplements.
- End-User Demographics: Health-conscious individuals, athletes, diverse age groups.
- M&A Activities: Ongoing, with deal values varying based on market conditions. Estimated xx Million in M&A deals in 2024.
Functional Beverages Market Dynamics & Trends
The Functional Beverages Market exhibits robust growth, driven by increasing health consciousness among consumers, rising disposable incomes in emerging economies, and expanding distribution channels. The market's CAGR during the forecast period (2025-2033) is projected to be xx%. Technological disruptions, such as advancements in beverage processing and packaging, enhance product quality, shelf life, and convenience. Consumer preferences are shifting towards natural, organic, and sustainably sourced ingredients, influencing product formulation. Competitive dynamics are intense, with established players and new entrants vying for market share through innovation, branding, and distribution strategies. Market penetration is increasing steadily, particularly in developing economies, although regional variations exist based on consumer preferences, economic conditions, and regulatory environments.
Dominant Regions & Segments in Functional Beverages Market
The North American region currently holds a dominant position in the Functional Beverages Market, driven by high consumer spending, robust distribution infrastructure, and strong brand presence. However, Asia-Pacific is anticipated to experience significant growth in the forecast period.
Dominant Segments:
- By Type: Energy drinks hold the largest market share, followed by sports drinks and fortified juices. Dairy and dairy alternative beverages, as well as functional/fortified water, are showing robust growth.
- By Distribution Channel: Supermarkets/hypermarkets maintain the largest share, owing to broad reach and consumer familiarity. Online retail stores are witnessing the fastest growth.
Key Drivers of Regional Dominance:
North America: High disposable income, health-conscious population, strong brand presence.
Asia-Pacific: Rapidly expanding middle class, rising health awareness, potential for market penetration.
Europe: Well-established market, strong regulatory framework, focus on organic and sustainable options.
Economic Policies: Favorable trade policies, government initiatives promoting health and wellness.
Infrastructure: Efficient logistics and supply chain networks.
Functional Beverages Market Product Innovations
Recent product innovations focus on natural ingredients, enhanced functional benefits, and convenient packaging. Technological advancements in ingredient extraction, preservation, and formulation are driving the creation of novel functional beverages with improved taste, texture, and shelf life. Companies are emphasizing unique selling propositions such as organic certification, sustainably sourced ingredients, or targeted health benefits to enhance market fit and differentiate their offerings.
Report Scope & Segmentation Analysis
This report segments the Functional Beverages Market by Type (Energy Drinks, Sports Drinks, Fortified Juice, Dairy and Dairy Alternative Beverages, Functional/Fortified Water) and Distribution Channel (Supermarkets/Hypermarkets, Pharmacies/Health Stores, Convenience Stores, Online Retail Stores, Other Distribution Channels). Each segment is analyzed in detail, providing insights into market size, growth projections, and competitive dynamics. For example, the energy drinks segment is expected to witness a CAGR of xx% during the forecast period, while online retail stores are projected to demonstrate the highest growth rate among distribution channels.
Key Drivers of Functional Beverages Market Growth
Several factors contribute to the growth of the Functional Beverages Market. Increasing health awareness among consumers fuels demand for products enhancing physical and mental well-being. Technological advancements in beverage processing and packaging improve product quality, shelf life, and convenience. Favorable economic conditions and rising disposable incomes in emerging markets expand market accessibility. Furthermore, government regulations promoting healthy lifestyles and encouraging product innovation further fuel market expansion.
Challenges in the Functional Beverages Market Sector
The Functional Beverages Market faces challenges such as intense competition, fluctuating raw material prices, and stringent regulatory requirements impacting product development and labeling. Supply chain disruptions can affect product availability and pricing. Maintaining product quality and consistency while meeting growing consumer demand for natural and sustainable ingredients poses a significant challenge. These factors can influence overall market growth and profitability.
Emerging Opportunities in Functional Beverages Market
The Functional Beverages Market presents several exciting opportunities. Growing demand for personalized nutrition and customized functional beverages opens new avenues for product development. The rise of online retail and e-commerce platforms expands distribution channels, reaching a wider consumer base. Emerging markets, particularly in Asia-Pacific and Latin America, represent significant growth potential. Innovations in sustainable packaging and environmentally friendly production processes present opportunities to capture the increasing consumer preference for eco-conscious products.
Leading Players in the Functional Beverages Market Market
- Nestle SA (Nestle SA)
- Monster Beverage Corporation (Monster Beverage Corporation)
- PepsiCo Inc. (PepsiCo Inc.)
- Otsuka Holdings
- Danone SA (Danone SA)
- Suntory Holdings Limited (Suntory Holdings Limited)
- Red Bull GmbH (Red Bull GmbH)
- Blue Diamond Growers
- The Coca-Cola Company (The Coca-Cola Company)
- Oatly Group AB (Oatly Group AB)
- List Not Exhaustive
Key Developments in Functional Beverages Market Industry
- October 2023: Tropicana launched two new smoothie flavors (Pineapple & Mango, Strawberry & Banana) with Vitamin C in India.
- August 2023: Brisk partnered with TikTok influencers to launch new iced tea products in Canada and other regions.
- March 2023: Dole launched new functional beverage products (100% Pineapple Juice, Pineapple Mango Juice, Dole Digestive Bliss Fruit Juice).
Future Outlook for Functional Beverages Market Market
The Functional Beverages Market is poised for continued expansion, driven by sustained consumer demand for healthier options, technological advancements, and expansion into new markets. Strategic partnerships, product diversification, and targeted marketing campaigns will be crucial for companies to capitalize on emerging opportunities. The increasing focus on sustainability and ethical sourcing will shape future product development and market dynamics, driving growth in the years to come.
Functional Beverages Market Segmentation
-
1. Type
- 1.1. Energy Drinks
- 1.2. Sports Drinks
- 1.3. Fortified Juice
- 1.4. Dairy and Dairy Alternative Beverage
- 1.5. Functional/Fortified Water
-
2. Distribution Channel
- 2.1. Supermarkets/Hypermarkets
- 2.2. Pharmacies/Health Stores
- 2.3. Convenience Stores
- 2.4. Online Retail Stores
- 2.5. Other Distribution Channels
Functional Beverages Market Segmentation By Geography
-
1. North America
- 1.1. United States
- 1.2. Canada
- 1.3. Mexico
- 1.4. Rest of North America
-
2. Europe
- 2.1. United Kingdom
- 2.2. Germany
- 2.3. France
- 2.4. Russia
- 2.5. Italy
- 2.6. Spain
- 2.7. Rest of Europe
-
3. Asia Pacific
- 3.1. India
- 3.2. China
- 3.3. Japan
- 3.4. Australia
- 3.5. Rest of Asia Pacific
-
4. South America
- 4.1. Brazil
- 4.2. Argentina
- 4.3. Rest of South America
- 5. Middle East
-
6. South Africa
- 6.1. Saudi Arabia
- 6.2. Rest of Middle East
Functional Beverages Market REPORT HIGHLIGHTS
| Aspects | Details |
|---|---|
| Study Period | 2019-2033 |
| Base Year | 2024 |
| Estimated Year | 2025 |
| Forecast Period | 2025-2033 |
| Historical Period | 2019-2024 |
| Growth Rate | CAGR of 7.49% from 2019-2033 |
| Segmentation |
|
Table of Contents
- 1. Introduction
- 1.1. Research Scope
- 1.2. Market Segmentation
- 1.3. Research Methodology
- 1.4. Definitions and Assumptions
- 2. Executive Summary
- 2.1. Introduction
- 3. Market Dynamics
- 3.1. Introduction
- 3.2. Market Drivers
- 3.2.1. Growing Consumer Inclination Toward Low-sugar/Sugar-free Beverages; Expenditure on Advertisement and Promotional Activities
- 3.3. Market Restrains
- 3.3.1. Concerns Over Health Issues Associated with Functional Beverages
- 3.4. Market Trends
- 3.4.1. Inclination Toward Dairy and Dairy Alternative Beverages
- 4. Market Factor Analysis
- 4.1. Porters Five Forces
- 4.2. Supply/Value Chain
- 4.3. PESTEL analysis
- 4.4. Market Entropy
- 4.5. Patent/Trademark Analysis
- 5. Global Functional Beverages Market Analysis, Insights and Forecast, 2019-2031
- 5.1. Market Analysis, Insights and Forecast - by Type
- 5.1.1. Energy Drinks
- 5.1.2. Sports Drinks
- 5.1.3. Fortified Juice
- 5.1.4. Dairy and Dairy Alternative Beverage
- 5.1.5. Functional/Fortified Water
- 5.2. Market Analysis, Insights and Forecast - by Distribution Channel
- 5.2.1. Supermarkets/Hypermarkets
- 5.2.2. Pharmacies/Health Stores
- 5.2.3. Convenience Stores
- 5.2.4. Online Retail Stores
- 5.2.5. Other Distribution Channels
- 5.3. Market Analysis, Insights and Forecast - by Region
- 5.3.1. North America
- 5.3.2. Europe
- 5.3.3. Asia Pacific
- 5.3.4. South America
- 5.3.5. Middle East
- 5.3.6. South Africa
- 5.1. Market Analysis, Insights and Forecast - by Type
- 6. North America Functional Beverages Market Analysis, Insights and Forecast, 2019-2031
- 6.1. Market Analysis, Insights and Forecast - by Type
- 6.1.1. Energy Drinks
- 6.1.2. Sports Drinks
- 6.1.3. Fortified Juice
- 6.1.4. Dairy and Dairy Alternative Beverage
- 6.1.5. Functional/Fortified Water
- 6.2. Market Analysis, Insights and Forecast - by Distribution Channel
- 6.2.1. Supermarkets/Hypermarkets
- 6.2.2. Pharmacies/Health Stores
- 6.2.3. Convenience Stores
- 6.2.4. Online Retail Stores
- 6.2.5. Other Distribution Channels
- 6.1. Market Analysis, Insights and Forecast - by Type
- 7. Europe Functional Beverages Market Analysis, Insights and Forecast, 2019-2031
- 7.1. Market Analysis, Insights and Forecast - by Type
- 7.1.1. Energy Drinks
- 7.1.2. Sports Drinks
- 7.1.3. Fortified Juice
- 7.1.4. Dairy and Dairy Alternative Beverage
- 7.1.5. Functional/Fortified Water
- 7.2. Market Analysis, Insights and Forecast - by Distribution Channel
- 7.2.1. Supermarkets/Hypermarkets
- 7.2.2. Pharmacies/Health Stores
- 7.2.3. Convenience Stores
- 7.2.4. Online Retail Stores
- 7.2.5. Other Distribution Channels
- 7.1. Market Analysis, Insights and Forecast - by Type
- 8. Asia Pacific Functional Beverages Market Analysis, Insights and Forecast, 2019-2031
- 8.1. Market Analysis, Insights and Forecast - by Type
- 8.1.1. Energy Drinks
- 8.1.2. Sports Drinks
- 8.1.3. Fortified Juice
- 8.1.4. Dairy and Dairy Alternative Beverage
- 8.1.5. Functional/Fortified Water
- 8.2. Market Analysis, Insights and Forecast - by Distribution Channel
- 8.2.1. Supermarkets/Hypermarkets
- 8.2.2. Pharmacies/Health Stores
- 8.2.3. Convenience Stores
- 8.2.4. Online Retail Stores
- 8.2.5. Other Distribution Channels
- 8.1. Market Analysis, Insights and Forecast - by Type
- 9. South America Functional Beverages Market Analysis, Insights and Forecast, 2019-2031
- 9.1. Market Analysis, Insights and Forecast - by Type
- 9.1.1. Energy Drinks
- 9.1.2. Sports Drinks
- 9.1.3. Fortified Juice
- 9.1.4. Dairy and Dairy Alternative Beverage
- 9.1.5. Functional/Fortified Water
- 9.2. Market Analysis, Insights and Forecast - by Distribution Channel
- 9.2.1. Supermarkets/Hypermarkets
- 9.2.2. Pharmacies/Health Stores
- 9.2.3. Convenience Stores
- 9.2.4. Online Retail Stores
- 9.2.5. Other Distribution Channels
- 9.1. Market Analysis, Insights and Forecast - by Type
- 10. Middle East Functional Beverages Market Analysis, Insights and Forecast, 2019-2031
- 10.1. Market Analysis, Insights and Forecast - by Type
- 10.1.1. Energy Drinks
- 10.1.2. Sports Drinks
- 10.1.3. Fortified Juice
- 10.1.4. Dairy and Dairy Alternative Beverage
- 10.1.5. Functional/Fortified Water
- 10.2. Market Analysis, Insights and Forecast - by Distribution Channel
- 10.2.1. Supermarkets/Hypermarkets
- 10.2.2. Pharmacies/Health Stores
- 10.2.3. Convenience Stores
- 10.2.4. Online Retail Stores
- 10.2.5. Other Distribution Channels
- 10.1. Market Analysis, Insights and Forecast - by Type
- 11. South Africa Functional Beverages Market Analysis, Insights and Forecast, 2019-2031
- 11.1. Market Analysis, Insights and Forecast - by Type
- 11.1.1. Energy Drinks
- 11.1.2. Sports Drinks
- 11.1.3. Fortified Juice
- 11.1.4. Dairy and Dairy Alternative Beverage
- 11.1.5. Functional/Fortified Water
- 11.2. Market Analysis, Insights and Forecast - by Distribution Channel
- 11.2.1. Supermarkets/Hypermarkets
- 11.2.2. Pharmacies/Health Stores
- 11.2.3. Convenience Stores
- 11.2.4. Online Retail Stores
- 11.2.5. Other Distribution Channels
- 11.1. Market Analysis, Insights and Forecast - by Type
- 12. North America Functional Beverages Market Analysis, Insights and Forecast, 2019-2031
- 12.1. Market Analysis, Insights and Forecast - By Country/Sub-region
- 12.1.1 United States
- 12.1.2 Canada
- 12.1.3 Mexico
- 12.1.4 Rest of North America
- 13. Europe Functional Beverages Market Analysis, Insights and Forecast, 2019-2031
- 13.1. Market Analysis, Insights and Forecast - By Country/Sub-region
- 13.1.1 United Kingdom
- 13.1.2 Germany
- 13.1.3 France
- 13.1.4 Russia
- 13.1.5 Italy
- 13.1.6 Spain
- 13.1.7 Rest of Europe
- 14. Asia Pacific Functional Beverages Market Analysis, Insights and Forecast, 2019-2031
- 14.1. Market Analysis, Insights and Forecast - By Country/Sub-region
- 14.1.1 India
- 14.1.2 China
- 14.1.3 Japan
- 14.1.4 Australia
- 14.1.5 Rest of Asia Pacific
- 15. South America Functional Beverages Market Analysis, Insights and Forecast, 2019-2031
- 15.1. Market Analysis, Insights and Forecast - By Country/Sub-region
- 15.1.1 Brazil
- 15.1.2 Argentina
- 15.1.3 Rest of South America
- 16. Middle East Functional Beverages Market Analysis, Insights and Forecast, 2019-2031
- 16.1. Market Analysis, Insights and Forecast - By Country/Sub-region
- 16.1.1.
- 17. South Africa Functional Beverages Market Analysis, Insights and Forecast, 2019-2031
- 17.1. Market Analysis, Insights and Forecast - By Country/Sub-region
- 17.1.1 Saudi Arabia
- 17.1.2 Rest of Middle East
- 18. Competitive Analysis
- 18.1. Global Market Share Analysis 2024
- 18.2. Company Profiles
- 18.2.1 Nestle SA
- 18.2.1.1. Overview
- 18.2.1.2. Products
- 18.2.1.3. SWOT Analysis
- 18.2.1.4. Recent Developments
- 18.2.1.5. Financials (Based on Availability)
- 18.2.2 Monster Beverage Corporation
- 18.2.2.1. Overview
- 18.2.2.2. Products
- 18.2.2.3. SWOT Analysis
- 18.2.2.4. Recent Developments
- 18.2.2.5. Financials (Based on Availability)
- 18.2.3 PepsiCo Inc
- 18.2.3.1. Overview
- 18.2.3.2. Products
- 18.2.3.3. SWOT Analysis
- 18.2.3.4. Recent Developments
- 18.2.3.5. Financials (Based on Availability)
- 18.2.4 Otsuka Holdings
- 18.2.4.1. Overview
- 18.2.4.2. Products
- 18.2.4.3. SWOT Analysis
- 18.2.4.4. Recent Developments
- 18.2.4.5. Financials (Based on Availability)
- 18.2.5 Danone SA
- 18.2.5.1. Overview
- 18.2.5.2. Products
- 18.2.5.3. SWOT Analysis
- 18.2.5.4. Recent Developments
- 18.2.5.5. Financials (Based on Availability)
- 18.2.6 Suntory Holdings Limited
- 18.2.6.1. Overview
- 18.2.6.2. Products
- 18.2.6.3. SWOT Analysis
- 18.2.6.4. Recent Developments
- 18.2.6.5. Financials (Based on Availability)
- 18.2.7 Red Bull GmbH
- 18.2.7.1. Overview
- 18.2.7.2. Products
- 18.2.7.3. SWOT Analysis
- 18.2.7.4. Recent Developments
- 18.2.7.5. Financials (Based on Availability)
- 18.2.8 Blue Diamond Growers
- 18.2.8.1. Overview
- 18.2.8.2. Products
- 18.2.8.3. SWOT Analysis
- 18.2.8.4. Recent Developments
- 18.2.8.5. Financials (Based on Availability)
- 18.2.9 The Coca-Cola Company
- 18.2.9.1. Overview
- 18.2.9.2. Products
- 18.2.9.3. SWOT Analysis
- 18.2.9.4. Recent Developments
- 18.2.9.5. Financials (Based on Availability)
- 18.2.10 Oatly Group AB *List Not Exhaustive
- 18.2.10.1. Overview
- 18.2.10.2. Products
- 18.2.10.3. SWOT Analysis
- 18.2.10.4. Recent Developments
- 18.2.10.5. Financials (Based on Availability)
- 18.2.1 Nestle SA
List of Figures
- Figure 1: Global Functional Beverages Market Revenue Breakdown (Million, %) by Region 2024 & 2032
- Figure 2: North America Functional Beverages Market Revenue (Million), by Country 2024 & 2032
- Figure 3: North America Functional Beverages Market Revenue Share (%), by Country 2024 & 2032
- Figure 4: Europe Functional Beverages Market Revenue (Million), by Country 2024 & 2032
- Figure 5: Europe Functional Beverages Market Revenue Share (%), by Country 2024 & 2032
- Figure 6: Asia Pacific Functional Beverages Market Revenue (Million), by Country 2024 & 2032
- Figure 7: Asia Pacific Functional Beverages Market Revenue Share (%), by Country 2024 & 2032
- Figure 8: South America Functional Beverages Market Revenue (Million), by Country 2024 & 2032
- Figure 9: South America Functional Beverages Market Revenue Share (%), by Country 2024 & 2032
- Figure 10: Middle East Functional Beverages Market Revenue (Million), by Country 2024 & 2032
- Figure 11: Middle East Functional Beverages Market Revenue Share (%), by Country 2024 & 2032
- Figure 12: South Africa Functional Beverages Market Revenue (Million), by Country 2024 & 2032
- Figure 13: South Africa Functional Beverages Market Revenue Share (%), by Country 2024 & 2032
- Figure 14: North America Functional Beverages Market Revenue (Million), by Type 2024 & 2032
- Figure 15: North America Functional Beverages Market Revenue Share (%), by Type 2024 & 2032
- Figure 16: North America Functional Beverages Market Revenue (Million), by Distribution Channel 2024 & 2032
- Figure 17: North America Functional Beverages Market Revenue Share (%), by Distribution Channel 2024 & 2032
- Figure 18: North America Functional Beverages Market Revenue (Million), by Country 2024 & 2032
- Figure 19: North America Functional Beverages Market Revenue Share (%), by Country 2024 & 2032
- Figure 20: Europe Functional Beverages Market Revenue (Million), by Type 2024 & 2032
- Figure 21: Europe Functional Beverages Market Revenue Share (%), by Type 2024 & 2032
- Figure 22: Europe Functional Beverages Market Revenue (Million), by Distribution Channel 2024 & 2032
- Figure 23: Europe Functional Beverages Market Revenue Share (%), by Distribution Channel 2024 & 2032
- Figure 24: Europe Functional Beverages Market Revenue (Million), by Country 2024 & 2032
- Figure 25: Europe Functional Beverages Market Revenue Share (%), by Country 2024 & 2032
- Figure 26: Asia Pacific Functional Beverages Market Revenue (Million), by Type 2024 & 2032
- Figure 27: Asia Pacific Functional Beverages Market Revenue Share (%), by Type 2024 & 2032
- Figure 28: Asia Pacific Functional Beverages Market Revenue (Million), by Distribution Channel 2024 & 2032
- Figure 29: Asia Pacific Functional Beverages Market Revenue Share (%), by Distribution Channel 2024 & 2032
- Figure 30: Asia Pacific Functional Beverages Market Revenue (Million), by Country 2024 & 2032
- Figure 31: Asia Pacific Functional Beverages Market Revenue Share (%), by Country 2024 & 2032
- Figure 32: South America Functional Beverages Market Revenue (Million), by Type 2024 & 2032
- Figure 33: South America Functional Beverages Market Revenue Share (%), by Type 2024 & 2032
- Figure 34: South America Functional Beverages Market Revenue (Million), by Distribution Channel 2024 & 2032
- Figure 35: South America Functional Beverages Market Revenue Share (%), by Distribution Channel 2024 & 2032
- Figure 36: South America Functional Beverages Market Revenue (Million), by Country 2024 & 2032
- Figure 37: South America Functional Beverages Market Revenue Share (%), by Country 2024 & 2032
- Figure 38: Middle East Functional Beverages Market Revenue (Million), by Type 2024 & 2032
- Figure 39: Middle East Functional Beverages Market Revenue Share (%), by Type 2024 & 2032
- Figure 40: Middle East Functional Beverages Market Revenue (Million), by Distribution Channel 2024 & 2032
- Figure 41: Middle East Functional Beverages Market Revenue Share (%), by Distribution Channel 2024 & 2032
- Figure 42: Middle East Functional Beverages Market Revenue (Million), by Country 2024 & 2032
- Figure 43: Middle East Functional Beverages Market Revenue Share (%), by Country 2024 & 2032
- Figure 44: South Africa Functional Beverages Market Revenue (Million), by Type 2024 & 2032
- Figure 45: South Africa Functional Beverages Market Revenue Share (%), by Type 2024 & 2032
- Figure 46: South Africa Functional Beverages Market Revenue (Million), by Distribution Channel 2024 & 2032
- Figure 47: South Africa Functional Beverages Market Revenue Share (%), by Distribution Channel 2024 & 2032
- Figure 48: South Africa Functional Beverages Market Revenue (Million), by Country 2024 & 2032
- Figure 49: South Africa Functional Beverages Market Revenue Share (%), by Country 2024 & 2032
List of Tables
- Table 1: Global Functional Beverages Market Revenue Million Forecast, by Region 2019 & 2032
- Table 2: Global Functional Beverages Market Revenue Million Forecast, by Type 2019 & 2032
- Table 3: Global Functional Beverages Market Revenue Million Forecast, by Distribution Channel 2019 & 2032
- Table 4: Global Functional Beverages Market Revenue Million Forecast, by Region 2019 & 2032
- Table 5: Global Functional Beverages Market Revenue Million Forecast, by Country 2019 & 2032
- Table 6: United States Functional Beverages Market Revenue (Million) Forecast, by Application 2019 & 2032
- Table 7: Canada Functional Beverages Market Revenue (Million) Forecast, by Application 2019 & 2032
- Table 8: Mexico Functional Beverages Market Revenue (Million) Forecast, by Application 2019 & 2032
- Table 9: Rest of North America Functional Beverages Market Revenue (Million) Forecast, by Application 2019 & 2032
- Table 10: Global Functional Beverages Market Revenue Million Forecast, by Country 2019 & 2032
- Table 11: United Kingdom Functional Beverages Market Revenue (Million) Forecast, by Application 2019 & 2032
- Table 12: Germany Functional Beverages Market Revenue (Million) Forecast, by Application 2019 & 2032
- Table 13: France Functional Beverages Market Revenue (Million) Forecast, by Application 2019 & 2032
- Table 14: Russia Functional Beverages Market Revenue (Million) Forecast, by Application 2019 & 2032
- Table 15: Italy Functional Beverages Market Revenue (Million) Forecast, by Application 2019 & 2032
- Table 16: Spain Functional Beverages Market Revenue (Million) Forecast, by Application 2019 & 2032
- Table 17: Rest of Europe Functional Beverages Market Revenue (Million) Forecast, by Application 2019 & 2032
- Table 18: Global Functional Beverages Market Revenue Million Forecast, by Country 2019 & 2032
- Table 19: India Functional Beverages Market Revenue (Million) Forecast, by Application 2019 & 2032
- Table 20: China Functional Beverages Market Revenue (Million) Forecast, by Application 2019 & 2032
- Table 21: Japan Functional Beverages Market Revenue (Million) Forecast, by Application 2019 & 2032
- Table 22: Australia Functional Beverages Market Revenue (Million) Forecast, by Application 2019 & 2032
- Table 23: Rest of Asia Pacific Functional Beverages Market Revenue (Million) Forecast, by Application 2019 & 2032
- Table 24: Global Functional Beverages Market Revenue Million Forecast, by Country 2019 & 2032
- Table 25: Brazil Functional Beverages Market Revenue (Million) Forecast, by Application 2019 & 2032
- Table 26: Argentina Functional Beverages Market Revenue (Million) Forecast, by Application 2019 & 2032
- Table 27: Rest of South America Functional Beverages Market Revenue (Million) Forecast, by Application 2019 & 2032
- Table 28: Global Functional Beverages Market Revenue Million Forecast, by Country 2019 & 2032
- Table 29: Functional Beverages Market Revenue (Million) Forecast, by Application 2019 & 2032
- Table 30: Global Functional Beverages Market Revenue Million Forecast, by Country 2019 & 2032
- Table 31: Saudi Arabia Functional Beverages Market Revenue (Million) Forecast, by Application 2019 & 2032
- Table 32: Rest of Middle East Functional Beverages Market Revenue (Million) Forecast, by Application 2019 & 2032
- Table 33: Global Functional Beverages Market Revenue Million Forecast, by Type 2019 & 2032
- Table 34: Global Functional Beverages Market Revenue Million Forecast, by Distribution Channel 2019 & 2032
- Table 35: Global Functional Beverages Market Revenue Million Forecast, by Country 2019 & 2032
- Table 36: United States Functional Beverages Market Revenue (Million) Forecast, by Application 2019 & 2032
- Table 37: Canada Functional Beverages Market Revenue (Million) Forecast, by Application 2019 & 2032
- Table 38: Mexico Functional Beverages Market Revenue (Million) Forecast, by Application 2019 & 2032
- Table 39: Rest of North America Functional Beverages Market Revenue (Million) Forecast, by Application 2019 & 2032
- Table 40: Global Functional Beverages Market Revenue Million Forecast, by Type 2019 & 2032
- Table 41: Global Functional Beverages Market Revenue Million Forecast, by Distribution Channel 2019 & 2032
- Table 42: Global Functional Beverages Market Revenue Million Forecast, by Country 2019 & 2032
- Table 43: United Kingdom Functional Beverages Market Revenue (Million) Forecast, by Application 2019 & 2032
- Table 44: Germany Functional Beverages Market Revenue (Million) Forecast, by Application 2019 & 2032
- Table 45: France Functional Beverages Market Revenue (Million) Forecast, by Application 2019 & 2032
- Table 46: Russia Functional Beverages Market Revenue (Million) Forecast, by Application 2019 & 2032
- Table 47: Italy Functional Beverages Market Revenue (Million) Forecast, by Application 2019 & 2032
- Table 48: Spain Functional Beverages Market Revenue (Million) Forecast, by Application 2019 & 2032
- Table 49: Rest of Europe Functional Beverages Market Revenue (Million) Forecast, by Application 2019 & 2032
- Table 50: Global Functional Beverages Market Revenue Million Forecast, by Type 2019 & 2032
- Table 51: Global Functional Beverages Market Revenue Million Forecast, by Distribution Channel 2019 & 2032
- Table 52: Global Functional Beverages Market Revenue Million Forecast, by Country 2019 & 2032
- Table 53: India Functional Beverages Market Revenue (Million) Forecast, by Application 2019 & 2032
- Table 54: China Functional Beverages Market Revenue (Million) Forecast, by Application 2019 & 2032
- Table 55: Japan Functional Beverages Market Revenue (Million) Forecast, by Application 2019 & 2032
- Table 56: Australia Functional Beverages Market Revenue (Million) Forecast, by Application 2019 & 2032
- Table 57: Rest of Asia Pacific Functional Beverages Market Revenue (Million) Forecast, by Application 2019 & 2032
- Table 58: Global Functional Beverages Market Revenue Million Forecast, by Type 2019 & 2032
- Table 59: Global Functional Beverages Market Revenue Million Forecast, by Distribution Channel 2019 & 2032
- Table 60: Global Functional Beverages Market Revenue Million Forecast, by Country 2019 & 2032
- Table 61: Brazil Functional Beverages Market Revenue (Million) Forecast, by Application 2019 & 2032
- Table 62: Argentina Functional Beverages Market Revenue (Million) Forecast, by Application 2019 & 2032
- Table 63: Rest of South America Functional Beverages Market Revenue (Million) Forecast, by Application 2019 & 2032
- Table 64: Global Functional Beverages Market Revenue Million Forecast, by Type 2019 & 2032
- Table 65: Global Functional Beverages Market Revenue Million Forecast, by Distribution Channel 2019 & 2032
- Table 66: Global Functional Beverages Market Revenue Million Forecast, by Country 2019 & 2032
- Table 67: Global Functional Beverages Market Revenue Million Forecast, by Type 2019 & 2032
- Table 68: Global Functional Beverages Market Revenue Million Forecast, by Distribution Channel 2019 & 2032
- Table 69: Global Functional Beverages Market Revenue Million Forecast, by Country 2019 & 2032
- Table 70: Saudi Arabia Functional Beverages Market Revenue (Million) Forecast, by Application 2019 & 2032
- Table 71: Rest of Middle East Functional Beverages Market Revenue (Million) Forecast, by Application 2019 & 2032
Frequently Asked Questions
1. What is the projected Compound Annual Growth Rate (CAGR) of the Functional Beverages Market?
The projected CAGR is approximately 7.49%.
2. Which companies are prominent players in the Functional Beverages Market?
Key companies in the market include Nestle SA, Monster Beverage Corporation, PepsiCo Inc, Otsuka Holdings, Danone SA, Suntory Holdings Limited, Red Bull GmbH, Blue Diamond Growers, The Coca-Cola Company, Oatly Group AB *List Not Exhaustive.
3. What are the main segments of the Functional Beverages Market?
The market segments include Type, Distribution Channel.
4. Can you provide details about the market size?
The market size is estimated to be USD 213.74 Million as of 2022.
5. What are some drivers contributing to market growth?
Growing Consumer Inclination Toward Low-sugar/Sugar-free Beverages; Expenditure on Advertisement and Promotional Activities.
6. What are the notable trends driving market growth?
Inclination Toward Dairy and Dairy Alternative Beverages.
7. Are there any restraints impacting market growth?
Concerns Over Health Issues Associated with Functional Beverages.
8. Can you provide examples of recent developments in the market?
October 2023: Tropicana brand launched two new smoothie flavors containing Vitamin C. The products Tropicana Smoothie Pineapple & Mango and Strawberry & Banana are to be retailed across India in all distribution channels operating in the market.
9. What pricing options are available for accessing the report?
Pricing options include single-user, multi-user, and enterprise licenses priced at USD 4750, USD 5250, and USD 8750 respectively.
10. Is the market size provided in terms of value or volume?
The market size is provided in terms of value, measured in Million.
11. Are there any specific market keywords associated with the report?
Yes, the market keyword associated with the report is "Functional Beverages Market," which aids in identifying and referencing the specific market segment covered.
12. How do I determine which pricing option suits my needs best?
The pricing options vary based on user requirements and access needs. Individual users may opt for single-user licenses, while businesses requiring broader access may choose multi-user or enterprise licenses for cost-effective access to the report.
13. Are there any additional resources or data provided in the Functional Beverages Market report?
While the report offers comprehensive insights, it's advisable to review the specific contents or supplementary materials provided to ascertain if additional resources or data are available.
14. How can I stay updated on further developments or reports in the Functional Beverages Market?
To stay informed about further developments, trends, and reports in the Functional Beverages Market, consider subscribing to industry newsletters, following relevant companies and organizations, or regularly checking reputable industry news sources and publications.
Methodology
Step 1 - Identification of Relevant Samples Size from Population Database


Step 2 - Approaches for Defining Global Market Size (Value, Volume* & Price*)

Note*: In applicable scenarios
Step 3 - Data Sources
Primary Research
- Web Analytics
- Survey Reports
- Research Institute
- Latest Research Reports
- Opinion Leaders
Secondary Research
- Annual Reports
- White Paper
- Latest Press Release
- Industry Association
- Paid Database
- Investor Presentations

Step 4 - Data Triangulation
Involves using different sources of information in order to increase the validity of a study
These sources are likely to be stakeholders in a program - participants, other researchers, program staff, other community members, and so on.
Then we put all data in single framework & apply various statistical tools to find out the dynamic on the market.
During the analysis stage, feedback from the stakeholder groups would be compared to determine areas of agreement as well as areas of divergence


