
Key Insights
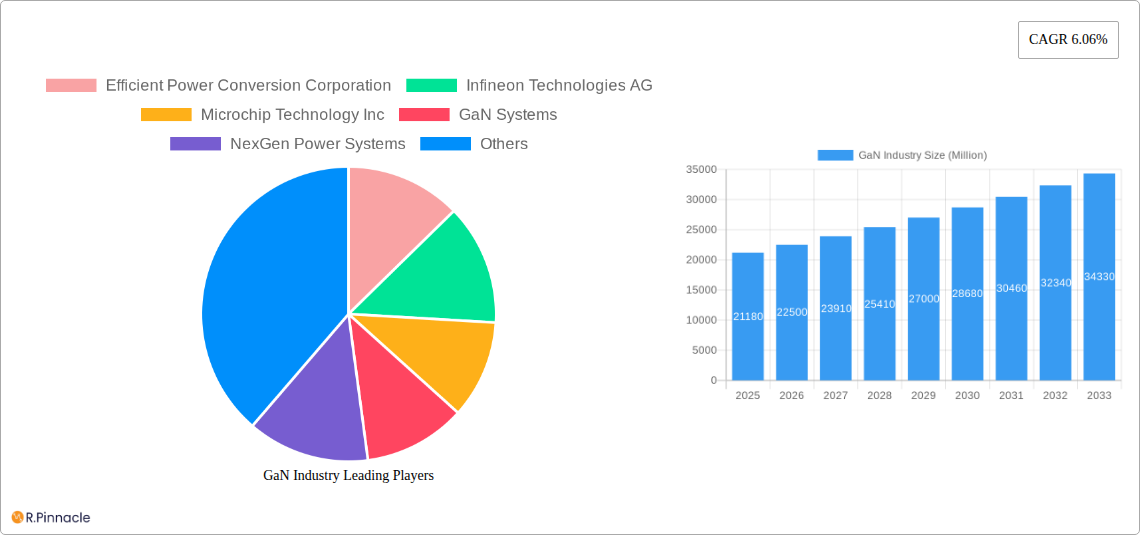
The GaN (Gallium Nitride) semiconductor market, valued at $21.18 billion in 2025, is experiencing robust growth, projected to expand at a Compound Annual Growth Rate (CAGR) of 6.06% from 2025 to 2033. This expansion is driven by the increasing demand for high-efficiency power conversion in various applications. The automotive sector, fueled by the adoption of electric vehicles (EVs) and hybrid electric vehicles (HEVs), is a significant driver, requiring GaN's superior performance in power management systems, chargers, and inverters. Similarly, the rapid growth of the consumer electronics market, particularly in smartphones and fast chargers, further fuels GaN adoption due to its ability to deliver faster charging speeds and reduced energy consumption. Advancements in GaN technology, including improved switching speeds and higher power density, are overcoming previous limitations, making GaN increasingly competitive against traditional silicon-based semiconductors. Furthermore, the aerospace and defense industries are exploring GaN's potential for high-frequency radar systems and power amplifiers, contributing to market expansion. While manufacturing complexities and higher initial costs compared to silicon remain challenges, ongoing technological innovation and economies of scale are mitigating these restraints, fostering a positive outlook for GaN market growth.
The market segmentation reveals significant opportunities across different product types (Power Semiconductors, Opto-Semiconductors, RF Semiconductors) and devices (Transistors, Diodes, Rectifiers, Power ICs). The diverse end-user industries, including automotive, consumer electronics, aerospace and defense, medical, and information communication technology, collectively contribute to the market's impressive size and future growth potential. Key players like Infineon Technologies AG, Microchip Technology Inc., and Wolfspeed Inc. are heavily invested in research and development, pushing the boundaries of GaN technology and expanding its applications. Geographical analysis indicates strong growth across North America, Europe, and Asia Pacific, with China and the United States representing particularly significant markets. The continued focus on energy efficiency, miniaturization, and increased performance across diverse sectors will likely ensure sustained market expansion for GaN semiconductors throughout the forecast period.
GaN Industry Market Report: 2019-2033
This comprehensive report provides an in-depth analysis of the GaN (Gallium Nitride) industry, offering valuable insights for industry professionals, investors, and strategists. With a study period spanning 2019-2033, a base year of 2025, and a forecast period of 2025-2033, this report leverages extensive data analysis to project future market trends and growth opportunities within the GaN sector. The report covers a market valued at several billion dollars, providing critical information on key players, market segmentation, and future growth potential.
GaN Industry Market Structure & Innovation Trends
The GaN industry is characterized by a moderately concentrated market structure, with several key players holding significant market share. However, the landscape is dynamic, with ongoing innovation and consolidation shaping the competitive dynamics. The market is driven by advancements in semiconductor technology, increasing demand for energy-efficient power solutions, and the growing adoption of GaN devices across various end-user industries. Regulatory frameworks, while generally supportive of technological advancements, may introduce sector-specific challenges impacting market growth. Product substitutes, such as silicon-based semiconductors, remain a competitive factor, although the superior performance characteristics of GaN devices are driving market penetration. End-user demographics show a strong demand from automotive, consumer electronics, and 5G infrastructure sectors, fueling considerable market expansion.
- Market Concentration: The top 5 players account for approximately xx% of the global market share in 2025.
- Innovation Drivers: Miniaturization, higher power density, and improved energy efficiency are key drivers.
- M&A Activity: Significant M&A activity is anticipated in the coming years, with deal values exceeding $xx Million annually. These activities primarily involve strategic acquisitions and partnerships to expand product portfolios and market reach.
GaN Industry Market Dynamics & Trends
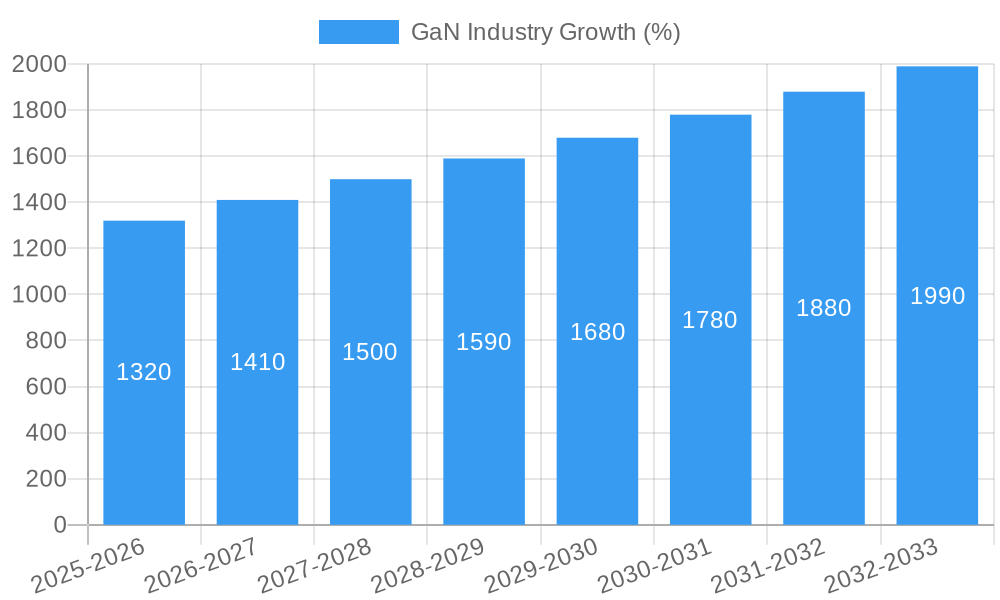
The GaN industry exhibits robust growth, driven by several converging factors. The compound annual growth rate (CAGR) is projected to be xx% during the forecast period (2025-2033). Market penetration is increasing significantly across various applications, particularly in the automotive and consumer electronics sectors. Technological disruptions, such as advancements in GaN-on-silicon technology, are contributing to cost reductions and wider adoption. Consumer preferences are increasingly favoring energy-efficient and compact electronic devices, aligning perfectly with the advantages of GaN-based solutions. Competitive dynamics are characterized by intense R&D efforts, strategic partnerships, and aggressive market expansion strategies amongst leading players. The market size is expected to reach $xx Million by 2033.
Dominant Regions & Segments in GaN Industry
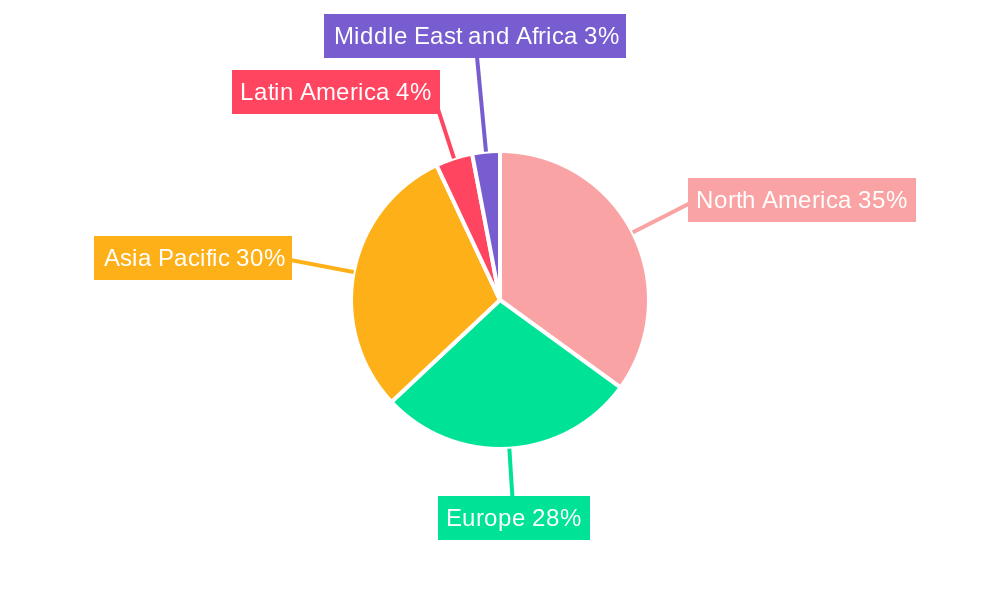
The North American and Asian markets are currently the dominant regions for GaN adoption and production, largely driven by established semiconductor manufacturing ecosystems and robust demand from key end-user industries. Within the segment breakdown:
- By Type: Power semiconductors currently hold the largest market share, followed by RF semiconductors and Opto-semiconductors.
- By Device: Transistors represent the most significant segment, with power ICs expected to show robust future growth.
- By End-user Industry: The automotive sector is anticipated to be the fastest-growing end-user segment, followed closely by consumer electronics and ICT.
Key Drivers:
- North America: Strong government support for technological advancements and a well-established semiconductor ecosystem.
- Asia: High demand from rapidly growing consumer electronics and telecommunications markets.
- Europe: Growing focus on renewable energy and energy efficiency initiatives.
GaN Industry Product Innovations
Recent advancements in GaN technology have led to the development of higher-efficiency power devices with smaller form factors. This has broadened the applications of GaN across various industries, from consumer electronics to automotive and renewable energy. GaN-based power ICs are increasingly being integrated into charging solutions, power supplies, and motor drives, enhancing overall system efficiency and performance. These advancements are driven by the need for improved energy efficiency, increased power density, and smaller device sizes.
Report Scope & Segmentation Analysis
This report provides a detailed segmentation analysis of the GaN industry, categorized by type (Power Semiconductors, Opto-Semiconductors, RF Semiconductors), device (Transistors, Diodes, Rectifiers, Power ICs), and end-user industry (Automotive, Consumer Electronics, Aerospace & Defense, Medical, ICT, Other). Each segment's growth projections, market sizes, and competitive dynamics are comprehensively analyzed, providing valuable insights into the current market landscape and future trends.
Key Drivers of GaN Industry Growth
Several key factors contribute to the growth of the GaN industry. These include advancements in GaN technology leading to higher efficiency and power density; increased demand for energy-efficient electronics in various sectors like consumer electronics, automotive, and renewable energy; growing adoption of 5G and other high-frequency applications; and supportive government policies promoting energy efficiency and technological innovation.
Challenges in the GaN Industry Sector
The GaN industry faces challenges such as high manufacturing costs, relatively limited supply chain infrastructure compared to silicon-based technologies, and the need for further advancements in thermal management solutions to fully realize GaN's potential. Moreover, intense competition and the need for continuous innovation to maintain a competitive edge present significant hurdles.
Emerging Opportunities in GaN Industry
The GaN industry presents significant opportunities in emerging markets such as electric vehicles, renewable energy, data centers, and high-speed communication infrastructure. Advancements in GaN-on-silicon technology are opening up new application possibilities, and further miniaturization and cost reduction efforts will unlock even greater market potential.
Leading Players in the GaN Industry Market
- Efficient Power Conversion Corporation
- Infineon Technologies AG
- Microchip Technology Inc
- GaN Systems
- NexGen Power Systems
- NXP Semiconductors
- Wolfspeed Inc
- Toshiba Electronic Devices & Storage Corporation
- Soitec
- Qorvo Inc
- Texas Instruments Incorporated
- NTT Advanced Technology Corporation
Key Developments in GaN Industry
- July 2023: STMicroelectronics launched large-scale manufacturing of e-mode PowerGaN HEMT devices, significantly boosting high-efficiency power conversion system development.
- January 2024: Silvaco Group, Inc. partnered with GaN Valley to advance GaN power device design using its Victory TCAD platform.
Future Outlook for GaN Industry Market
The GaN industry is poised for continued strong growth, driven by ongoing technological advancements, increasing demand from diverse sectors, and favorable government policies. Strategic investments in R&D, expansion of manufacturing capabilities, and strategic partnerships will shape the future competitive landscape, ensuring a dynamic and promising outlook for the GaN market.
GaN Industry Segmentation
-
1. Type
- 1.1. Power Semiconductors
- 1.2. Opto-Semiconductors
- 1.3. RF Semiconductors
-
2. Devices
- 2.1. Transistors
- 2.2. Diodes
- 2.3. Rectifiers
- 2.4. Power ICs
-
3. End-user Industry
- 3.1. Automotive
- 3.2. Consumer Electronics
- 3.3. Aerospace and Defense
- 3.4. Medical
- 3.5. Information Communication and Technology
- 3.6. Other End-user Industries
GaN Industry Segmentation By Geography
- 1. United States
- 2. Europe
- 3. Japan
- 4. China
- 5. Korea
- 6. Taiwan
- 7. Latin America
- 8. Middle East and Africa
GaN Industry REPORT HIGHLIGHTS
| Aspects | Details |
|---|---|
| Study Period | 2019-2033 |
| Base Year | 2024 |
| Estimated Year | 2025 |
| Forecast Period | 2025-2033 |
| Historical Period | 2019-2024 |
| Growth Rate | CAGR of 6.06% from 2019-2033 |
| Segmentation |
|
Table of Contents
- 1. Introduction
- 1.1. Research Scope
- 1.2. Market Segmentation
- 1.3. Research Methodology
- 1.4. Definitions and Assumptions
- 2. Executive Summary
- 2.1. Introduction
- 3. Market Dynamics
- 3.1. Introduction
- 3.2. Market Drivers
- 3.2.1. Strong Demand from Telecom Infrastructure Segment Driven by Advancements in 5G Implementation; Favorable Attributes Such As High-performance and Small Form Factor to Drive Adoption in the Military Segment
- 3.3. Market Restrains
- 3.3.1. ; Declining Volume of Traditional Mails; High Adoption Costs
- 3.4. Market Trends
- 3.4.1. Consumer Electronics to Hold Significant Market Share
- 4. Market Factor Analysis
- 4.1. Porters Five Forces
- 4.2. Supply/Value Chain
- 4.3. PESTEL analysis
- 4.4. Market Entropy
- 4.5. Patent/Trademark Analysis
- 5. Global GaN Industry Analysis, Insights and Forecast, 2019-2031
- 5.1. Market Analysis, Insights and Forecast - by Type
- 5.1.1. Power Semiconductors
- 5.1.2. Opto-Semiconductors
- 5.1.3. RF Semiconductors
- 5.2. Market Analysis, Insights and Forecast - by Devices
- 5.2.1. Transistors
- 5.2.2. Diodes
- 5.2.3. Rectifiers
- 5.2.4. Power ICs
- 5.3. Market Analysis, Insights and Forecast - by End-user Industry
- 5.3.1. Automotive
- 5.3.2. Consumer Electronics
- 5.3.3. Aerospace and Defense
- 5.3.4. Medical
- 5.3.5. Information Communication and Technology
- 5.3.6. Other End-user Industries
- 5.4. Market Analysis, Insights and Forecast - by Region
- 5.4.1. United States
- 5.4.2. Europe
- 5.4.3. Japan
- 5.4.4. China
- 5.4.5. Korea
- 5.4.6. Taiwan
- 5.4.7. Latin America
- 5.4.8. Middle East and Africa
- 5.1. Market Analysis, Insights and Forecast - by Type
- 6. United States GaN Industry Analysis, Insights and Forecast, 2019-2031
- 6.1. Market Analysis, Insights and Forecast - by Type
- 6.1.1. Power Semiconductors
- 6.1.2. Opto-Semiconductors
- 6.1.3. RF Semiconductors
- 6.2. Market Analysis, Insights and Forecast - by Devices
- 6.2.1. Transistors
- 6.2.2. Diodes
- 6.2.3. Rectifiers
- 6.2.4. Power ICs
- 6.3. Market Analysis, Insights and Forecast - by End-user Industry
- 6.3.1. Automotive
- 6.3.2. Consumer Electronics
- 6.3.3. Aerospace and Defense
- 6.3.4. Medical
- 6.3.5. Information Communication and Technology
- 6.3.6. Other End-user Industries
- 6.1. Market Analysis, Insights and Forecast - by Type
- 7. Europe GaN Industry Analysis, Insights and Forecast, 2019-2031
- 7.1. Market Analysis, Insights and Forecast - by Type
- 7.1.1. Power Semiconductors
- 7.1.2. Opto-Semiconductors
- 7.1.3. RF Semiconductors
- 7.2. Market Analysis, Insights and Forecast - by Devices
- 7.2.1. Transistors
- 7.2.2. Diodes
- 7.2.3. Rectifiers
- 7.2.4. Power ICs
- 7.3. Market Analysis, Insights and Forecast - by End-user Industry
- 7.3.1. Automotive
- 7.3.2. Consumer Electronics
- 7.3.3. Aerospace and Defense
- 7.3.4. Medical
- 7.3.5. Information Communication and Technology
- 7.3.6. Other End-user Industries
- 7.1. Market Analysis, Insights and Forecast - by Type
- 8. Japan GaN Industry Analysis, Insights and Forecast, 2019-2031
- 8.1. Market Analysis, Insights and Forecast - by Type
- 8.1.1. Power Semiconductors
- 8.1.2. Opto-Semiconductors
- 8.1.3. RF Semiconductors
- 8.2. Market Analysis, Insights and Forecast - by Devices
- 8.2.1. Transistors
- 8.2.2. Diodes
- 8.2.3. Rectifiers
- 8.2.4. Power ICs
- 8.3. Market Analysis, Insights and Forecast - by End-user Industry
- 8.3.1. Automotive
- 8.3.2. Consumer Electronics
- 8.3.3. Aerospace and Defense
- 8.3.4. Medical
- 8.3.5. Information Communication and Technology
- 8.3.6. Other End-user Industries
- 8.1. Market Analysis, Insights and Forecast - by Type
- 9. China GaN Industry Analysis, Insights and Forecast, 2019-2031
- 9.1. Market Analysis, Insights and Forecast - by Type
- 9.1.1. Power Semiconductors
- 9.1.2. Opto-Semiconductors
- 9.1.3. RF Semiconductors
- 9.2. Market Analysis, Insights and Forecast - by Devices
- 9.2.1. Transistors
- 9.2.2. Diodes
- 9.2.3. Rectifiers
- 9.2.4. Power ICs
- 9.3. Market Analysis, Insights and Forecast - by End-user Industry
- 9.3.1. Automotive
- 9.3.2. Consumer Electronics
- 9.3.3. Aerospace and Defense
- 9.3.4. Medical
- 9.3.5. Information Communication and Technology
- 9.3.6. Other End-user Industries
- 9.1. Market Analysis, Insights and Forecast - by Type
- 10. Korea GaN Industry Analysis, Insights and Forecast, 2019-2031
- 10.1. Market Analysis, Insights and Forecast - by Type
- 10.1.1. Power Semiconductors
- 10.1.2. Opto-Semiconductors
- 10.1.3. RF Semiconductors
- 10.2. Market Analysis, Insights and Forecast - by Devices
- 10.2.1. Transistors
- 10.2.2. Diodes
- 10.2.3. Rectifiers
- 10.2.4. Power ICs
- 10.3. Market Analysis, Insights and Forecast - by End-user Industry
- 10.3.1. Automotive
- 10.3.2. Consumer Electronics
- 10.3.3. Aerospace and Defense
- 10.3.4. Medical
- 10.3.5. Information Communication and Technology
- 10.3.6. Other End-user Industries
- 10.1. Market Analysis, Insights and Forecast - by Type
- 11. Taiwan GaN Industry Analysis, Insights and Forecast, 2019-2031
- 11.1. Market Analysis, Insights and Forecast - by Type
- 11.1.1. Power Semiconductors
- 11.1.2. Opto-Semiconductors
- 11.1.3. RF Semiconductors
- 11.2. Market Analysis, Insights and Forecast - by Devices
- 11.2.1. Transistors
- 11.2.2. Diodes
- 11.2.3. Rectifiers
- 11.2.4. Power ICs
- 11.3. Market Analysis, Insights and Forecast - by End-user Industry
- 11.3.1. Automotive
- 11.3.2. Consumer Electronics
- 11.3.3. Aerospace and Defense
- 11.3.4. Medical
- 11.3.5. Information Communication and Technology
- 11.3.6. Other End-user Industries
- 11.1. Market Analysis, Insights and Forecast - by Type
- 12. Latin America GaN Industry Analysis, Insights and Forecast, 2019-2031
- 12.1. Market Analysis, Insights and Forecast - by Type
- 12.1.1. Power Semiconductors
- 12.1.2. Opto-Semiconductors
- 12.1.3. RF Semiconductors
- 12.2. Market Analysis, Insights and Forecast - by Devices
- 12.2.1. Transistors
- 12.2.2. Diodes
- 12.2.3. Rectifiers
- 12.2.4. Power ICs
- 12.3. Market Analysis, Insights and Forecast - by End-user Industry
- 12.3.1. Automotive
- 12.3.2. Consumer Electronics
- 12.3.3. Aerospace and Defense
- 12.3.4. Medical
- 12.3.5. Information Communication and Technology
- 12.3.6. Other End-user Industries
- 12.1. Market Analysis, Insights and Forecast - by Type
- 13. Middle East and Africa GaN Industry Analysis, Insights and Forecast, 2019-2031
- 13.1. Market Analysis, Insights and Forecast - by Type
- 13.1.1. Power Semiconductors
- 13.1.2. Opto-Semiconductors
- 13.1.3. RF Semiconductors
- 13.2. Market Analysis, Insights and Forecast - by Devices
- 13.2.1. Transistors
- 13.2.2. Diodes
- 13.2.3. Rectifiers
- 13.2.4. Power ICs
- 13.3. Market Analysis, Insights and Forecast - by End-user Industry
- 13.3.1. Automotive
- 13.3.2. Consumer Electronics
- 13.3.3. Aerospace and Defense
- 13.3.4. Medical
- 13.3.5. Information Communication and Technology
- 13.3.6. Other End-user Industries
- 13.1. Market Analysis, Insights and Forecast - by Type
- 14. North America GaN Industry Analysis, Insights and Forecast, 2019-2031
- 14.1. Market Analysis, Insights and Forecast - By Country/Sub-region
- 14.1.1 United States
- 14.1.2 Canada
- 15. Europe GaN Industry Analysis, Insights and Forecast, 2019-2031
- 15.1. Market Analysis, Insights and Forecast - By Country/Sub-region
- 15.1.1 United Kingdom
- 15.1.2 Germany
- 15.1.3 France
- 15.1.4 Rest of Europe
- 16. Asia Pacific GaN Industry Analysis, Insights and Forecast, 2019-2031
- 16.1. Market Analysis, Insights and Forecast - By Country/Sub-region
- 16.1.1 China
- 16.1.2 Japan
- 16.1.3 India
- 16.1.4 South Korea
- 16.1.5 Rest of Asia Pacific
- 17. Latin America GaN Industry Analysis, Insights and Forecast, 2019-2031
- 17.1. Market Analysis, Insights and Forecast - By Country/Sub-region
- 17.1.1.
- 18. Middle East and Africa GaN Industry Analysis, Insights and Forecast, 2019-2031
- 18.1. Market Analysis, Insights and Forecast - By Country/Sub-region
- 18.1.1.
- 19. Competitive Analysis
- 19.1. Global Market Share Analysis 2024
- 19.2. Company Profiles
- 19.2.1 Efficient Power Conversion Corporation
- 19.2.1.1. Overview
- 19.2.1.2. Products
- 19.2.1.3. SWOT Analysis
- 19.2.1.4. Recent Developments
- 19.2.1.5. Financials (Based on Availability)
- 19.2.2 Infineon Technologies AG
- 19.2.2.1. Overview
- 19.2.2.2. Products
- 19.2.2.3. SWOT Analysis
- 19.2.2.4. Recent Developments
- 19.2.2.5. Financials (Based on Availability)
- 19.2.3 Microchip Technology Inc
- 19.2.3.1. Overview
- 19.2.3.2. Products
- 19.2.3.3. SWOT Analysis
- 19.2.3.4. Recent Developments
- 19.2.3.5. Financials (Based on Availability)
- 19.2.4 GaN Systems
- 19.2.4.1. Overview
- 19.2.4.2. Products
- 19.2.4.3. SWOT Analysis
- 19.2.4.4. Recent Developments
- 19.2.4.5. Financials (Based on Availability)
- 19.2.5 NexGen Power Systems
- 19.2.5.1. Overview
- 19.2.5.2. Products
- 19.2.5.3. SWOT Analysis
- 19.2.5.4. Recent Developments
- 19.2.5.5. Financials (Based on Availability)
- 19.2.6 NXP Semiconductors
- 19.2.6.1. Overview
- 19.2.6.2. Products
- 19.2.6.3. SWOT Analysis
- 19.2.6.4. Recent Developments
- 19.2.6.5. Financials (Based on Availability)
- 19.2.7 Wolfspeed Inc
- 19.2.7.1. Overview
- 19.2.7.2. Products
- 19.2.7.3. SWOT Analysis
- 19.2.7.4. Recent Developments
- 19.2.7.5. Financials (Based on Availability)
- 19.2.8 Toshiba Electronic Devices & Storage Corporation
- 19.2.8.1. Overview
- 19.2.8.2. Products
- 19.2.8.3. SWOT Analysis
- 19.2.8.4. Recent Developments
- 19.2.8.5. Financials (Based on Availability)
- 19.2.9 Soitec
- 19.2.9.1. Overview
- 19.2.9.2. Products
- 19.2.9.3. SWOT Analysis
- 19.2.9.4. Recent Developments
- 19.2.9.5. Financials (Based on Availability)
- 19.2.10 Qorvo Inc
- 19.2.10.1. Overview
- 19.2.10.2. Products
- 19.2.10.3. SWOT Analysis
- 19.2.10.4. Recent Developments
- 19.2.10.5. Financials (Based on Availability)
- 19.2.11 Texas Instruments Incorporated
- 19.2.11.1. Overview
- 19.2.11.2. Products
- 19.2.11.3. SWOT Analysis
- 19.2.11.4. Recent Developments
- 19.2.11.5. Financials (Based on Availability)
- 19.2.12 NTT Advanced Technology Corporation*List Not Exhaustive
- 19.2.12.1. Overview
- 19.2.12.2. Products
- 19.2.12.3. SWOT Analysis
- 19.2.12.4. Recent Developments
- 19.2.12.5. Financials (Based on Availability)
- 19.2.1 Efficient Power Conversion Corporation
List of Figures
- Figure 1: Global GaN Industry Revenue Breakdown (Million, %) by Region 2024 & 2032
- Figure 2: North America GaN Industry Revenue (Million), by Country 2024 & 2032
- Figure 3: North America GaN Industry Revenue Share (%), by Country 2024 & 2032
- Figure 4: Europe GaN Industry Revenue (Million), by Country 2024 & 2032
- Figure 5: Europe GaN Industry Revenue Share (%), by Country 2024 & 2032
- Figure 6: Asia Pacific GaN Industry Revenue (Million), by Country 2024 & 2032
- Figure 7: Asia Pacific GaN Industry Revenue Share (%), by Country 2024 & 2032
- Figure 8: Latin America GaN Industry Revenue (Million), by Country 2024 & 2032
- Figure 9: Latin America GaN Industry Revenue Share (%), by Country 2024 & 2032
- Figure 10: Middle East and Africa GaN Industry Revenue (Million), by Country 2024 & 2032
- Figure 11: Middle East and Africa GaN Industry Revenue Share (%), by Country 2024 & 2032
- Figure 12: United States GaN Industry Revenue (Million), by Type 2024 & 2032
- Figure 13: United States GaN Industry Revenue Share (%), by Type 2024 & 2032
- Figure 14: United States GaN Industry Revenue (Million), by Devices 2024 & 2032
- Figure 15: United States GaN Industry Revenue Share (%), by Devices 2024 & 2032
- Figure 16: United States GaN Industry Revenue (Million), by End-user Industry 2024 & 2032
- Figure 17: United States GaN Industry Revenue Share (%), by End-user Industry 2024 & 2032
- Figure 18: United States GaN Industry Revenue (Million), by Country 2024 & 2032
- Figure 19: United States GaN Industry Revenue Share (%), by Country 2024 & 2032
- Figure 20: Europe GaN Industry Revenue (Million), by Type 2024 & 2032
- Figure 21: Europe GaN Industry Revenue Share (%), by Type 2024 & 2032
- Figure 22: Europe GaN Industry Revenue (Million), by Devices 2024 & 2032
- Figure 23: Europe GaN Industry Revenue Share (%), by Devices 2024 & 2032
- Figure 24: Europe GaN Industry Revenue (Million), by End-user Industry 2024 & 2032
- Figure 25: Europe GaN Industry Revenue Share (%), by End-user Industry 2024 & 2032
- Figure 26: Europe GaN Industry Revenue (Million), by Country 2024 & 2032
- Figure 27: Europe GaN Industry Revenue Share (%), by Country 2024 & 2032
- Figure 28: Japan GaN Industry Revenue (Million), by Type 2024 & 2032
- Figure 29: Japan GaN Industry Revenue Share (%), by Type 2024 & 2032
- Figure 30: Japan GaN Industry Revenue (Million), by Devices 2024 & 2032
- Figure 31: Japan GaN Industry Revenue Share (%), by Devices 2024 & 2032
- Figure 32: Japan GaN Industry Revenue (Million), by End-user Industry 2024 & 2032
- Figure 33: Japan GaN Industry Revenue Share (%), by End-user Industry 2024 & 2032
- Figure 34: Japan GaN Industry Revenue (Million), by Country 2024 & 2032
- Figure 35: Japan GaN Industry Revenue Share (%), by Country 2024 & 2032
- Figure 36: China GaN Industry Revenue (Million), by Type 2024 & 2032
- Figure 37: China GaN Industry Revenue Share (%), by Type 2024 & 2032
- Figure 38: China GaN Industry Revenue (Million), by Devices 2024 & 2032
- Figure 39: China GaN Industry Revenue Share (%), by Devices 2024 & 2032
- Figure 40: China GaN Industry Revenue (Million), by End-user Industry 2024 & 2032
- Figure 41: China GaN Industry Revenue Share (%), by End-user Industry 2024 & 2032
- Figure 42: China GaN Industry Revenue (Million), by Country 2024 & 2032
- Figure 43: China GaN Industry Revenue Share (%), by Country 2024 & 2032
- Figure 44: Korea GaN Industry Revenue (Million), by Type 2024 & 2032
- Figure 45: Korea GaN Industry Revenue Share (%), by Type 2024 & 2032
- Figure 46: Korea GaN Industry Revenue (Million), by Devices 2024 & 2032
- Figure 47: Korea GaN Industry Revenue Share (%), by Devices 2024 & 2032
- Figure 48: Korea GaN Industry Revenue (Million), by End-user Industry 2024 & 2032
- Figure 49: Korea GaN Industry Revenue Share (%), by End-user Industry 2024 & 2032
- Figure 50: Korea GaN Industry Revenue (Million), by Country 2024 & 2032
- Figure 51: Korea GaN Industry Revenue Share (%), by Country 2024 & 2032
- Figure 52: Taiwan GaN Industry Revenue (Million), by Type 2024 & 2032
- Figure 53: Taiwan GaN Industry Revenue Share (%), by Type 2024 & 2032
- Figure 54: Taiwan GaN Industry Revenue (Million), by Devices 2024 & 2032
- Figure 55: Taiwan GaN Industry Revenue Share (%), by Devices 2024 & 2032
- Figure 56: Taiwan GaN Industry Revenue (Million), by End-user Industry 2024 & 2032
- Figure 57: Taiwan GaN Industry Revenue Share (%), by End-user Industry 2024 & 2032
- Figure 58: Taiwan GaN Industry Revenue (Million), by Country 2024 & 2032
- Figure 59: Taiwan GaN Industry Revenue Share (%), by Country 2024 & 2032
- Figure 60: Latin America GaN Industry Revenue (Million), by Type 2024 & 2032
- Figure 61: Latin America GaN Industry Revenue Share (%), by Type 2024 & 2032
- Figure 62: Latin America GaN Industry Revenue (Million), by Devices 2024 & 2032
- Figure 63: Latin America GaN Industry Revenue Share (%), by Devices 2024 & 2032
- Figure 64: Latin America GaN Industry Revenue (Million), by End-user Industry 2024 & 2032
- Figure 65: Latin America GaN Industry Revenue Share (%), by End-user Industry 2024 & 2032
- Figure 66: Latin America GaN Industry Revenue (Million), by Country 2024 & 2032
- Figure 67: Latin America GaN Industry Revenue Share (%), by Country 2024 & 2032
- Figure 68: Middle East and Africa GaN Industry Revenue (Million), by Type 2024 & 2032
- Figure 69: Middle East and Africa GaN Industry Revenue Share (%), by Type 2024 & 2032
- Figure 70: Middle East and Africa GaN Industry Revenue (Million), by Devices 2024 & 2032
- Figure 71: Middle East and Africa GaN Industry Revenue Share (%), by Devices 2024 & 2032
- Figure 72: Middle East and Africa GaN Industry Revenue (Million), by End-user Industry 2024 & 2032
- Figure 73: Middle East and Africa GaN Industry Revenue Share (%), by End-user Industry 2024 & 2032
- Figure 74: Middle East and Africa GaN Industry Revenue (Million), by Country 2024 & 2032
- Figure 75: Middle East and Africa GaN Industry Revenue Share (%), by Country 2024 & 2032
List of Tables
- Table 1: Global GaN Industry Revenue Million Forecast, by Region 2019 & 2032
- Table 2: Global GaN Industry Revenue Million Forecast, by Type 2019 & 2032
- Table 3: Global GaN Industry Revenue Million Forecast, by Devices 2019 & 2032
- Table 4: Global GaN Industry Revenue Million Forecast, by End-user Industry 2019 & 2032
- Table 5: Global GaN Industry Revenue Million Forecast, by Region 2019 & 2032
- Table 6: Global GaN Industry Revenue Million Forecast, by Country 2019 & 2032
- Table 7: United States GaN Industry Revenue (Million) Forecast, by Application 2019 & 2032
- Table 8: Canada GaN Industry Revenue (Million) Forecast, by Application 2019 & 2032
- Table 9: Global GaN Industry Revenue Million Forecast, by Country 2019 & 2032
- Table 10: United Kingdom GaN Industry Revenue (Million) Forecast, by Application 2019 & 2032
- Table 11: Germany GaN Industry Revenue (Million) Forecast, by Application 2019 & 2032
- Table 12: France GaN Industry Revenue (Million) Forecast, by Application 2019 & 2032
- Table 13: Rest of Europe GaN Industry Revenue (Million) Forecast, by Application 2019 & 2032
- Table 14: Global GaN Industry Revenue Million Forecast, by Country 2019 & 2032
- Table 15: China GaN Industry Revenue (Million) Forecast, by Application 2019 & 2032
- Table 16: Japan GaN Industry Revenue (Million) Forecast, by Application 2019 & 2032
- Table 17: India GaN Industry Revenue (Million) Forecast, by Application 2019 & 2032
- Table 18: South Korea GaN Industry Revenue (Million) Forecast, by Application 2019 & 2032
- Table 19: Rest of Asia Pacific GaN Industry Revenue (Million) Forecast, by Application 2019 & 2032
- Table 20: Global GaN Industry Revenue Million Forecast, by Country 2019 & 2032
- Table 21: GaN Industry Revenue (Million) Forecast, by Application 2019 & 2032
- Table 22: Global GaN Industry Revenue Million Forecast, by Country 2019 & 2032
- Table 23: GaN Industry Revenue (Million) Forecast, by Application 2019 & 2032
- Table 24: Global GaN Industry Revenue Million Forecast, by Type 2019 & 2032
- Table 25: Global GaN Industry Revenue Million Forecast, by Devices 2019 & 2032
- Table 26: Global GaN Industry Revenue Million Forecast, by End-user Industry 2019 & 2032
- Table 27: Global GaN Industry Revenue Million Forecast, by Country 2019 & 2032
- Table 28: Global GaN Industry Revenue Million Forecast, by Type 2019 & 2032
- Table 29: Global GaN Industry Revenue Million Forecast, by Devices 2019 & 2032
- Table 30: Global GaN Industry Revenue Million Forecast, by End-user Industry 2019 & 2032
- Table 31: Global GaN Industry Revenue Million Forecast, by Country 2019 & 2032
- Table 32: Global GaN Industry Revenue Million Forecast, by Type 2019 & 2032
- Table 33: Global GaN Industry Revenue Million Forecast, by Devices 2019 & 2032
- Table 34: Global GaN Industry Revenue Million Forecast, by End-user Industry 2019 & 2032
- Table 35: Global GaN Industry Revenue Million Forecast, by Country 2019 & 2032
- Table 36: Global GaN Industry Revenue Million Forecast, by Type 2019 & 2032
- Table 37: Global GaN Industry Revenue Million Forecast, by Devices 2019 & 2032
- Table 38: Global GaN Industry Revenue Million Forecast, by End-user Industry 2019 & 2032
- Table 39: Global GaN Industry Revenue Million Forecast, by Country 2019 & 2032
- Table 40: Global GaN Industry Revenue Million Forecast, by Type 2019 & 2032
- Table 41: Global GaN Industry Revenue Million Forecast, by Devices 2019 & 2032
- Table 42: Global GaN Industry Revenue Million Forecast, by End-user Industry 2019 & 2032
- Table 43: Global GaN Industry Revenue Million Forecast, by Country 2019 & 2032
- Table 44: Global GaN Industry Revenue Million Forecast, by Type 2019 & 2032
- Table 45: Global GaN Industry Revenue Million Forecast, by Devices 2019 & 2032
- Table 46: Global GaN Industry Revenue Million Forecast, by End-user Industry 2019 & 2032
- Table 47: Global GaN Industry Revenue Million Forecast, by Country 2019 & 2032
- Table 48: Global GaN Industry Revenue Million Forecast, by Type 2019 & 2032
- Table 49: Global GaN Industry Revenue Million Forecast, by Devices 2019 & 2032
- Table 50: Global GaN Industry Revenue Million Forecast, by End-user Industry 2019 & 2032
- Table 51: Global GaN Industry Revenue Million Forecast, by Country 2019 & 2032
- Table 52: Global GaN Industry Revenue Million Forecast, by Type 2019 & 2032
- Table 53: Global GaN Industry Revenue Million Forecast, by Devices 2019 & 2032
- Table 54: Global GaN Industry Revenue Million Forecast, by End-user Industry 2019 & 2032
- Table 55: Global GaN Industry Revenue Million Forecast, by Country 2019 & 2032
Frequently Asked Questions
1. What is the projected Compound Annual Growth Rate (CAGR) of the GaN Industry?
The projected CAGR is approximately 6.06%.
2. Which companies are prominent players in the GaN Industry?
Key companies in the market include Efficient Power Conversion Corporation, Infineon Technologies AG, Microchip Technology Inc, GaN Systems, NexGen Power Systems, NXP Semiconductors, Wolfspeed Inc, Toshiba Electronic Devices & Storage Corporation, Soitec, Qorvo Inc, Texas Instruments Incorporated, NTT Advanced Technology Corporation*List Not Exhaustive.
3. What are the main segments of the GaN Industry?
The market segments include Type, Devices, End-user Industry.
4. Can you provide details about the market size?
The market size is estimated to be USD 21.18 Million as of 2022.
5. What are some drivers contributing to market growth?
Strong Demand from Telecom Infrastructure Segment Driven by Advancements in 5G Implementation; Favorable Attributes Such As High-performance and Small Form Factor to Drive Adoption in the Military Segment.
6. What are the notable trends driving market growth?
Consumer Electronics to Hold Significant Market Share.
7. Are there any restraints impacting market growth?
; Declining Volume of Traditional Mails; High Adoption Costs.
8. Can you provide examples of recent developments in the market?
Jan 2024: Silvaco Group, Inc., a leading provider of TCAD, EDA software, and design IP, partnered with GaN Valley to drive advancements in efficient gallium nitride (GaN) power device design. By leveraging its Victory TCAD platform, Silvaco aims to empower customers to innovate and optimize performance in GaN-based semiconductor power devices. The Victory TCAD platform offers a comprehensive simulation environment, incorporating diverse numerical methods, physical models, SPICE model generation, and a user-friendly graphical interface, tailored specifically for the latest generation of GaN-based power devices.
9. What pricing options are available for accessing the report?
Pricing options include single-user, multi-user, and enterprise licenses priced at USD 4750, USD 5250, and USD 8750 respectively.
10. Is the market size provided in terms of value or volume?
The market size is provided in terms of value, measured in Million.
11. Are there any specific market keywords associated with the report?
Yes, the market keyword associated with the report is "GaN Industry," which aids in identifying and referencing the specific market segment covered.
12. How do I determine which pricing option suits my needs best?
The pricing options vary based on user requirements and access needs. Individual users may opt for single-user licenses, while businesses requiring broader access may choose multi-user or enterprise licenses for cost-effective access to the report.
13. Are there any additional resources or data provided in the GaN Industry report?
While the report offers comprehensive insights, it's advisable to review the specific contents or supplementary materials provided to ascertain if additional resources or data are available.
14. How can I stay updated on further developments or reports in the GaN Industry?
To stay informed about further developments, trends, and reports in the GaN Industry, consider subscribing to industry newsletters, following relevant companies and organizations, or regularly checking reputable industry news sources and publications.
Methodology
Step 1 - Identification of Relevant Samples Size from Population Database


Step 2 - Approaches for Defining Global Market Size (Value, Volume* & Price*)

Note*: In applicable scenarios
Step 3 - Data Sources
Primary Research
- Web Analytics
- Survey Reports
- Research Institute
- Latest Research Reports
- Opinion Leaders
Secondary Research
- Annual Reports
- White Paper
- Latest Press Release
- Industry Association
- Paid Database
- Investor Presentations

Step 4 - Data Triangulation
Involves using different sources of information in order to increase the validity of a study
These sources are likely to be stakeholders in a program - participants, other researchers, program staff, other community members, and so on.
Then we put all data in single framework & apply various statistical tools to find out the dynamic on the market.
During the analysis stage, feedback from the stakeholder groups would be compared to determine areas of agreement as well as areas of divergence


